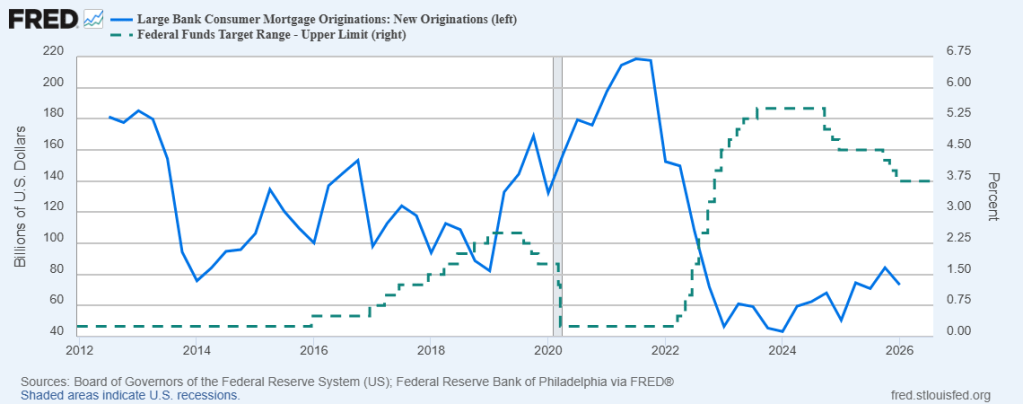
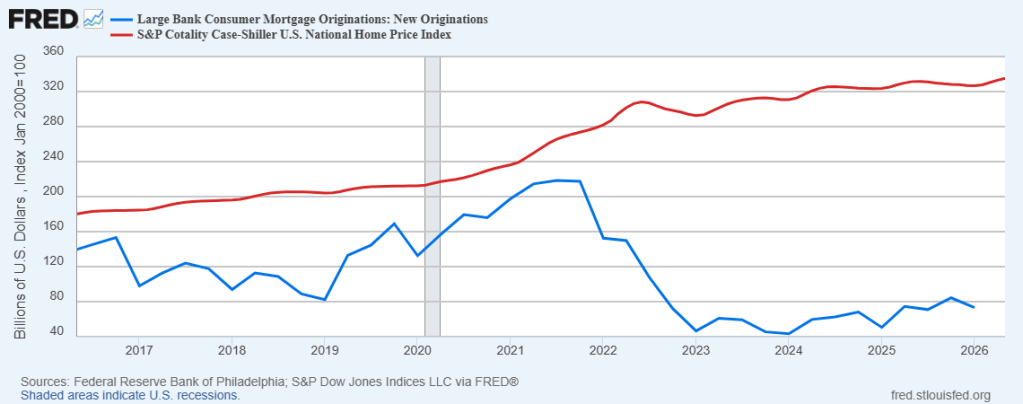
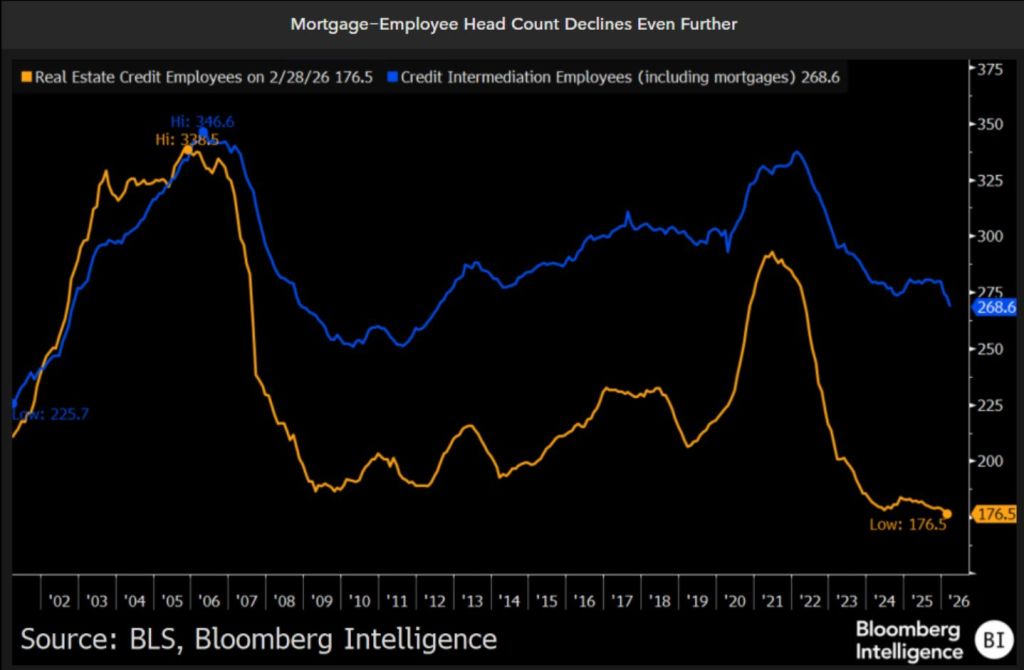
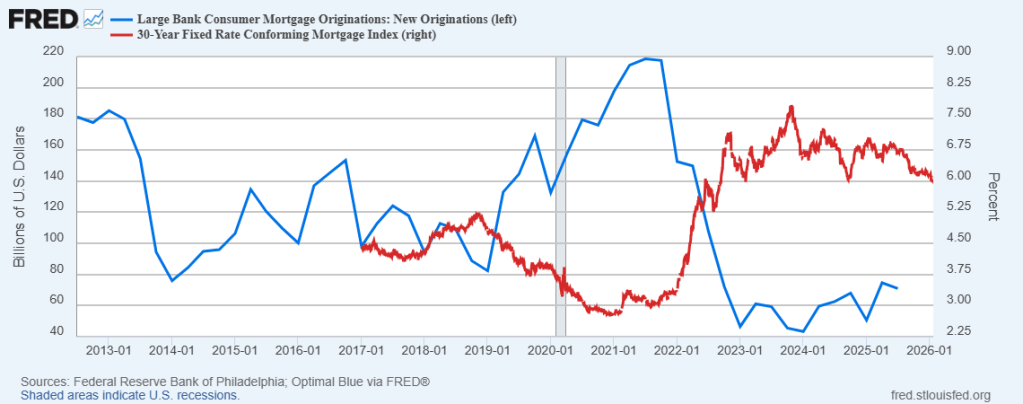
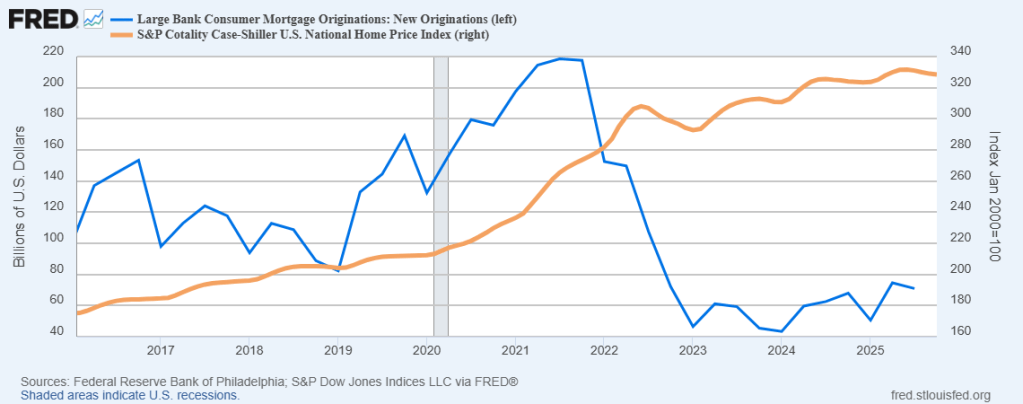
Large bank mortgage originations have crashed and burned since 2022. The Fed has raised rates following the Covid outbreak and have not cut rates in a significant manner.
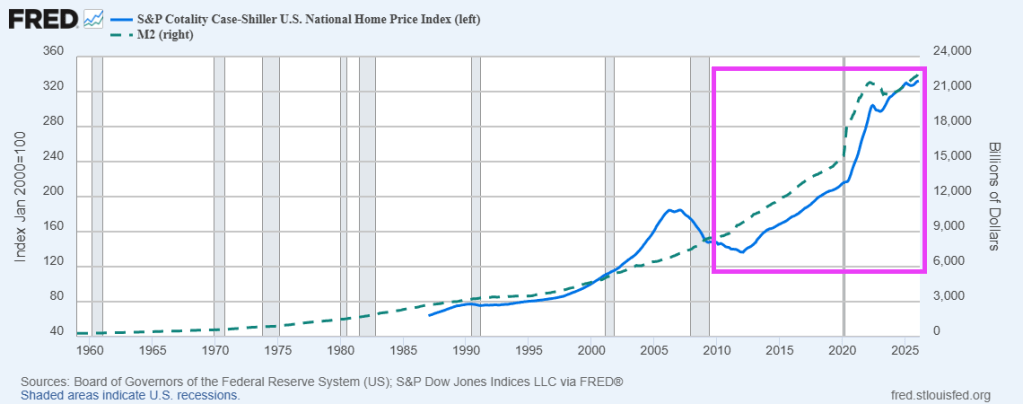
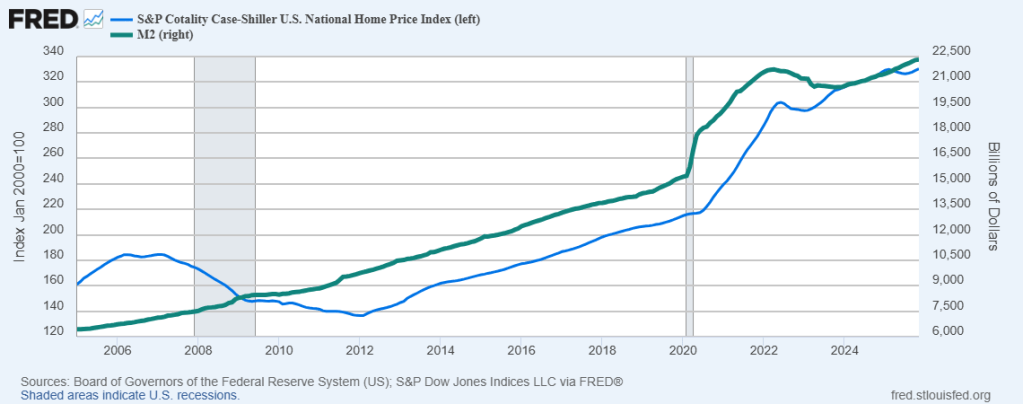
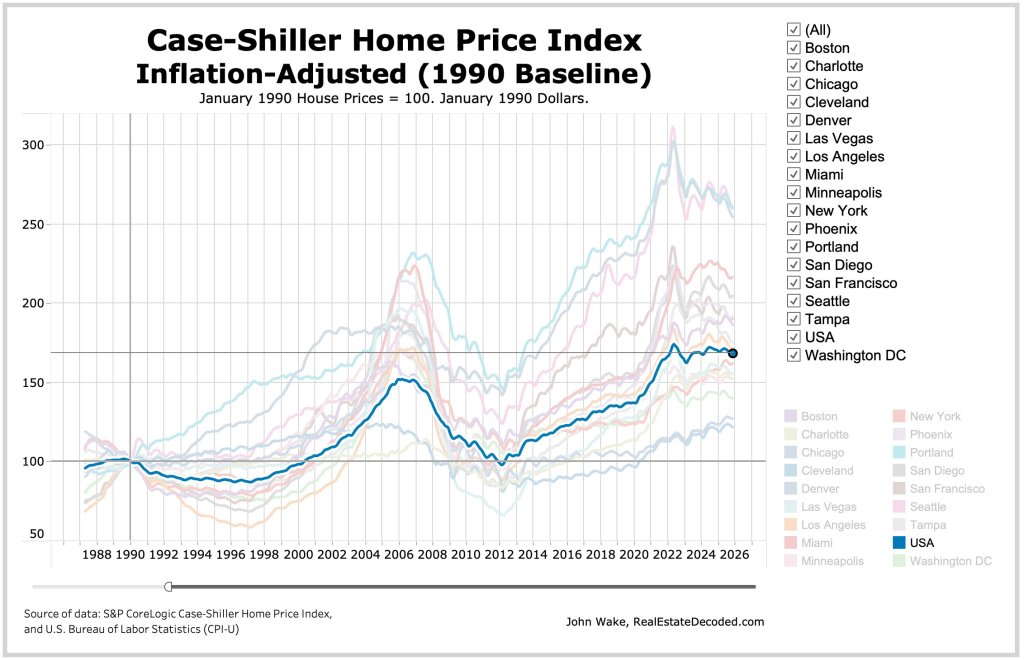
Another problem facing the US economy is that housing prices have over doubled since 2015.
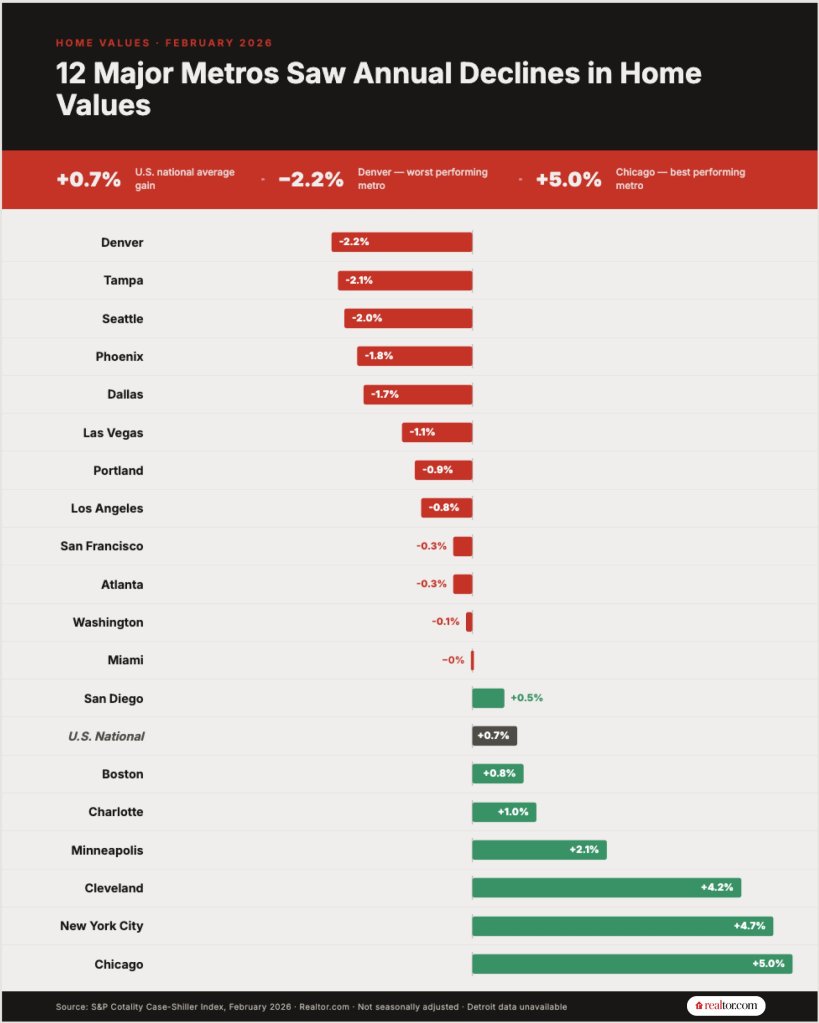
More than half of major U.S. metropolitan areas posted year-over-year home price declines in February, with Denver (-2.2%) displacing Tampa (-2.1%) as the weakest market, according to data from the S&P Cotality Case-Shiller Index released Tuesday.
Los Angeles (-0.8%) and Washington, DC (-0.1%) also joined the list of markets with falling home values, signaling weakness that expanding out of the long-suffering Sunbelt region.
kkk
Mortgage employee headcount has fallen to lowest level since the housing bubble and mortgage crisis of 2005-2008.
So much for the “Trump has ruined the economy” mantra of politicians and celebrities.
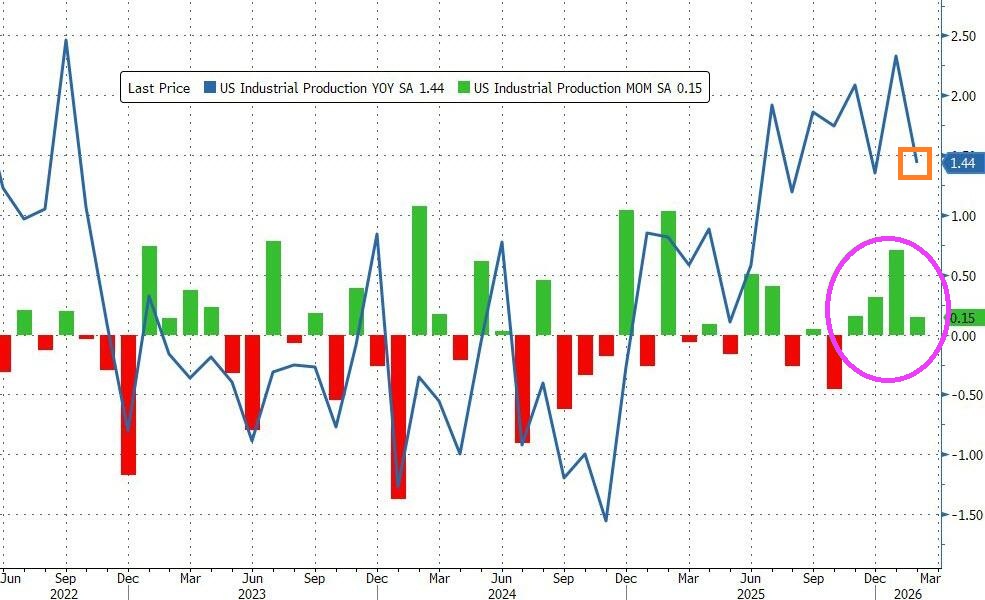
After a strong gain in January, US Industrial Production continued to expand in February, rising 0.2% MoM (better than expected +0.1%) – the fourth straight month of gains with Production up 1.44% YoY.
Source: Bloomberg
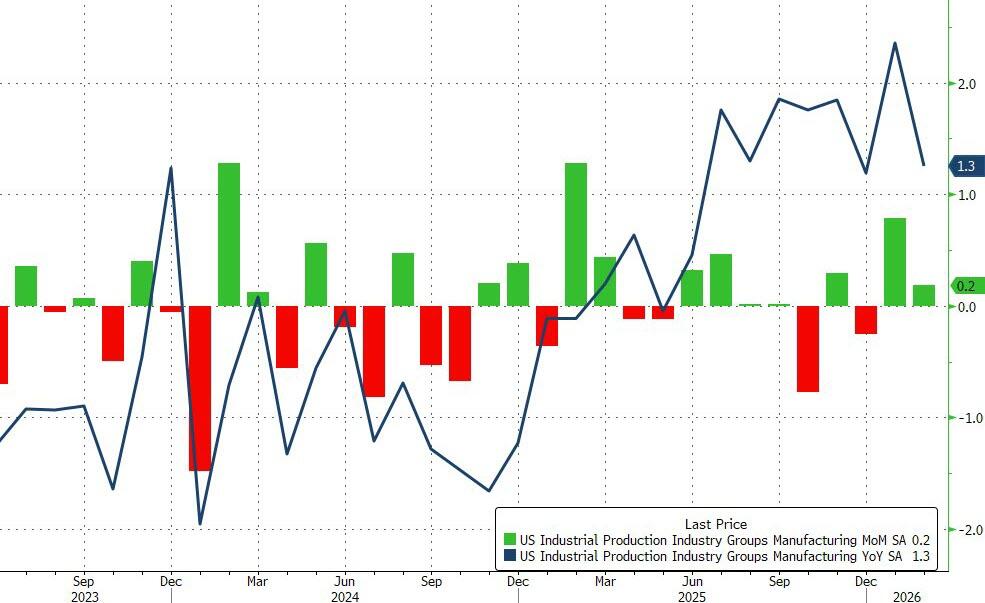
Manufacturing output also beat expectations, rising 0.2% MoM in February.
Durable manufacturing output edged up 0.1 percent, with mixed results across categories; the index for motor vehicles and parts posted the largest gain, and the index for machinery posted the largest loss.
Nondurable manufacturing output rose 0.2 percent, with gains in the production of chemicals, of plastic and rubber products, and of paper products outweighing declines in the output of petroleum and coal products and of food, beverage, and tobacco products. The output of other manufacturing (publishing and logging) rose 1.3 percent.
Mining output increased 0.8 percent in February, following a 0.9 percent increase in January. The output of utilities fell 0.6 percent in February, reflecting no change in the index for electric utilities and a 4.7 percent drop in the index for natural gas utilities.
Source: Bloomberg
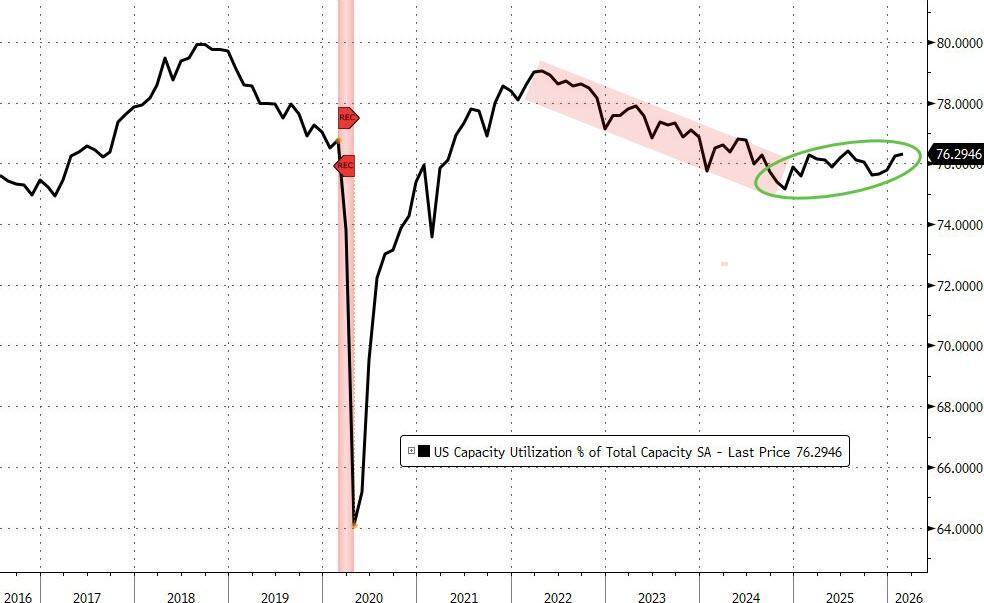
Capacity Utilization printed 76.3 (better than expected)…
…maintaining the positive trend since Trump’s second term began.
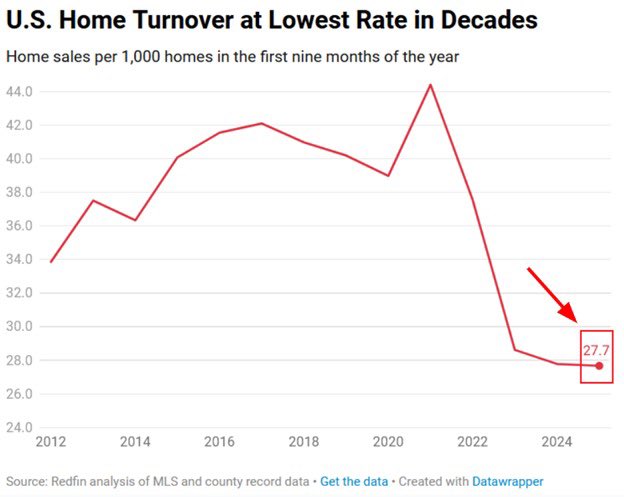
Home prices exploded under Biden and Covid Federal spending. Making housing unaffordable for millions. Now the turnover rates for homes is at its lowesst rate in decades.
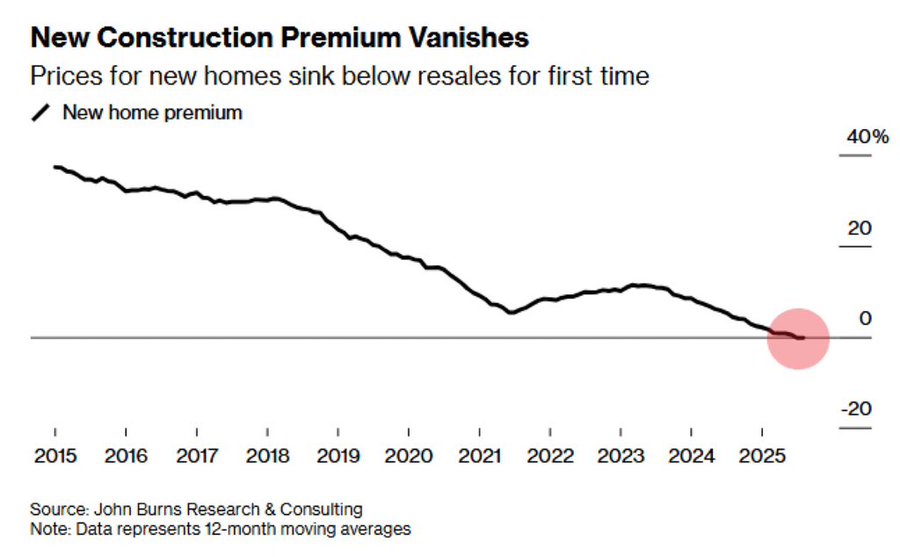
Existing homes are now more expensive than new homes.
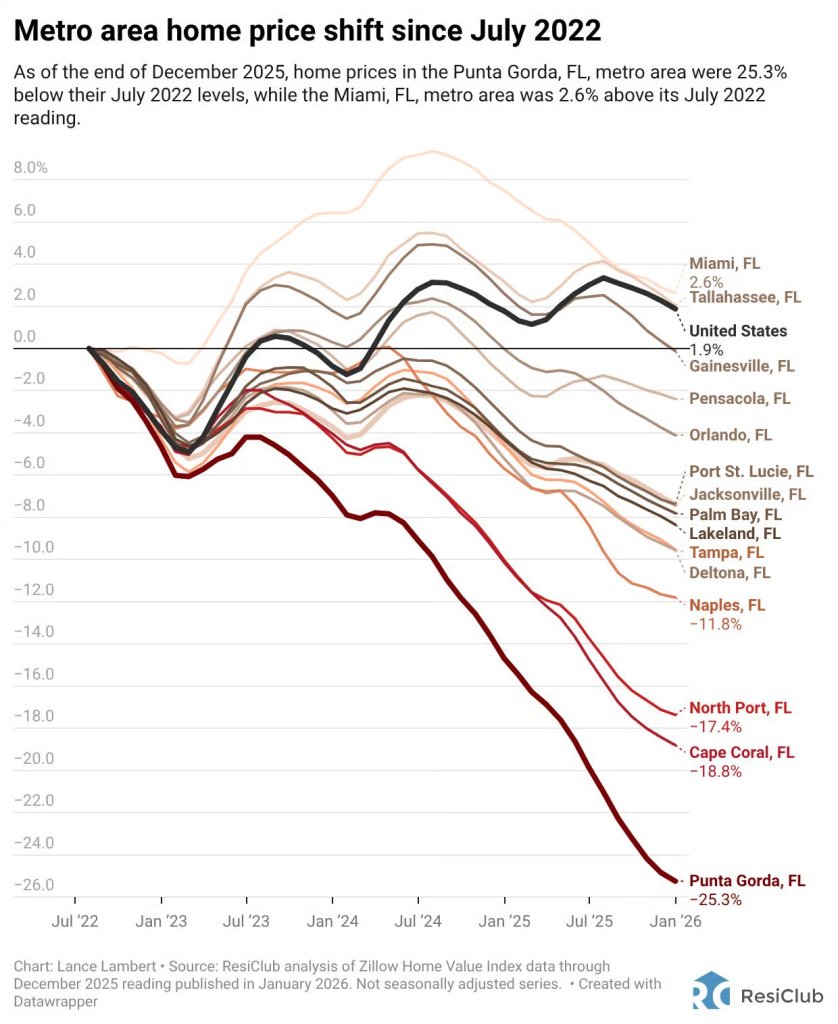
Florida housing is getting gut-punched from Naples to Punta Gorda.
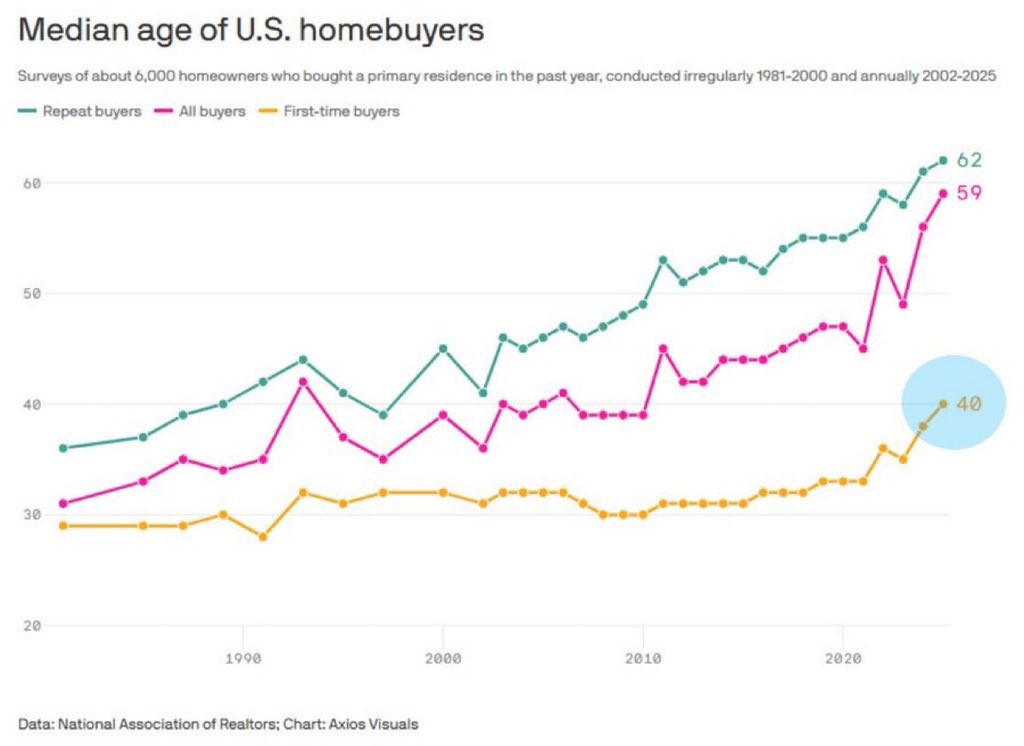
Yikes! Median age of first time homebuyers is 40.
Fortunately, Joe Biden is out of office. But Chuck Schumer may make a comeback and restart the insane Covid-era spending. Schumer, the penultimate knucklehead in Congress, approved Ketanji Brown Jackson to sit on the Supreme Court of the USA.
Keep on printing money. It seems that home price growth requires The Fed to keep printing money.
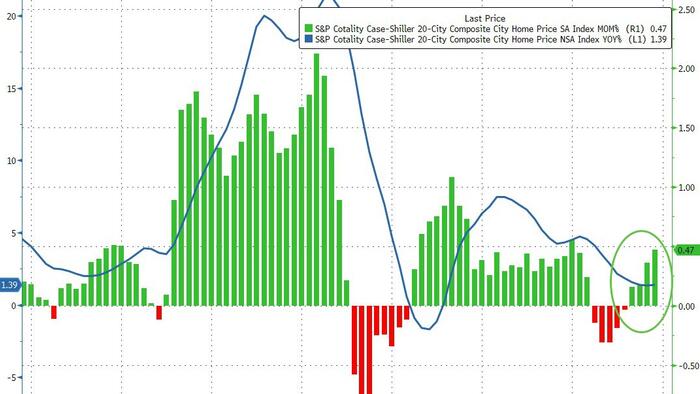
S&P/Case-Shiller released the monthly Home Price Indices for November (“November” is a 3-month average of September, October and November closing prices). September closing prices include some contracts signed in July, so there is a significant lag to this data. Here is a graph of the month-over-month (MoM) change in the Case-Shiller National Index Seasonally Adjusted (SA).
The S&P Cotality Case-Shiller U.S. National Home Price NSA Index posted a 1.4% annual gain for November, in line with the previous month.
Real home values declined as consumer inflation (2.7%) outpaced the National Index gain (1.4%) by 1.3 percentage points.
Regional divergence persisted: Midwestern and Northeastern markets led by Chicago (+5.7%) and New York (+5.0%) posted gains, while Sun Belt cities including Tampa (–3.9%), Phoenix (–1.4%), Dallas (–1.4%), and Miami (–1.0%) saw declines. … “Regional patterns continue to illustrate a stark divergence. Chicago leads all cities for a second consecutive month with a 5.7% year-over-year price increase, followed by New York at 5.0% and Cleveland at 3.4%. These historically steady Midwestern and Northeastern markets have maintained respectable gains even as overall conditions cool. By contrast, Tampa home prices are 3.9% lower than a year ago – the steepest decline among the 20 cities, extending that market’s 13-month streak of annual drops. Other Sun Belt boomtowns remain under pressure as well: Phoenix (-1.4%), Dallas (-1.4%), and Miami (-1.0%) each continue to see year-over-year declines, a dramatic turnaround from their pandemic-era strength.
“Monthly price changes were mixed but leaned negative in November, underscoring persistent softness. On a non-seasonally adjusted basis, 15 of the 20 major metro areas saw prices decline from October (versus 16 declines in the previous month). Only a handful of markets – including Los Angeles, San Diego, Miami, New York, and Phoenix – eked out slight gains before seasonal adjustment. After accounting for typical seasonal slowing, the National Index inched up just 0.4% for the month, indicating that price momentum remains muted. … The S&P Cotality Case-Shiller U.S. National Home Price NSA Index, covering all nine U.S. census divisions, reported a 1.4% annual gain for November. The 10-City Composite showed an annual increase of 2.0%, up from a 1.9% increase in the previous month. The 20-City Composite posted a year-over-year increase of 1.4%, up from a 1.3% increase in the previous month. … The pre-seasonally adjusted U.S. National Index saw a drop of 0.1% and the 20-City Composite Index fell 0.03%, while the 10-City Composite Index increased 0.1%.
After seasonal adjustment, the U.S. National Index reported a monthly increase of 0.4%, and both the 10-City Composite and 20-City Composite Indices posted month-over-month gains of 0.5%.










You must be logged in to post a comment.