The US debt and Federal spending is out of control. As is entitlement spending.
Then the numbers spiraled out of control. Yet Biden/Congress keep shoveling money to Ukraine and leave our borders unsecured.
Washington’s fiscal situation has drastically changed since then; total debt has surpassed $34 trillion, the annual budget shortfall exceeds $1 trillion, and interest costs have topped $1 trillion.
David Walker, the former comptroller general of the United States and a Main Street Economics advisory board member, is unsurprised.
Seventeen years ago, Mr. Walker rang fiscal alarm bells. Like Ross Perot before him, he took his case to the American people and delivered the cold, hard truth: The government’s books are unsustainable, and interest charges on the mounting debt will swallow a significant portion of federal revenues.
During this time, the former head of the Government Accountability Office (GAO) appeared on a widely viewed episode of “60 Minutes,” toured the country to spotlight worrisome trends in the U.S. government’s budget (he did this again in 2012), and attempted to convince lawmakers of the unsustainable fiscal path.
He also penned a 2009 book titled “Comeback America: Turning the Country Around and Restoring Fiscal Responsibility.”
Given the treasure trove of budgetary numbers coming out of the nation’s capital almost daily, such as nearly half of income tax revenues being dedicated to interest payments, Mr. Walker’s warnings have not been heeded nearly two decades later.
According to the Congressional Budget Office’s long-term outlooks, the national debt will eye $50 trillion by 2034, fueled by around $17 trillion in cumulative deficits. As a percentage of GDP, debt held by the public and the deficit will reach 166 percent and 8.5 percent by 2054, respectively, the CBO forecasts.
“Washington has become addicted to spending, deficits, and debt, and they’re charging the credit card and planning to send the bill to younger and future generations of Americans,” Mr. Walker told The Epoch Times.
“That’s irresponsible. It’s unethical, and it’s immoral, and it needs to stop.”
Is the United States past the point of no return?
“Only God knows when the tipping point is going to occur, and God’s not telling us,” he said.
He combs through various metrics to gauge the situation.
One of these is the debt-to-GDP ratio, which is presently at about 122 percent. Outside of the coronavirus pandemic, this is a record high.
Mandatory spending as a percentage of the federal budget is another metric. It currently stands at around 73 percent.
Another one is interest as a percentage of the budget, which is close to 15 percent.
For Mr. Walker, it is not only raw numbers but what the trends are displaying, which requires a deep dive into demographics.
“We have an aging society with longer lifespans, relatively fewer workers, supporting more retirees, and a skills gap,” he noted.
Last year, two notable developments happened: a majority of Baby Boomers were at least 65, and the birth rate tumbled to the lowest in a century.
This will metastasize into a costly burden for the federal government, particularly Social Security.
The Peter G. Peterson Foundation estimates that the current worker-to-beneficiary ratio is 2.8-to-1, down from 5.1-to-1 in 1960. By 2035, the Social Security Administration projects the ratio will further slide to 2.3-to-1.
Republicans and Democrats
President Joe Biden has claimed that he has acted fiscally responsibly, telling a crowd at a North America’s Building Trades Unions event on April 24 that he cut the national debt. (Insert a TV laugh track here). President Biden has repeatedly touted this claim over the last 18 months, although he has added close to $7 trillion to the national debt since taking office in 2021.

While Republicans have griped over the current administration’s spending endeavors, experts assert that the GOP has also contributed trillions of dollars to the debt pile. One of the GOP-led expansionist initiatives was Medicare Part D under former President George W. Bush.
This program, which was designed to utilize private health care plans to offer drug coverage to Medicare beneficiaries, added $8 trillion in new unfunded obligations. Mr. Walker accepted that “the politicians were totally out of touch with fiscal reality,” considering that Medicare was already underfunded by $19 trillion.
Put simply, both parties have been fiscally irresponsible, and now the bills are coming due.
Mr. Walker purported that politicians suffer from myopia as they are too focused on the next election and, as a result, fearful of making tough decisions. They also experience tunnel vision, he says, meaning they only concentrate on one issue at a time “without understanding the interdependency” and “the collateral effect.”
Self-interest is another malady infecting both sides of the aisle as they aim to keep their jobs and ensure their party stays in power.
“We’ve lost our sense of stewardship,” he said.
“Stewardship is not just generating results today, not just leaving things better off when you leave them when you came, but better positioned for the future,” Mr. Walker explained. “We’ve lost that sense. We need to regain it if we want our future to be better than our past.”
He identified Rep. Jody Arrington (R-Texas), who chairs the House Budget Committee, as one of the few lawmakers to realize the fiscal issues by committing to the Fiscal Commission Act and supporting a constitutional amendment that would limit government growth and stabilize the debt-to-GDP ratio.
“There are others, but there’s not enough,” Mr. Walker said.
Earlier this year, the House Budget Committee advanced the Fiscal Commission Act of 2024 out of committee with bipartisan support.
The bill would establish a 16-member panel featuring six Republicans, six Democrats, and four outside experts without voting power. The group would explore strategies to balance the budget as soon as possible and assess mechanisms to enhance the long-term solvency of various entitlement programs, especially Social Security and Medicare.
Despite some consternation from several Democrats, the bipartisan push received applause, including from the Committee for a Responsible Federal Budget.
“The federal debt is on an unsustainable course, and lawmakers have been unable or unwilling to correct it,” the organization stated. “A fiscal commission would bring Members of both parties and chambers together to facilitate a conversation over how to solve these problems, without pre-prescribing any particular solution (or a solution at all).”
Hope and Change
Whether the United States can improve its fiscal trajectories remains to be seen.
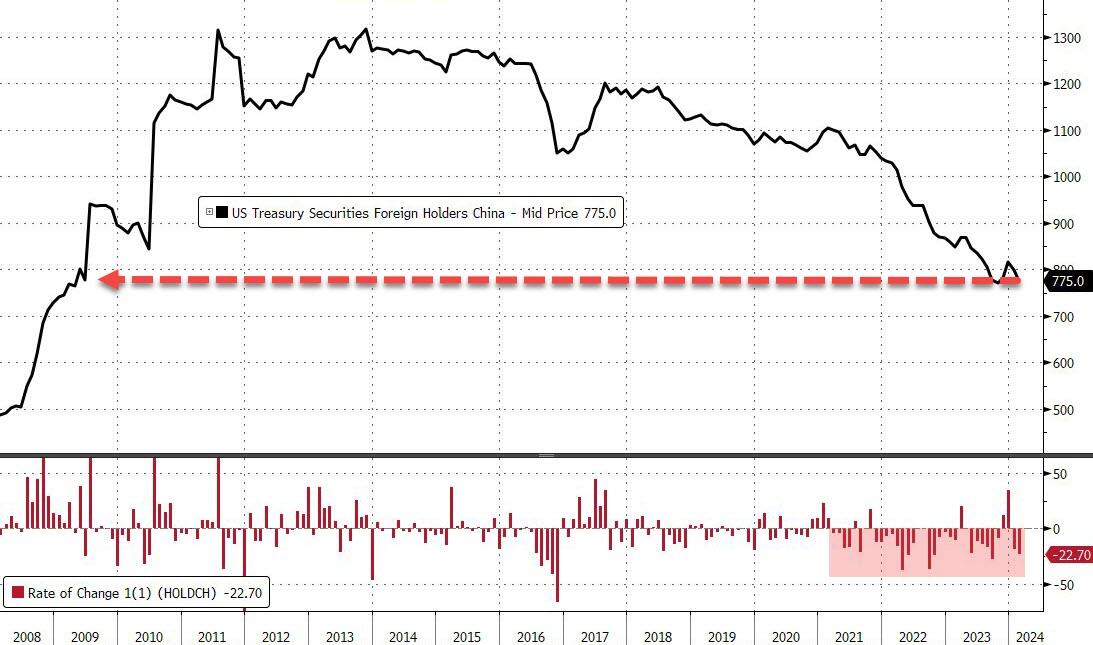
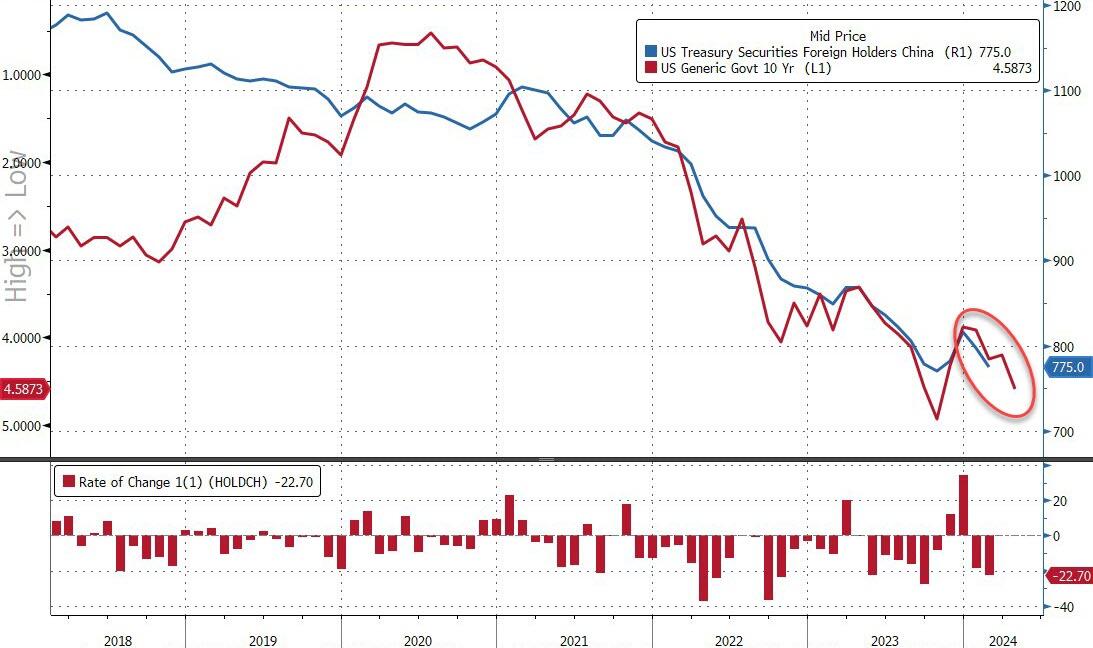
Mr. Walker is hopeful about some of the legislative efforts coming out of the nation’s capital. The country is beginning to face the consequences of years of fiscal mismanagement, making it harder to sell its debt to the rest of the world.
In recent months, many Treasury auctions have led to lackluster demand among domestic and foreign investors. Market watchers have warned that global financial markets might share Fitch and Moody’s concerns about America’s fiscal deterioration.
But when discussing trillions of dollars, percentages, GDP, and servicing costs, how can the average person, worried about paying his mortgage or replacing a broken-down refrigerator, grasp or even be concerned with these trends?
According to Mr. Walker, you tap into their “head and heart.”
“You have to help them understand that we’re already seeing some of the implications of fiscal irresponsibility,” he said, adding that the causes of the Roman Empire’s demise are familiar to what is transpiring in the United States today: fiscal irresponsibility, a decline in moral values, an overextended military, and an inability to control its borders.
However, while it is vital to translate these gigantic numbers into terms the layman can understand, experts also need to “hit their heart.”
“Do they love their country? Do they love their kids, and do they love their grandkids?” he said. “We’re mortgaging their future at record rates.”
Ever worse, politicians have promised $215 TRILLION in unfunded entitlements to the bottom 99%. When this all explodes, who will be left standing to make good on these promises??










You must be logged in to post a comment.