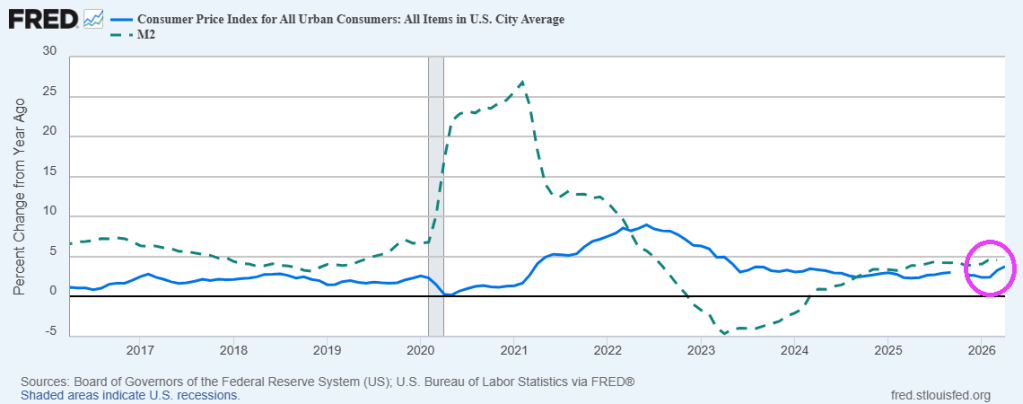
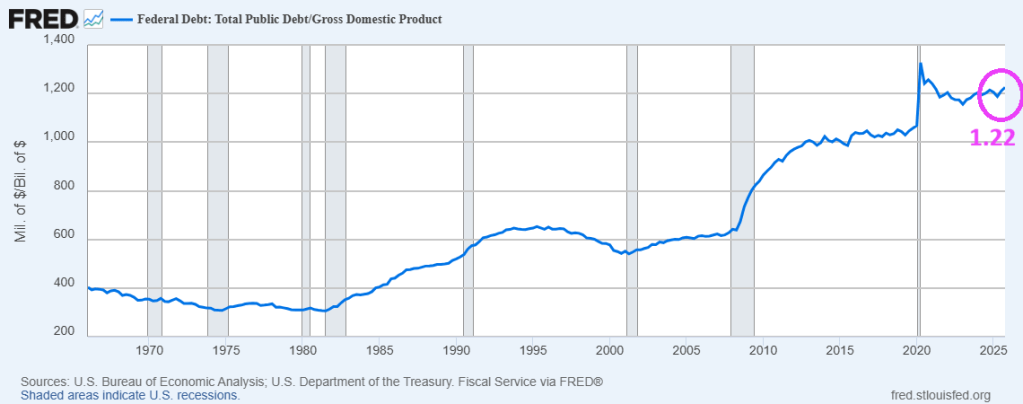
It used to be that a debt-to-GDP (Gross Domestic Product) ratio above 1.0 would be disastrous. Yet, the US Debt-to-GDP ratio rises during and after most recessions. Why? The old Keynesian model called for increased government spending and debt to pull the country out of a recession. But the Keynesian model called for debt to be repaind after the recession ended. But after most recessions, the Federal government keeps spending and borrowing. Following the Covid outbreak of 2020, the US debt-to-GDP ratio exceeded 1.0 and has remained fairly constant since.
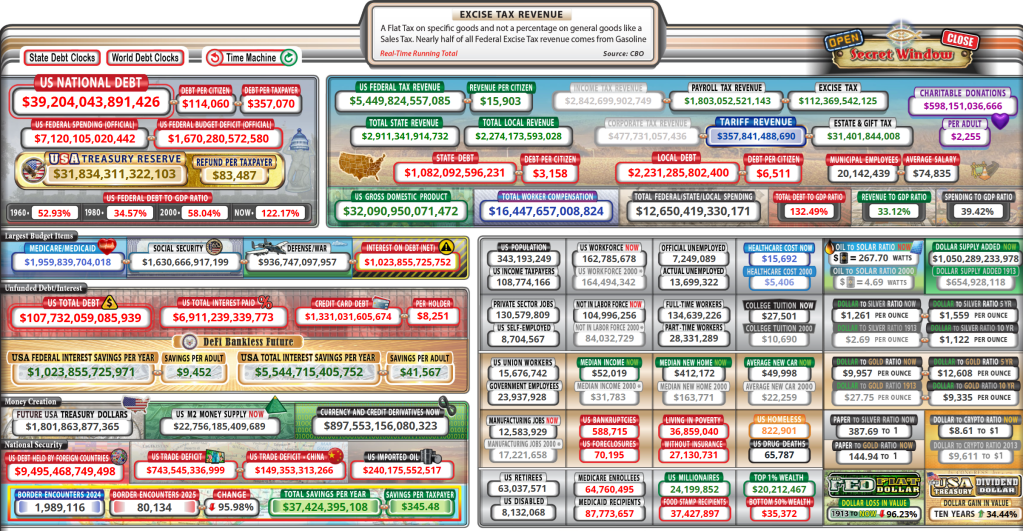
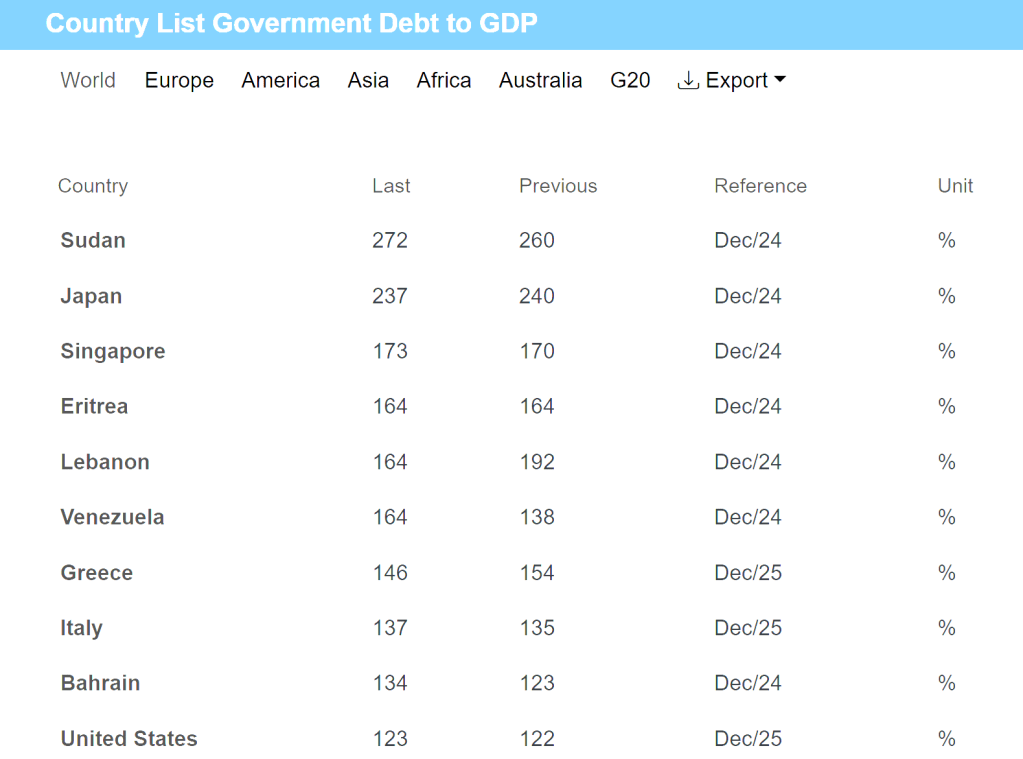
As of today, the US Federal debt load is $39.204 trillion while GDP is $32.090 trillion resulting in a debt-to-GDP ratio of 1.22.
The leader in the debt-to-GDP race is … Sudan! Followed by Japan and Singapore.
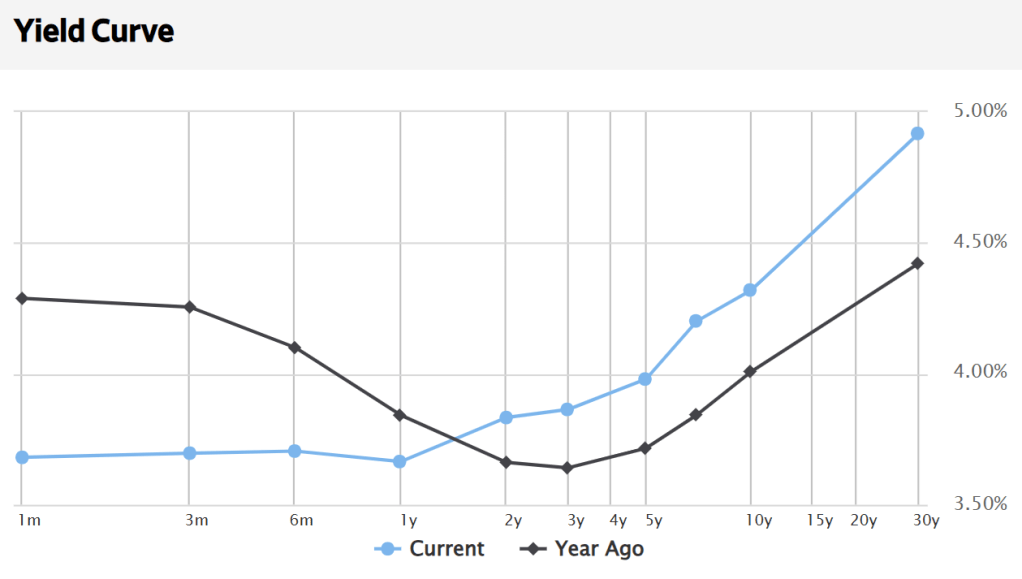
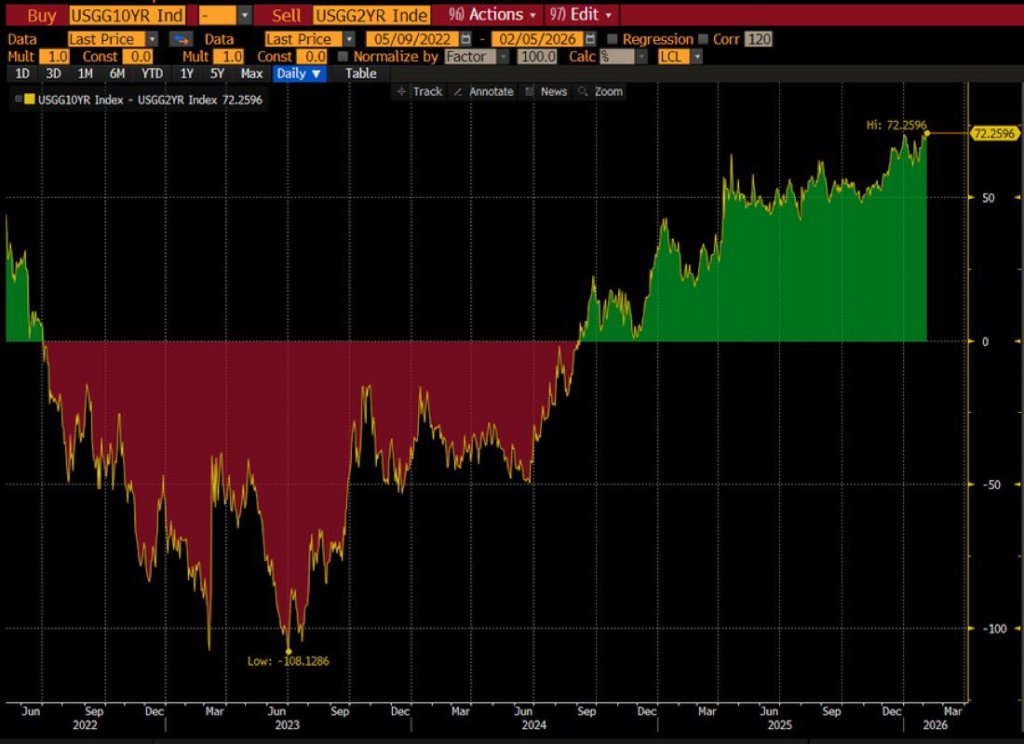
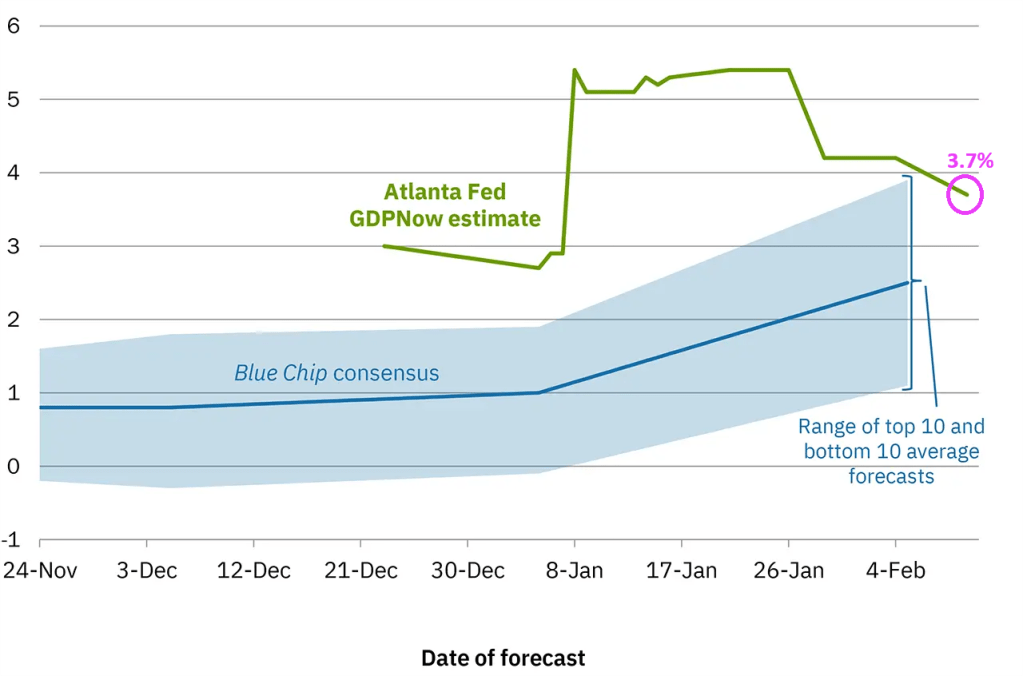
Trump’s threats of bombing Iran back to the stone age continues. But the impact on Treasury yields is interesting. As the US economy continues to grow, the US Treasury curve takes on the familiar upward slope. With rising long rates. Particularly when compared to the negative humped yield curve of a year ago.
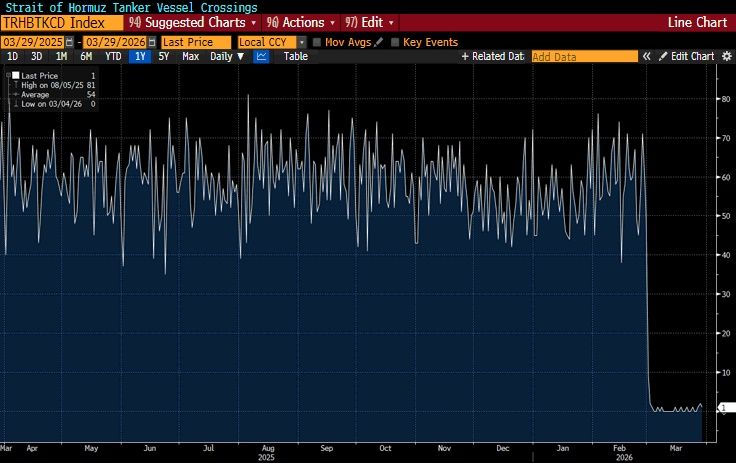
The Strait of Hormuz, a choke point for Middle East crude oil delivery to the rest of the world, has witnessed vessel crossings grinding to a near halt.
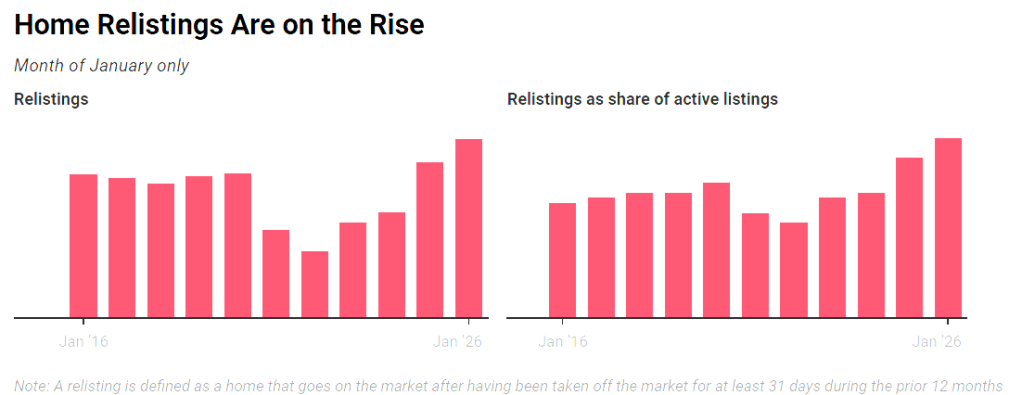
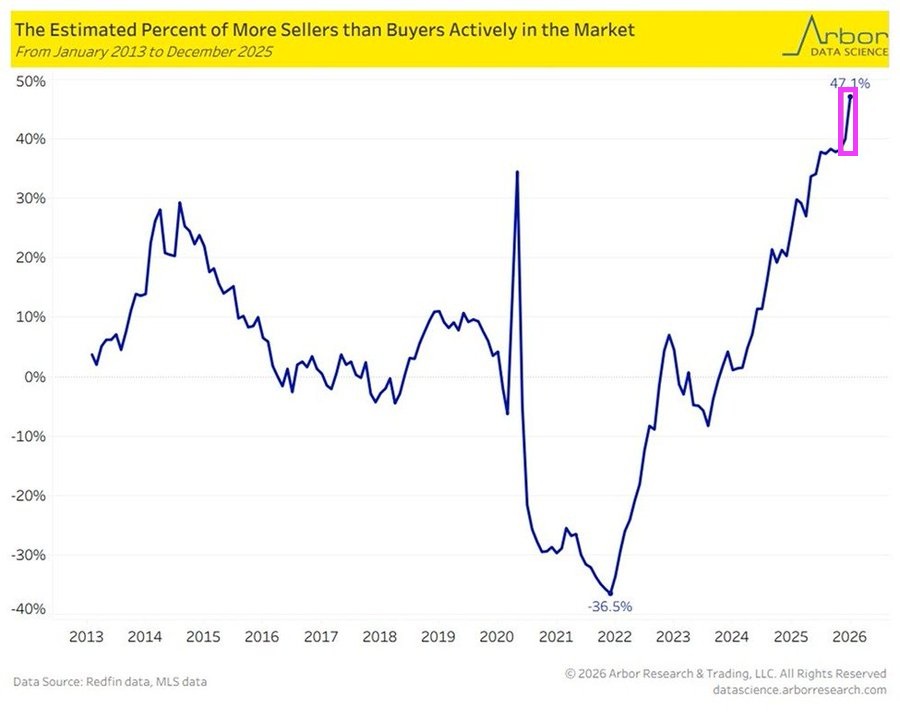
Delistings soared in 2025 after sellers began to outnumber buyers, and decided to take their homes off the market to take another bite at the apple this spring. Overall delistings hit a record high of 112,788 in December, while relistings this year represented 3.6% of all homes on the market.
Supply gains have been concentrated in the South and West, particularly among homes priced under $500,000. While the Northeast and Midwest have seen some growth, they are still lagging behind the other regions.
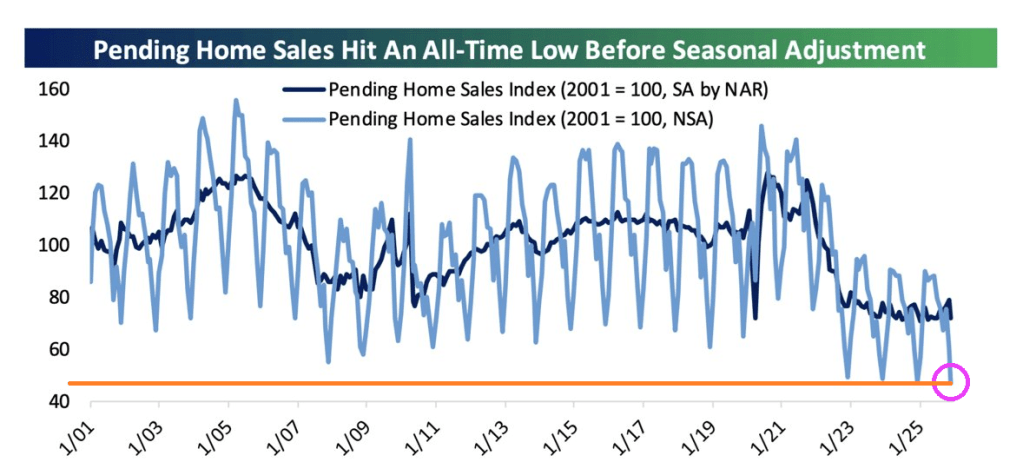
As of February, active listings climbed by 7.9 percent year over year, reaching 914,860 homes across the nation for sale. A little more than 7 percent of those listings resulted in contract cancellations—down slightly from the same time in 2025.
An analysis of the country’s 50 largest markets showed sharp increases in inventory in Seattle, with a 38.5 percent hike, as well as Louisville, Kentucky, 27.3 percent higher, and San Jose, with nearly 25 percent more homes on the market.
On the other side, Hartford, Connecticut, experienced the deepest drop in inventory at over 82 percent, as well as Providence, Rhode Island, at 61.1 percent.
Overall, homes spent a median of 70 days on the market in February, four days longer than a year earlier.
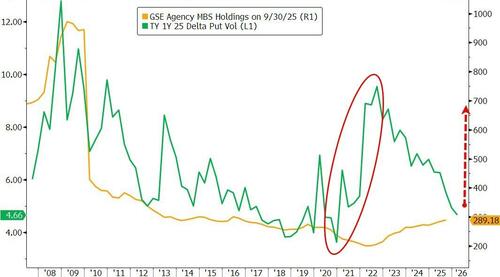
President Trump ordered Fannie Mae and Freddie Mac to operate like The Federal Reserve. Buying assets to manipulate interest rates. In this case, F&F have been ordered to buy $200 billion of agency MBS.
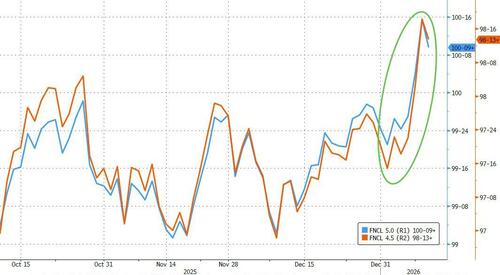
Thursday’s Truth Social post triggered an immediate snap tighter in mortgages, led by the belly and lower coupons. By pulling MBS spreads tighter and crowding out real-money buyers, Fannie and Freddie’s purchases would push incremental demand into Treasuries as the next-best duration substitute, putting a modest bid under the belly of the curve.
However, execution and the ultimate size of purchases is still unclear, as my colleague Alyce Andres noted. If the government-sponsored enterprises GSEs stagger purchases, and signal an ultimate increase above the announces $200 billion, further tightening should occur. They can fund a lot of the buys from existing liquidity portfolios, though there’s a path where they could issue short-term debt to preserve operating buffers and could nudge repo wider at the margin.
The bigger transmission channel is hedging, as highlighted by colleagues Ira Jersey and Will Hoffman. Unlike the Fed, the GSEs actively hedge MBS holdings, shedding duration by paying fixed rates in swaps and using swaptions to manage the negative convexity and vega risks embedded in mortgages. That matters for swap spreads and for volatility, especially in the belly.
That’s why GSE MBS purchases don’t have to be huge to change the feel in rate markets. The post-Global Financial Crisis regime dulled the classic convexity feedback loop because the Fed held such a large amount of agency MBS and didn’t hedge it, while the GSEs shrank their portfolios. Trump’s directive risks bringing more of that regime back.
A recent note out of Goldman Sachs frames it cleanly: A $200 billion build could lift the active convexity-hedger footprint by about 25%. The street then starts front-running the mechanical flows — paying in selloffs, receiving in rallies — which makes breakouts more likely even if day-to-day ranges look calm, Goldman added.
Positioning makes the setup more precarious. JPMorgan already saw mortgage valuations as a “bit snug” before the announcement, while BofA flagged that rates market had recently added fresh belly shorts sitting against a backdrop of benchmark funds still overweight MBS versus IG.
That mix can keep the initial tightening sticky, but it also raises the odds of sharp reversals if the market decides the purchasing flows are slower, smaller, or more heavily hedged than hoped.
Fannie and Freddie’s retained portfolio are soaring along with the duration gap.
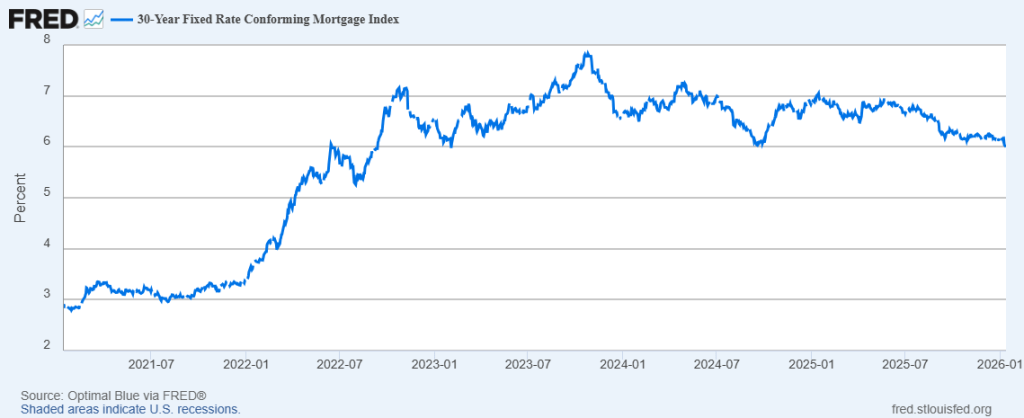
The effect on mortgage rates has so far has been negligible. The 30-year conforming mortgage just fell below 6% at 5.99%.


You must be logged in to post a comment.