
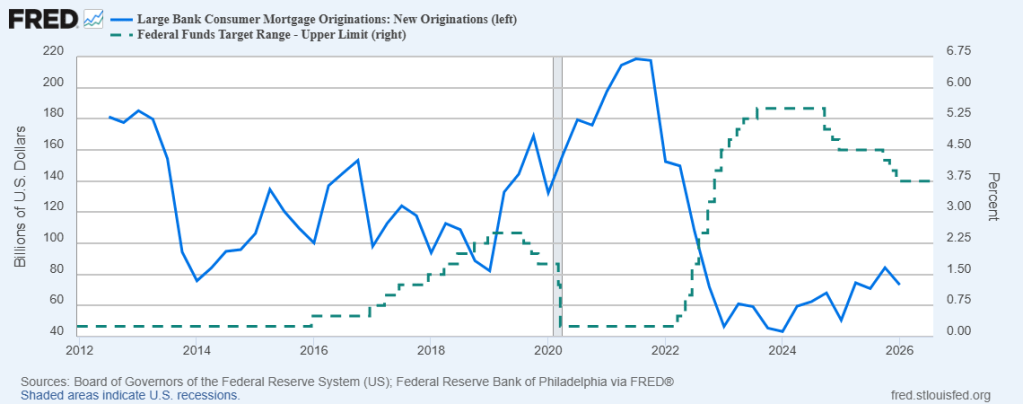
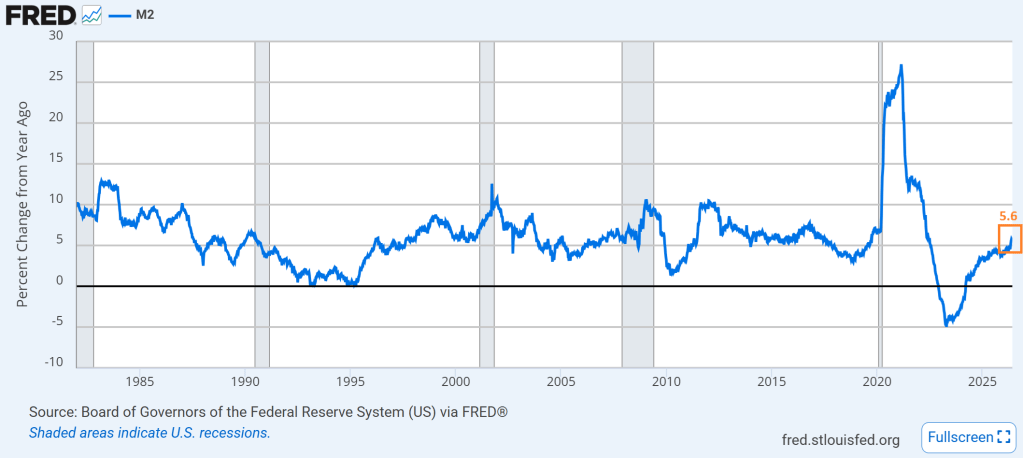
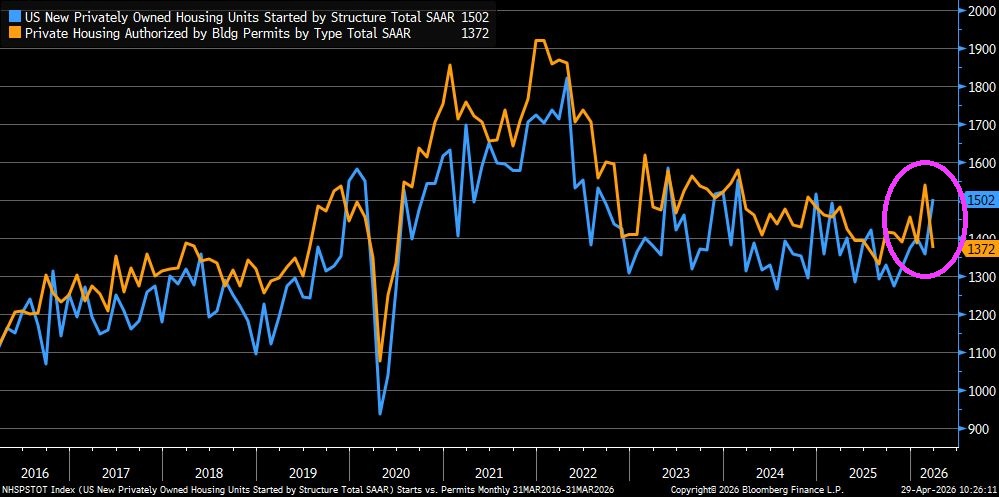
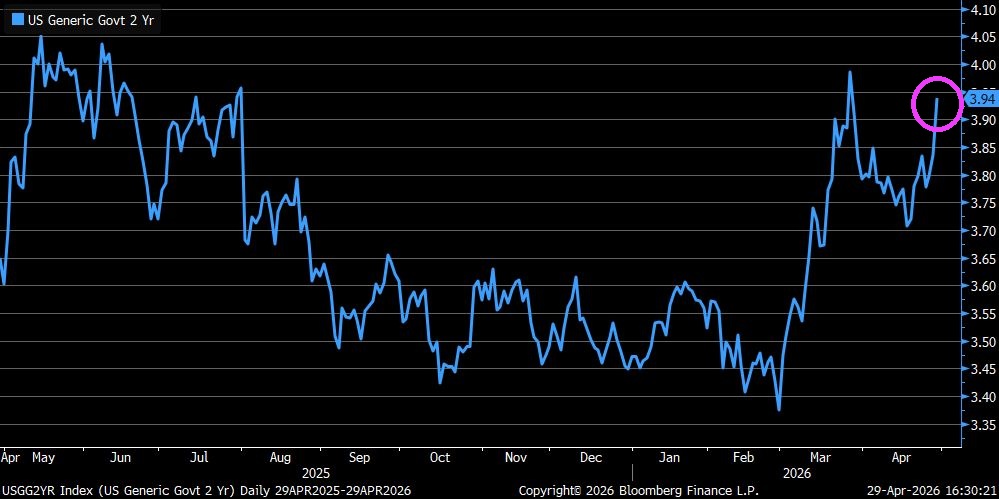
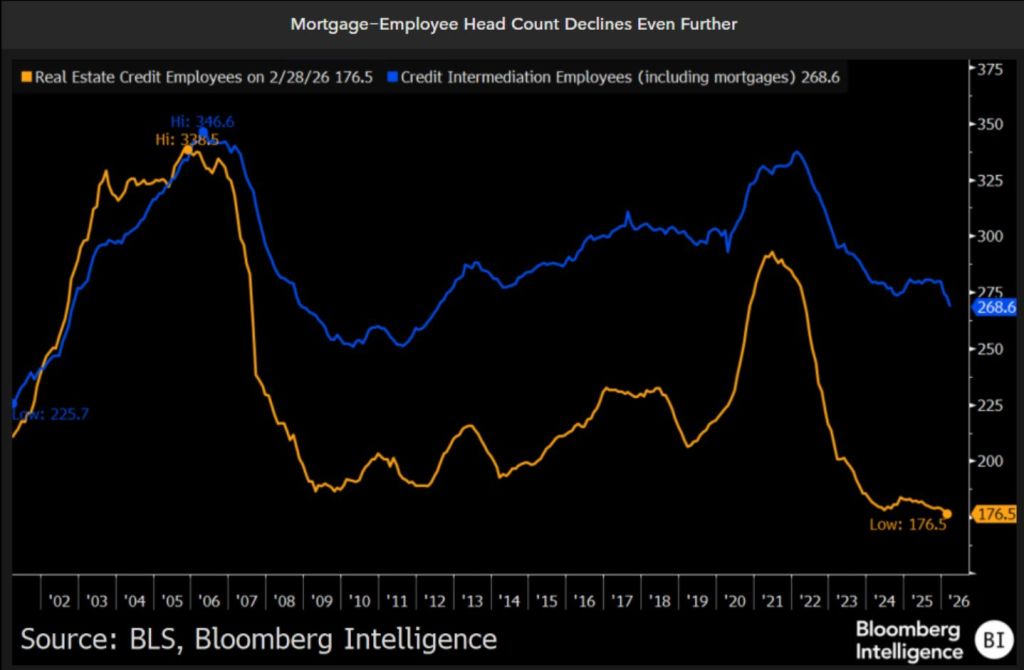
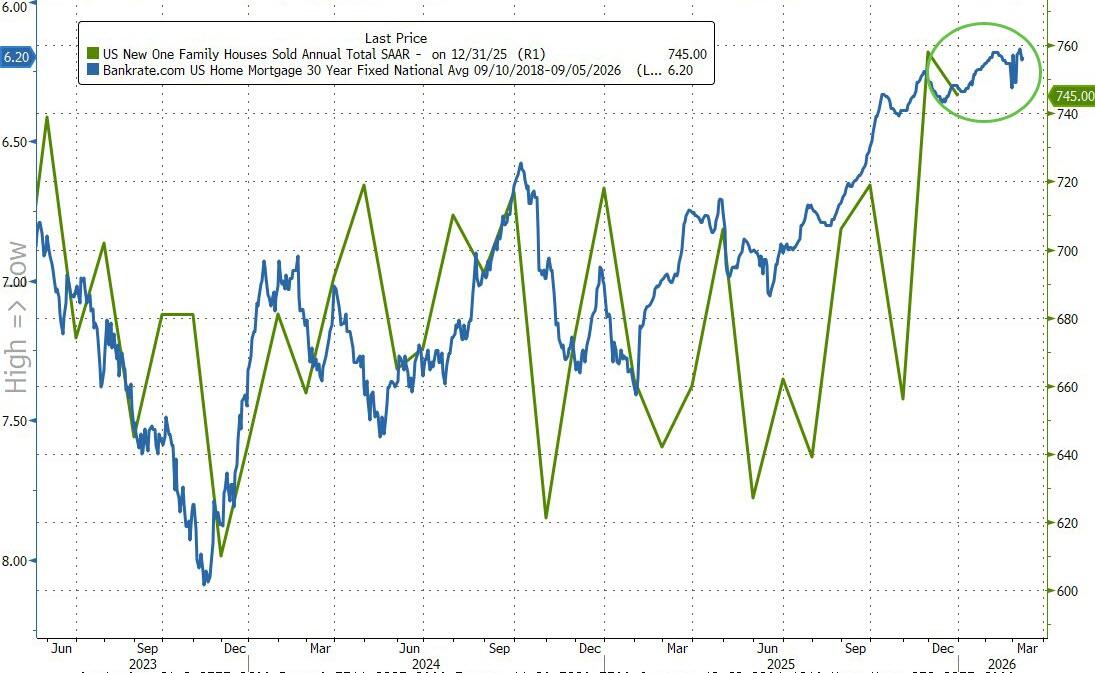
Large bank mortgage originations have crashed and burned since 2022. The Fed has raised rates following the Covid outbreak and have not cut rates in a significant manner.
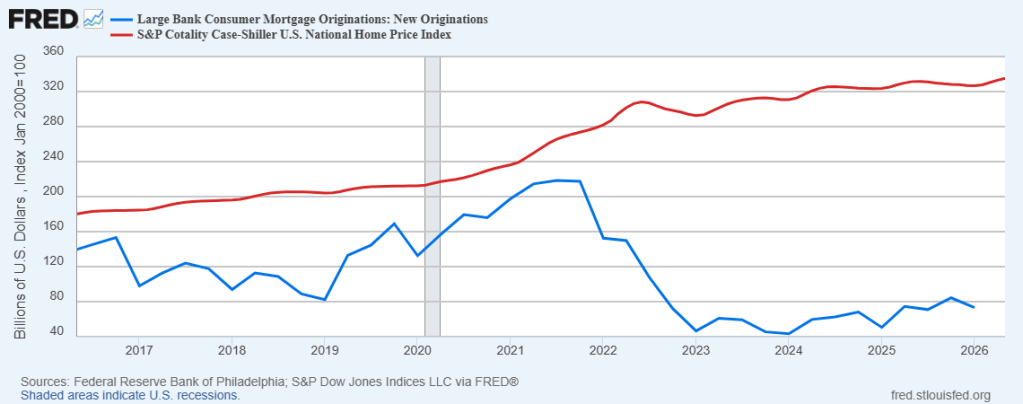
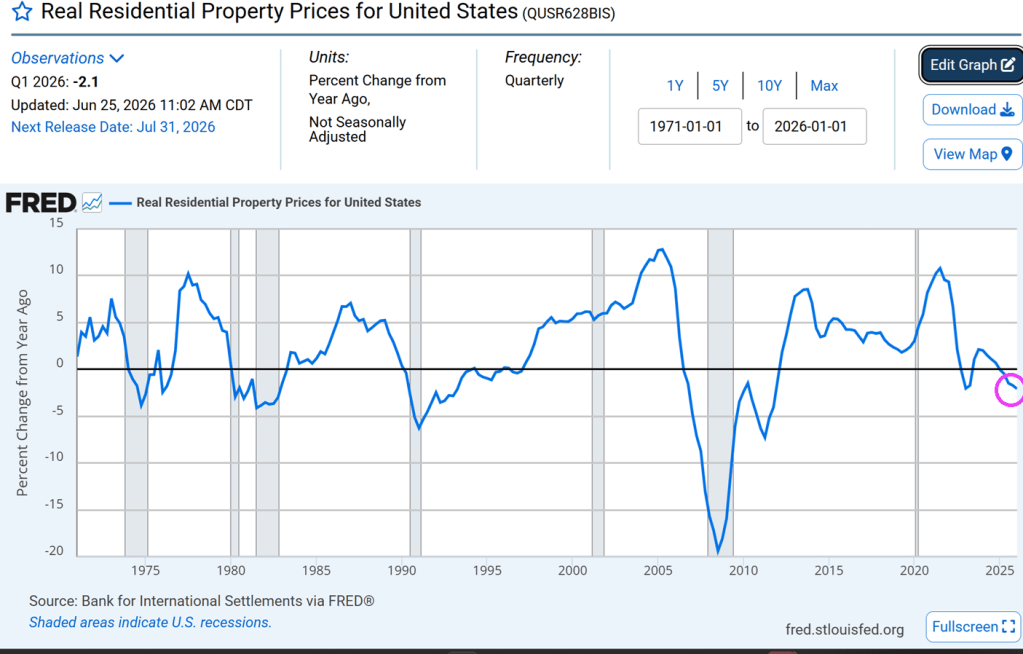
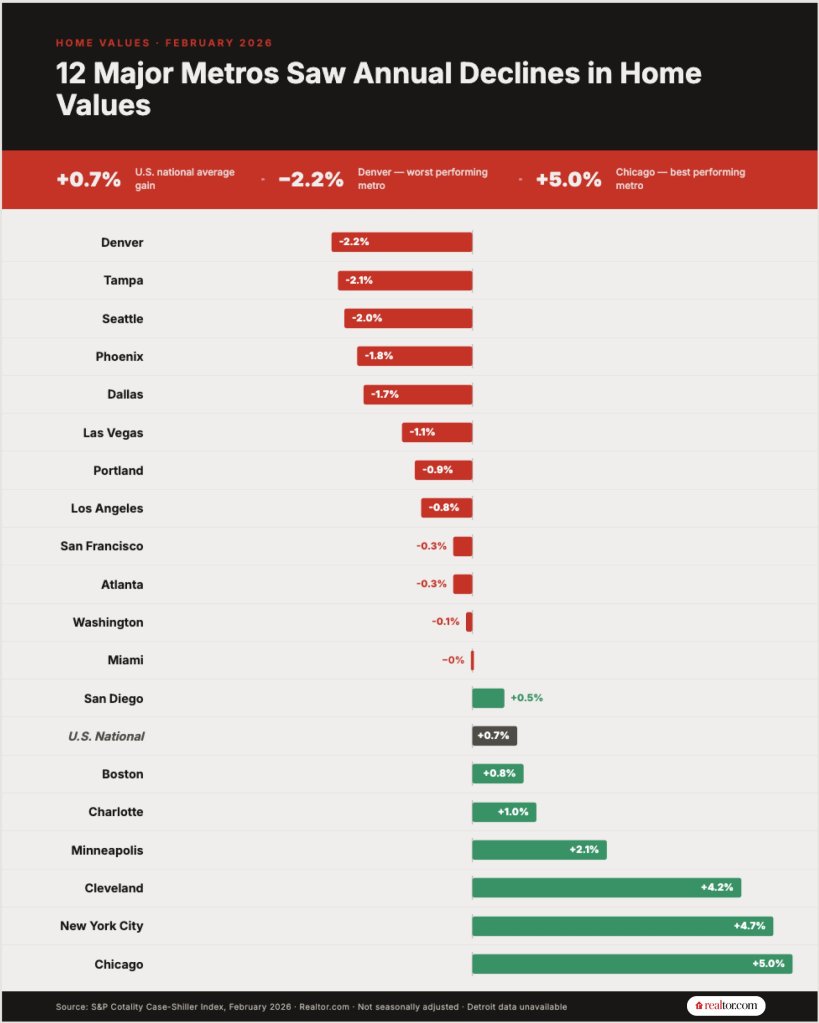
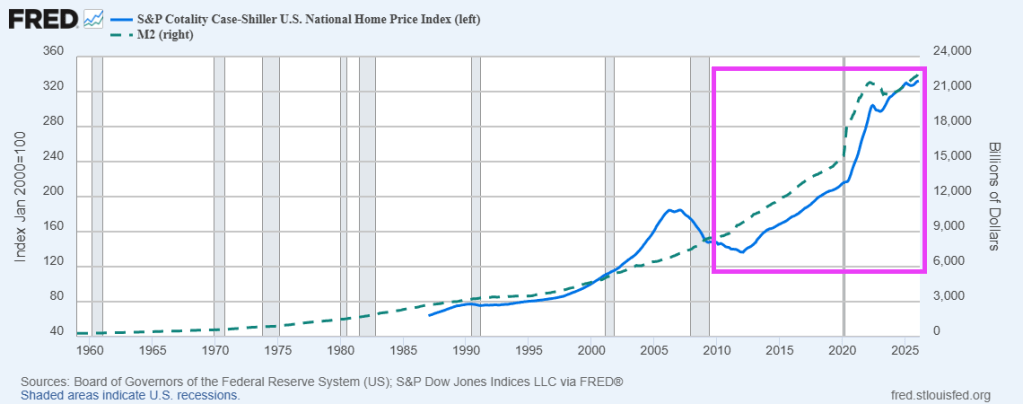
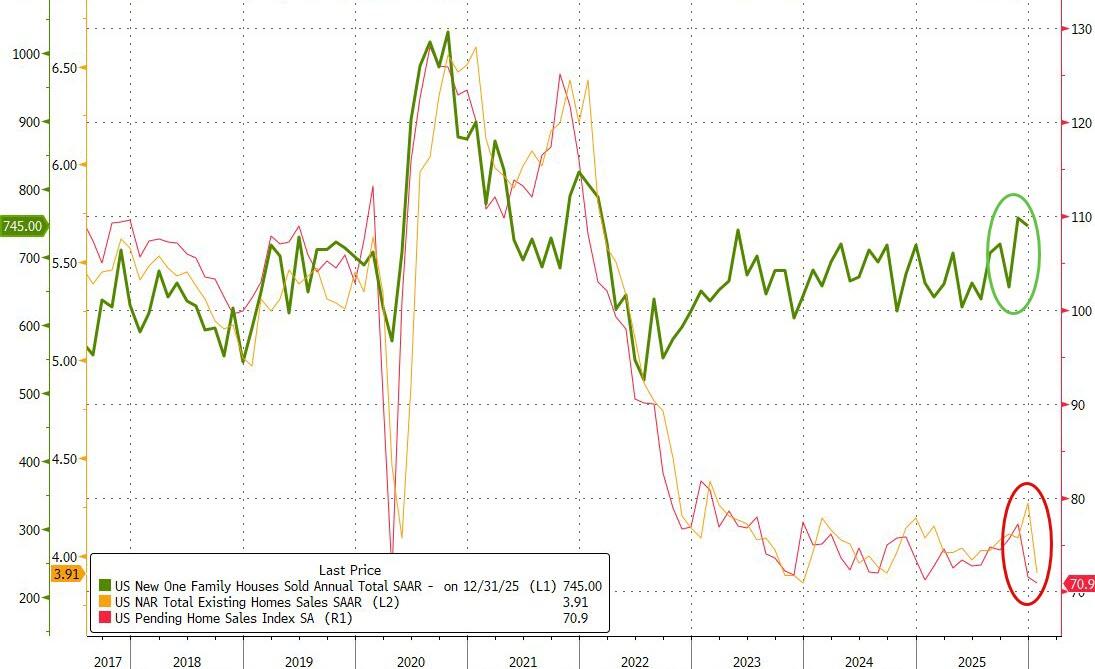
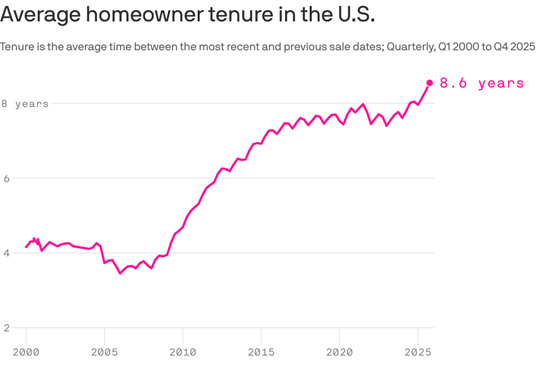
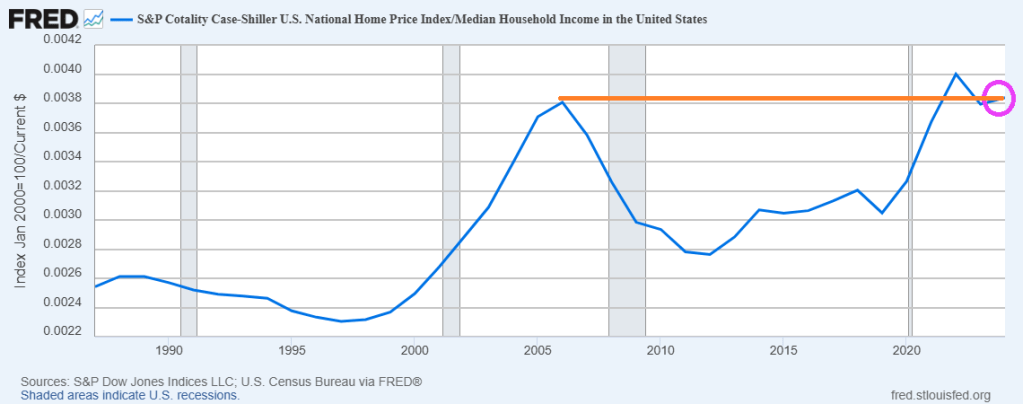
Another problem facing the US economy is that housing prices have over doubled since 2015.
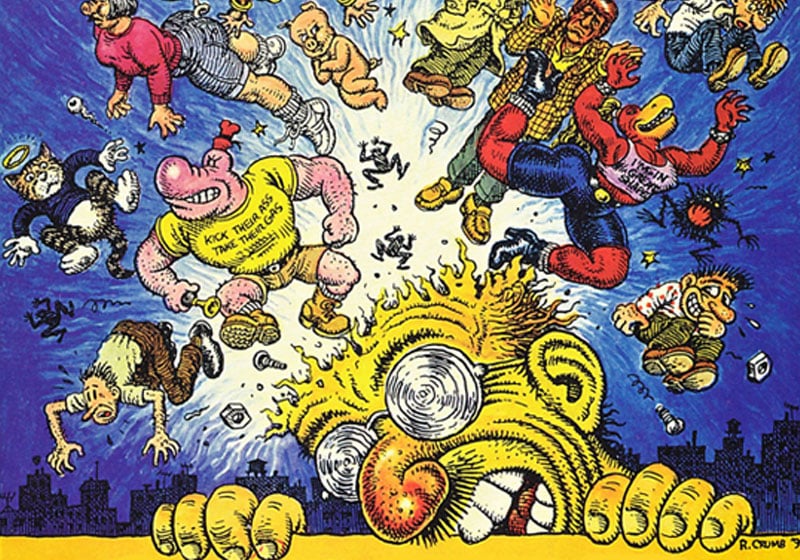
My reaction to the Fauci testimony in Congress.

I am surprised that no one in Congress asked Dr, Fauci about how Covid crisis impacted the housing market.


You must be logged in to post a comment.