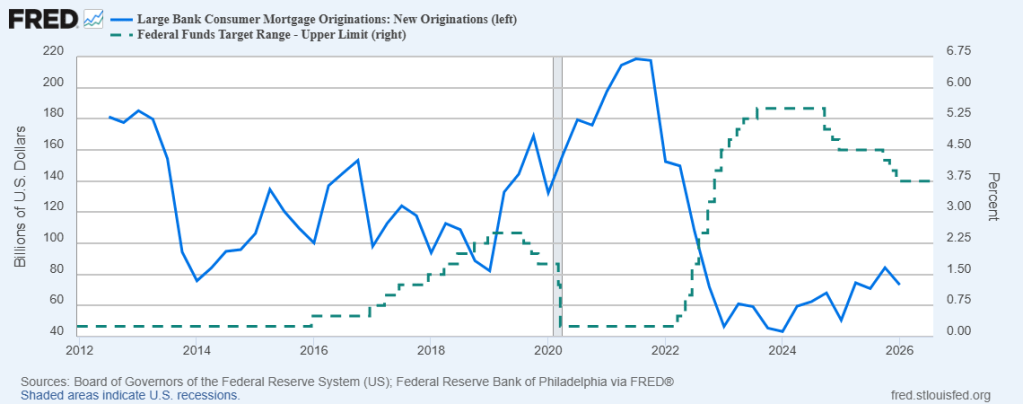
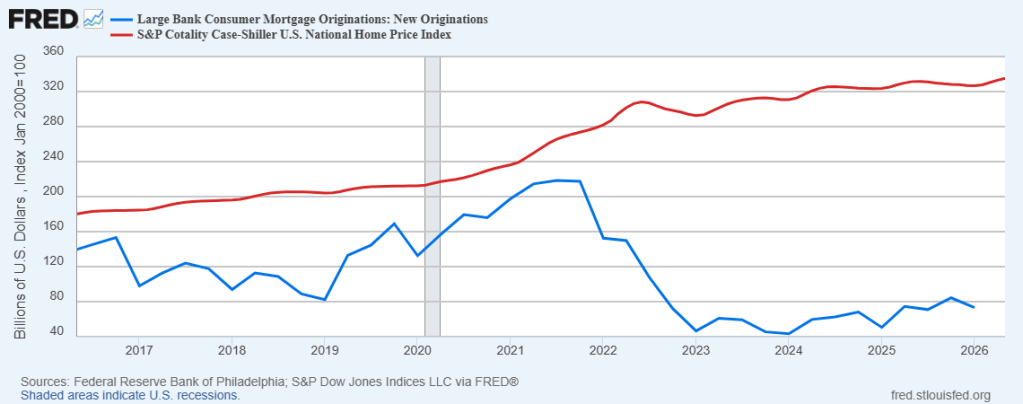
Large bank mortgage originations have crashed and burned since 2022. The Fed has raised rates following the Covid outbreak and have not cut rates in a significant manner.
Another problem facing the US economy is that housing prices have over doubled since 2015.
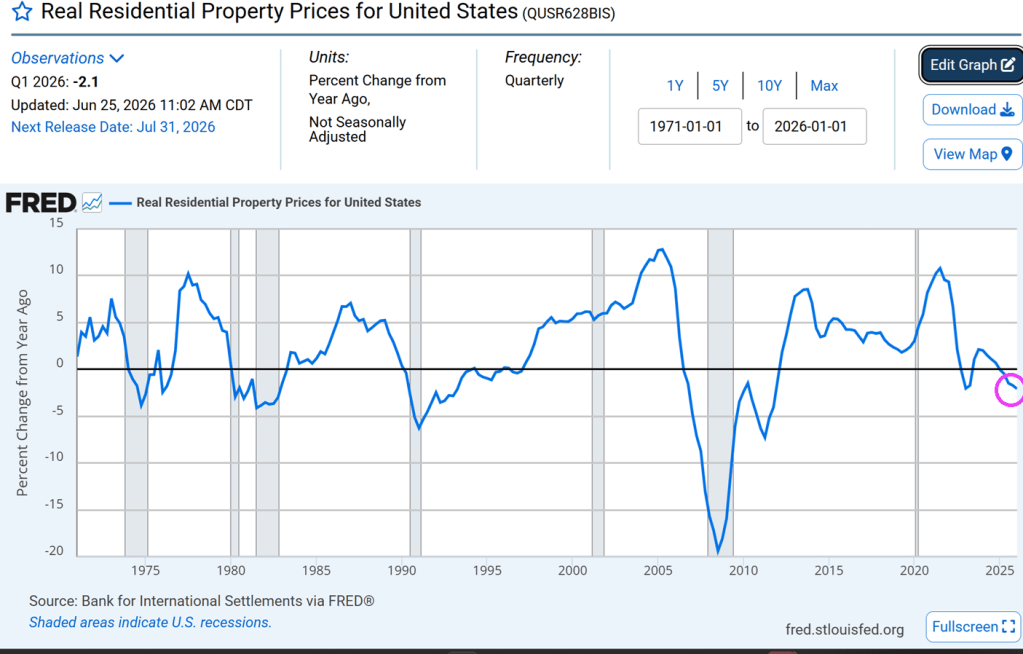
US home prices are clearly unaffordable for younger households, given the dearth of true starter homes. As of Q1 2026, REAL US residential property prices fell -2.1% YoY.
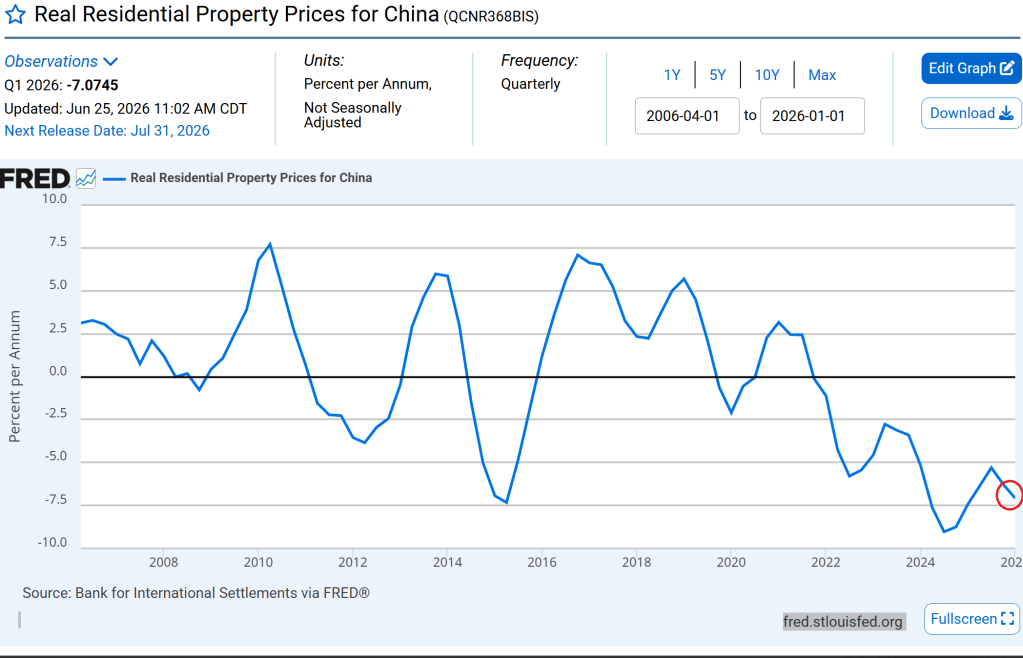
China’s real residential property prices are declining even faster than the US.
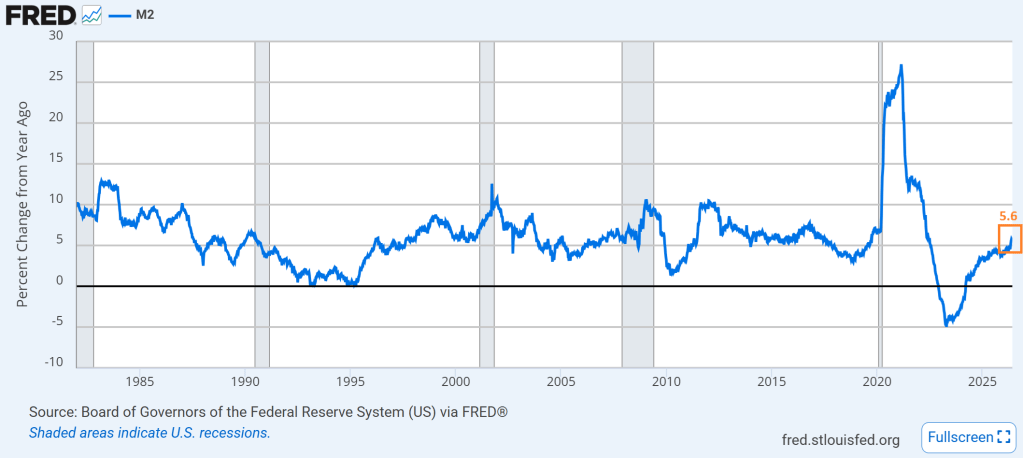
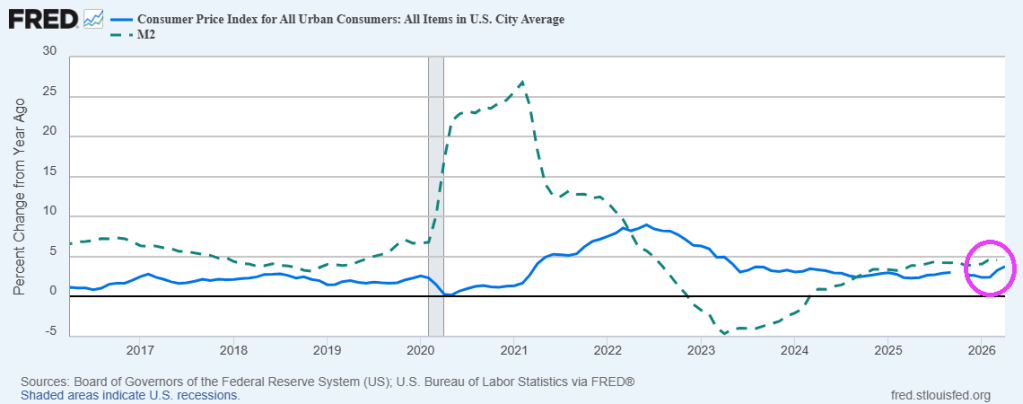
The US Federal Reserve is printing money M2 at a 5.6% YoY pace. Slower than during the Covid outbreak, and slower than the decade prior to Covid.
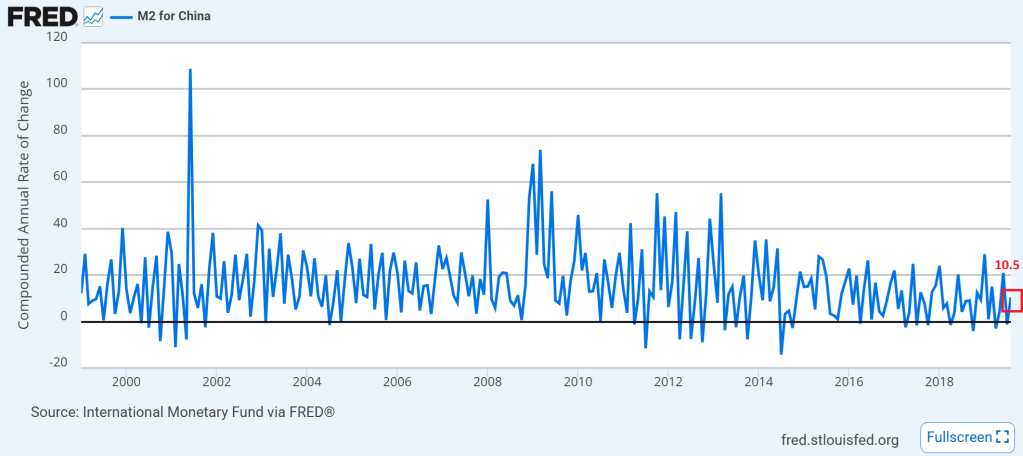
China is printing money at a gutwrenching pace (10.5% YoY as of August 2019). Note that China has historically printed money faster than The Federal Reserve.
Global Central Banks are the Neegans of the global economy.
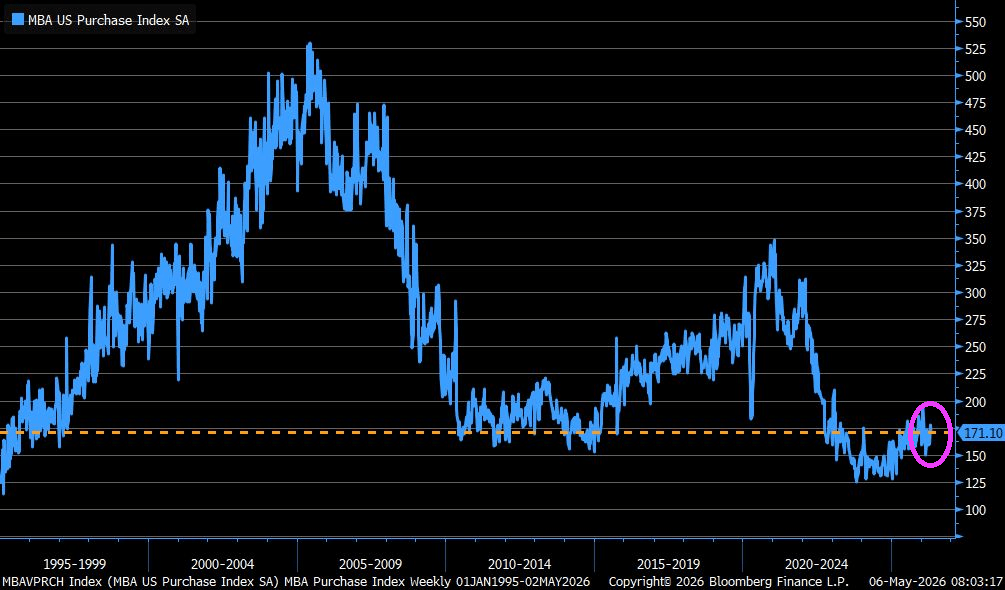
MBA Mortgage Purchase Index down -3.7% over the past week after climbing +1.2% in prior week…30y mortgage rate rose to +6.45% up from +6.37% and highest in a month.
With the Federal government playing an outsized role in the housing and mortgage markets, the Federal goverment is like an enormous Mantis Shrimp.
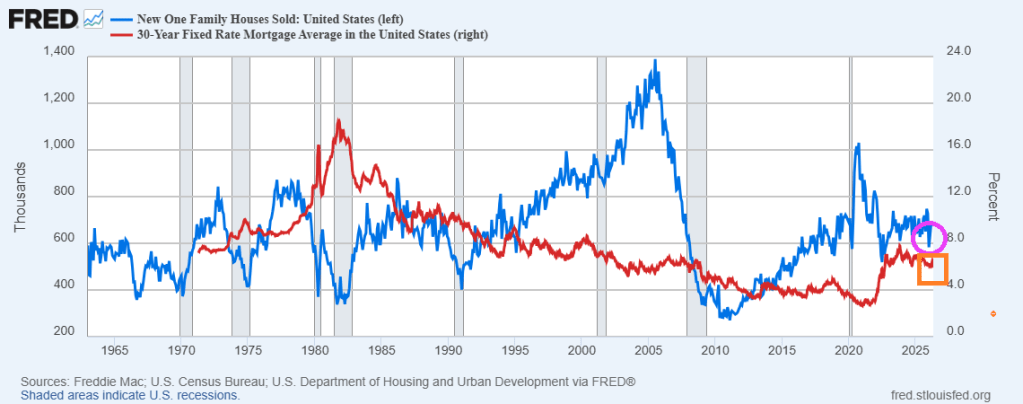
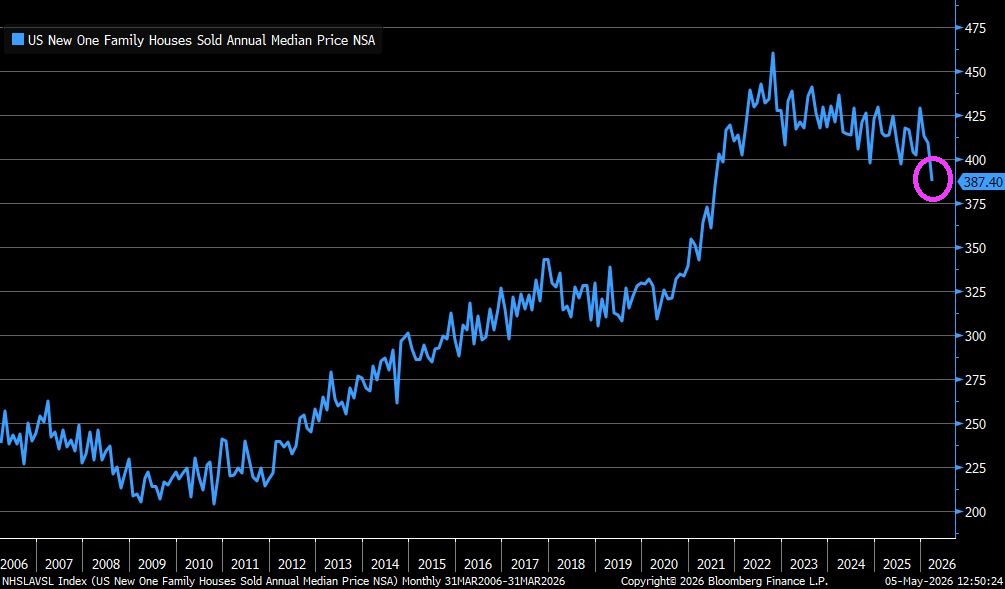
High home prices show signs of cooling, mortgage rates remain fairly constant, while new home sales increase by 47k in March. Despite rising mortgage rates.
The bigger picture? New home sales remain relatively depressed after the Covid outbreak in 2020.
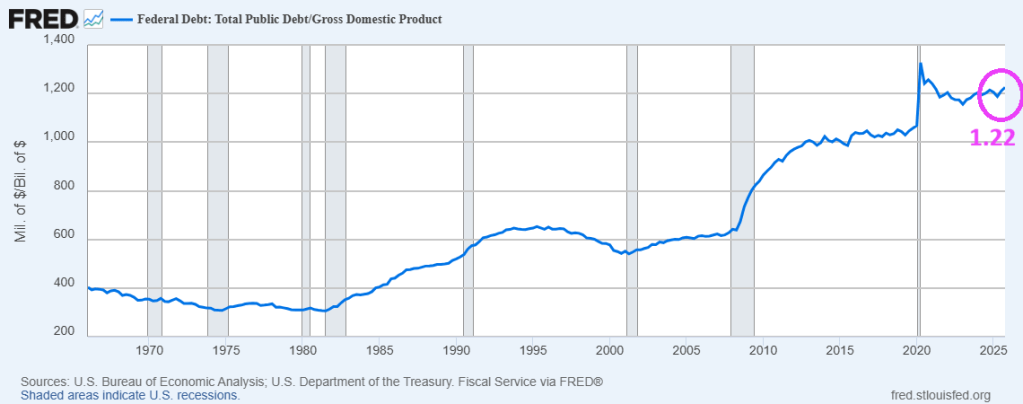
It used to be that a debt-to-GDP (Gross Domestic Product) ratio above 1.0 would be disastrous. Yet, the US Debt-to-GDP ratio rises during and after most recessions. Why? The old Keynesian model called for increased government spending and debt to pull the country out of a recession. But the Keynesian model called for debt to be repaind after the recession ended. But after most recessions, the Federal government keeps spending and borrowing. Following the Covid outbreak of 2020, the US debt-to-GDP ratio exceeded 1.0 and has remained fairly constant since.
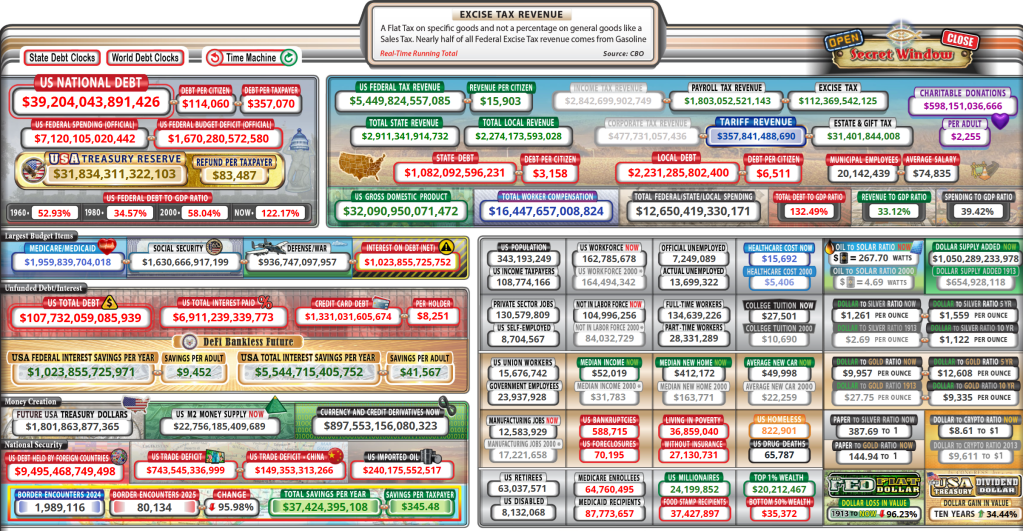
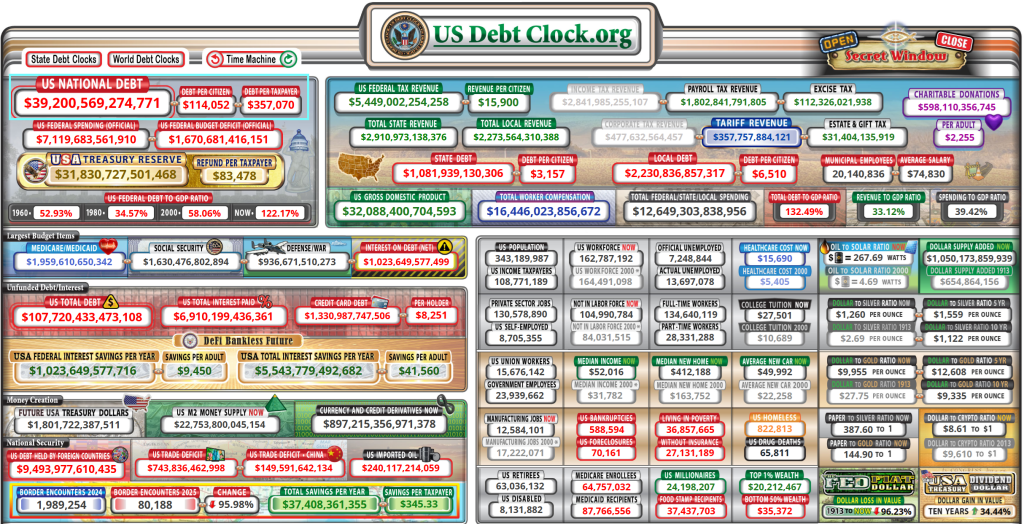
As of today, the US Federal debt load is $39.204 trillion while GDP is $32.090 trillion resulting in a debt-to-GDP ratio of 1.22.
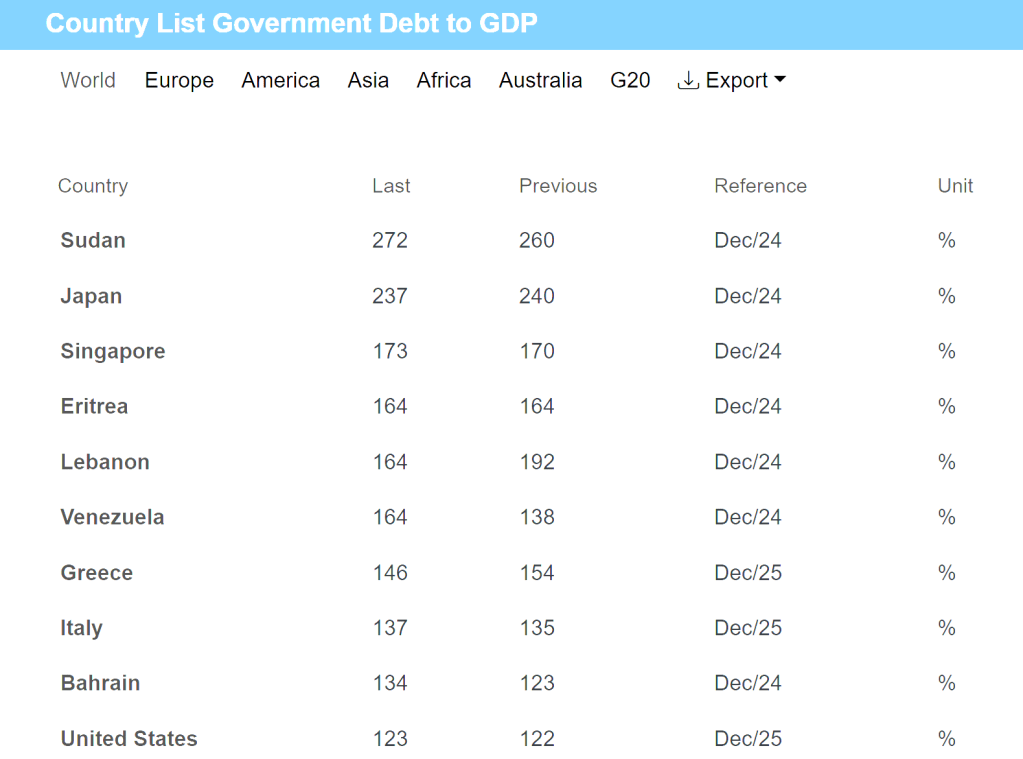
The leader in the debt-to-GDP race is … Sudan! Followed by Japan and Singapore.













You must be logged in to post a comment.