Q3 US Real GDP Growth At 5% (So Much For The Iran “War” Slump)

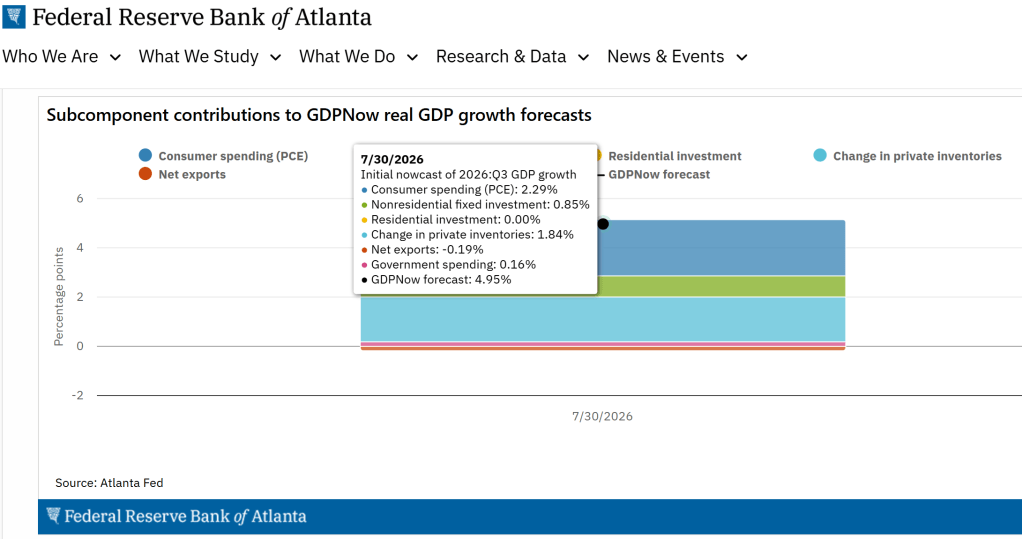
According to the Atlanta Fed’s GDP Now REAL time model, Q3 Real GDP is 5%.

The subcomponents of GDP growth are as follows:

So much for the doom and gloom of Trump’s tariff “war” or Trump’s Iran “war.” 5% Real GDP growth is outstanding!

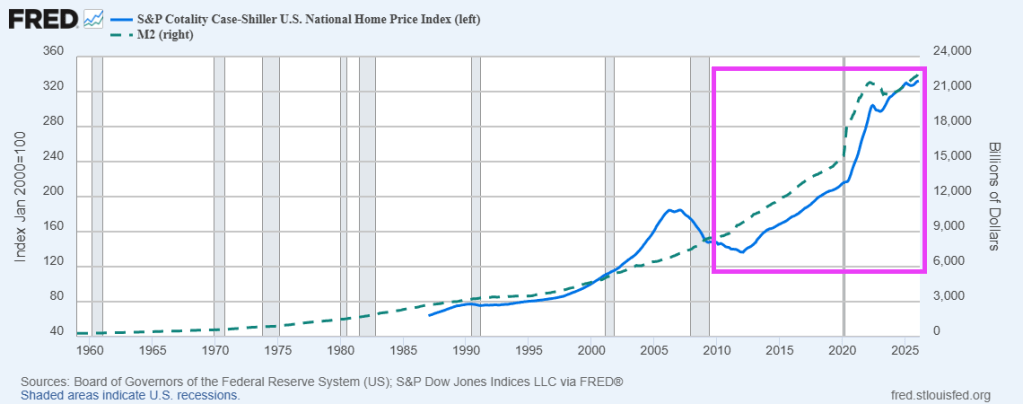
And The Fed keeps on printing money (M2)! Keep on printin’!

The Q3 Real GDP report is so good, I feel like yodeling!

US Mortgage Origination Remain Subdued At Fed Keeps Target Rate At 3.75% (US Home Prices Have Over Doubled Since 2015 Making Housing Unaffordable For Millions)

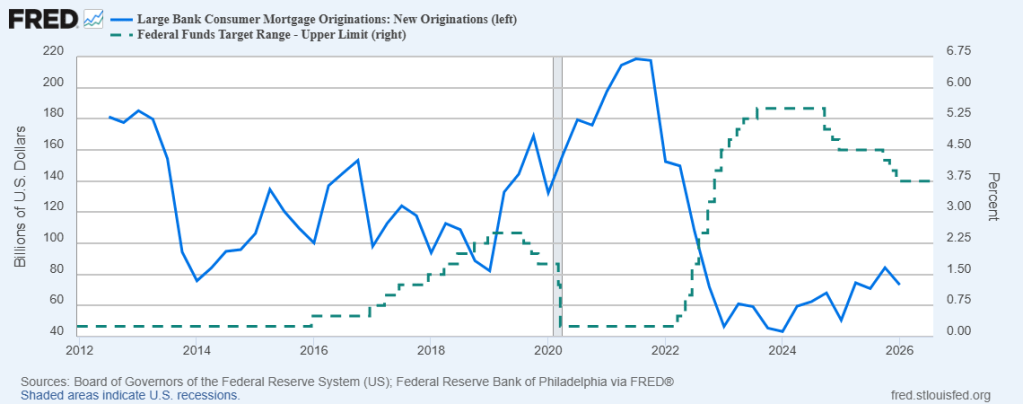
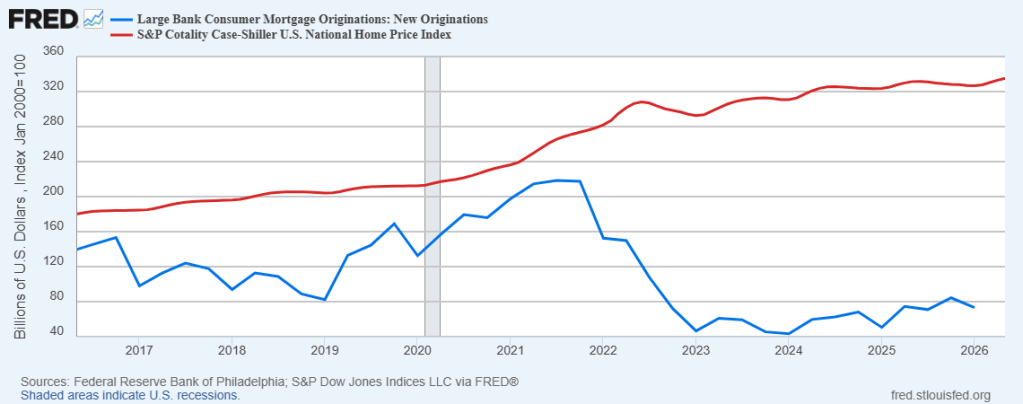
Large bank mortgage originations have crashed and burned since 2022. The Fed has raised rates following the Covid outbreak and have not cut rates in a significant manner.

Another problem facing the US economy is that housing prices have over doubled since 2015.

My reaction to the Fauci testimony in Congress.

I am surprised that no one in Congress asked Dr, Fauci about how Covid crisis impacted the housing market.

Real Home Price Growth Is Negative (Worse In China), Fed Money Printing (M2) Increasing, China’s Money Printing Increasing Even Faster Than US

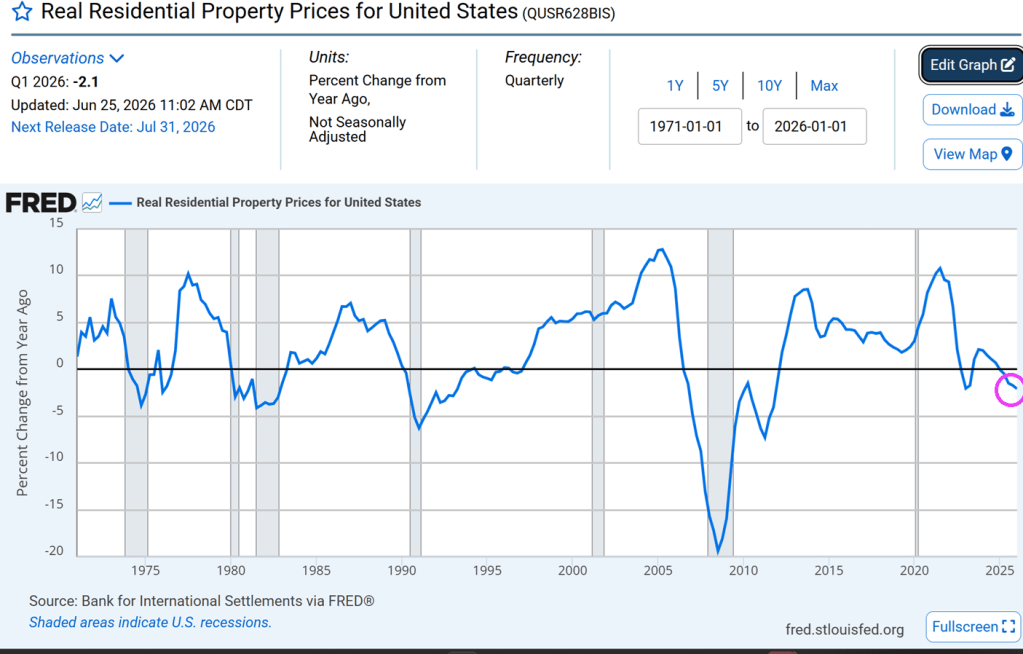
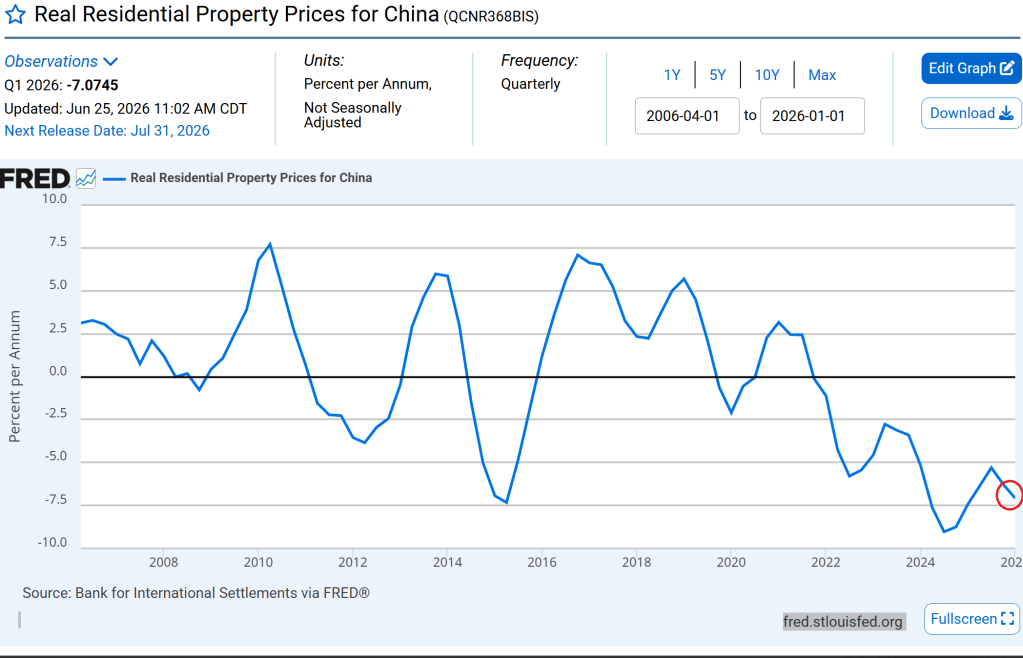
US home prices are clearly unaffordable for younger households, given the dearth of true starter homes. As of Q1 2026, REAL US residential property prices fell -2.1% YoY.

China’s real residential property prices are declining even faster than the US.

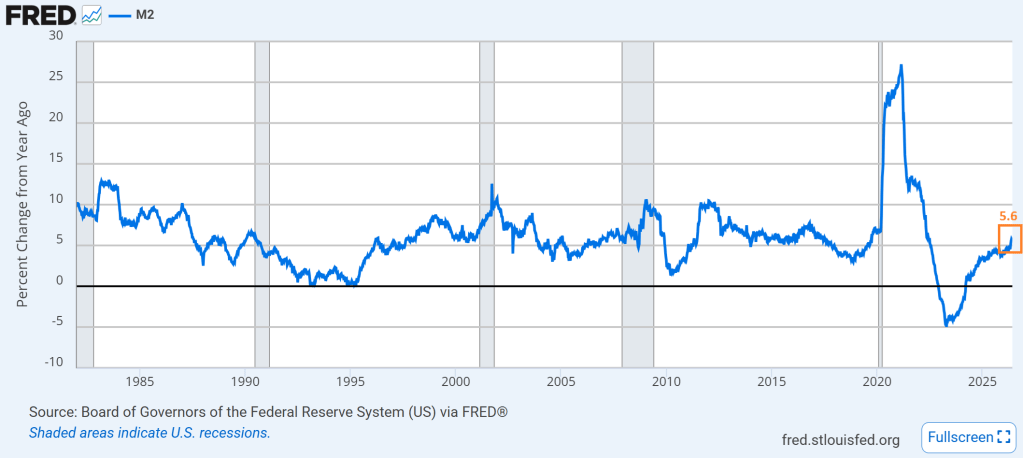
The US Federal Reserve is printing money M2 at a 5.6% YoY pace. Slower than during the Covid outbreak, and slower than the decade prior to Covid.

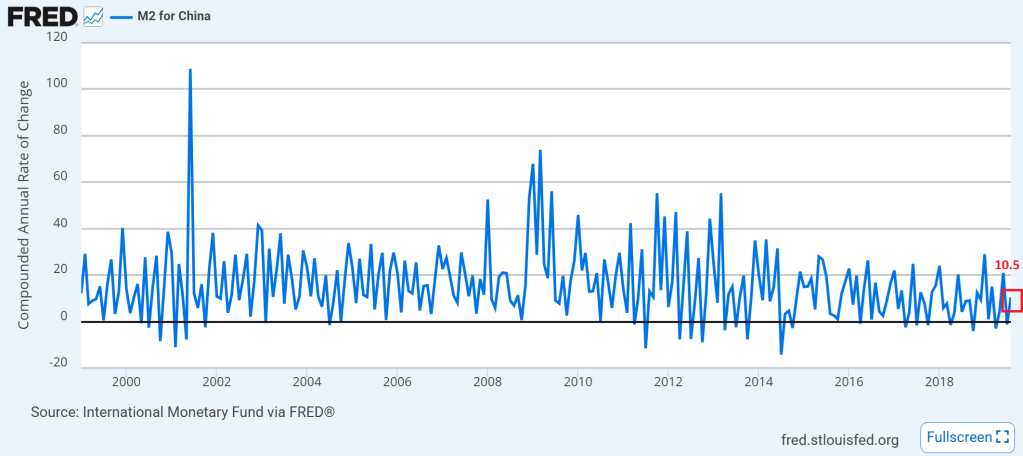
China is printing money at a gutwrenching pace (10.5% YoY as of August 2019). Note that China has historically printed money faster than The Federal Reserve.

Global Central Banks are the Neegans of the global economy.

New Home Sales Rise In March Despite Rising Mortgage Rates

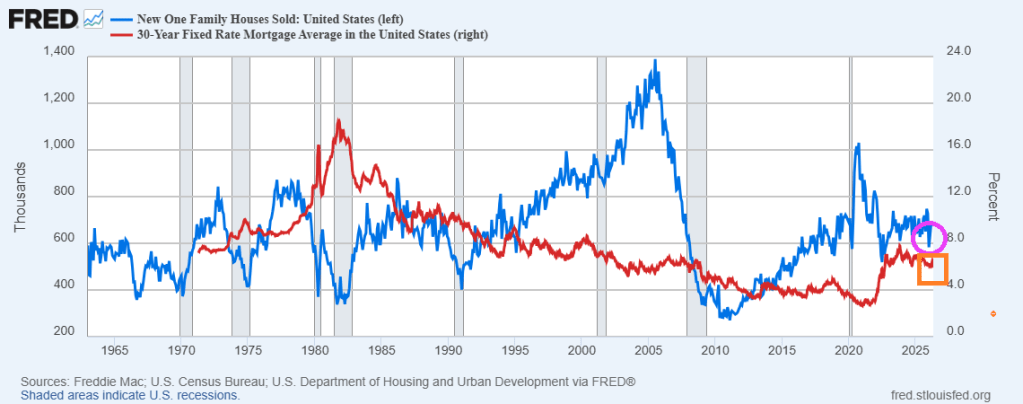
High home prices show signs of cooling, mortgage rates remain fairly constant, while new home sales increase by 47k in March. Despite rising mortgage rates.

The bigger picture? New home sales remain relatively depressed after the Covid outbreak in 2020.

March Existing Home Sales MEDIAN PRICE Falls -6.2%YoY, Worst March Since 2009 (Rent Growth Slowing To 1.8% YoY)

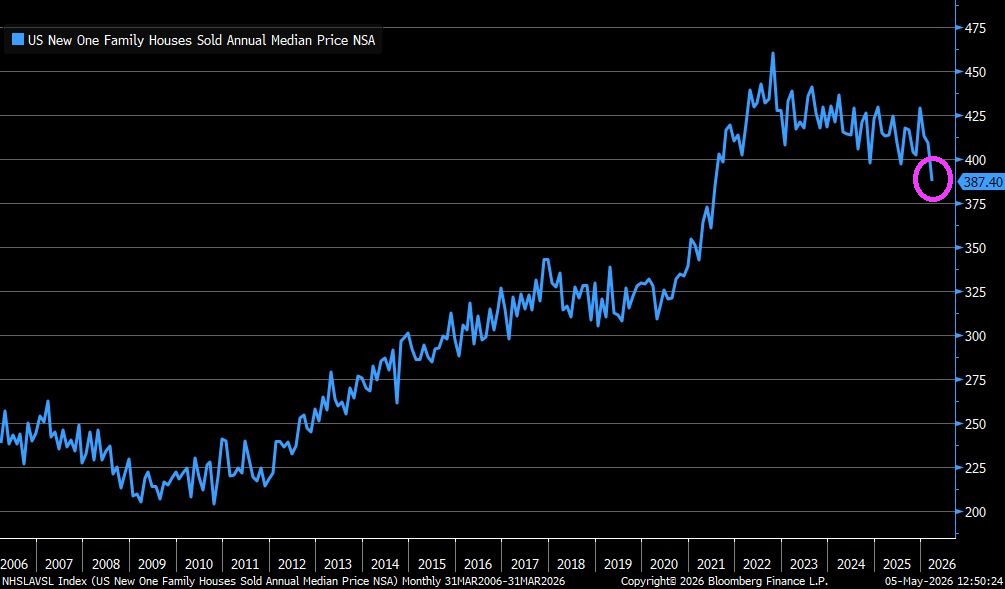
Median price for new single family homes fell to $387,400 in April, dropping 6.2% y/y to its lowest level since July 2021.

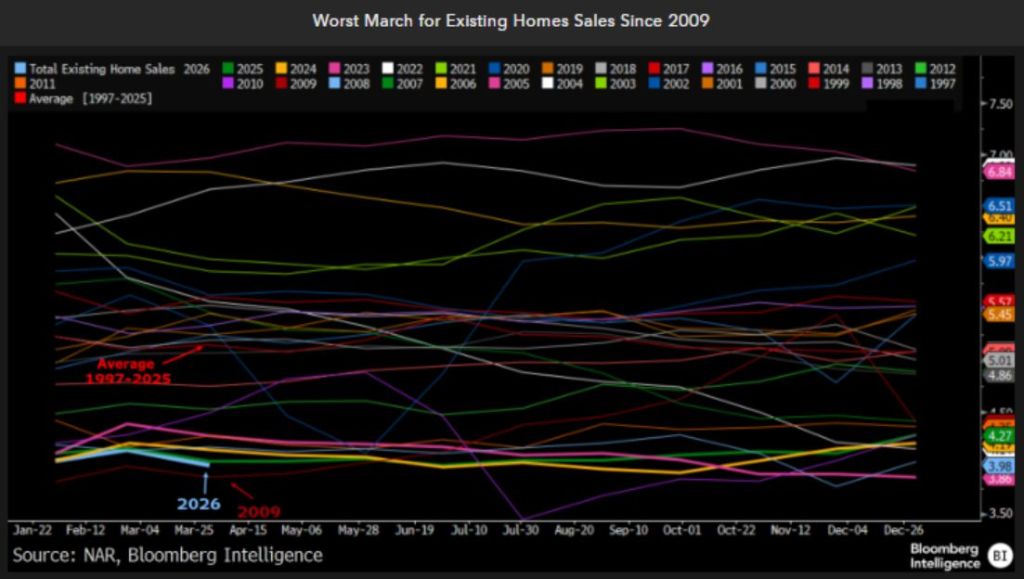
Worst March for existing home sales since 2009.

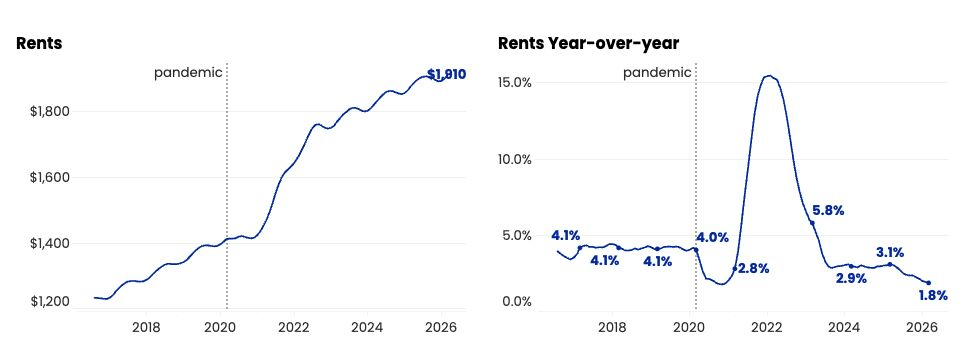
Rents? Lowest since pre-pandemic.

Is Rosa DeLauro actually Moe Howard with purple hair??

Housing Permits Fall To 7 Month Low, Fed Keeps Rates Unchanged, 2Y Treasury Yield Jumps 10 BPS (Ill Gov JB Pritzker Approves Psychedelic Gerrymandered Map)

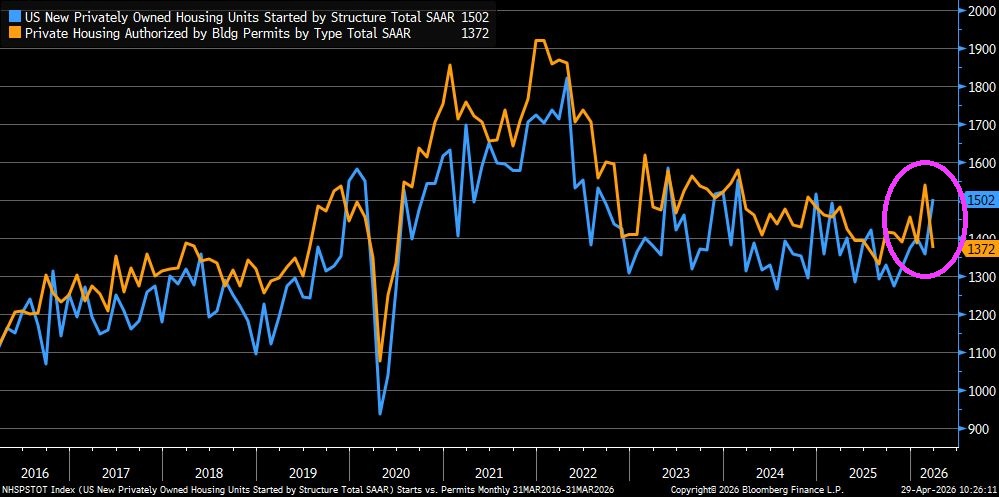
March housing starts hit their highest level since December 2024 but permits fell sharply to a seven-month low.

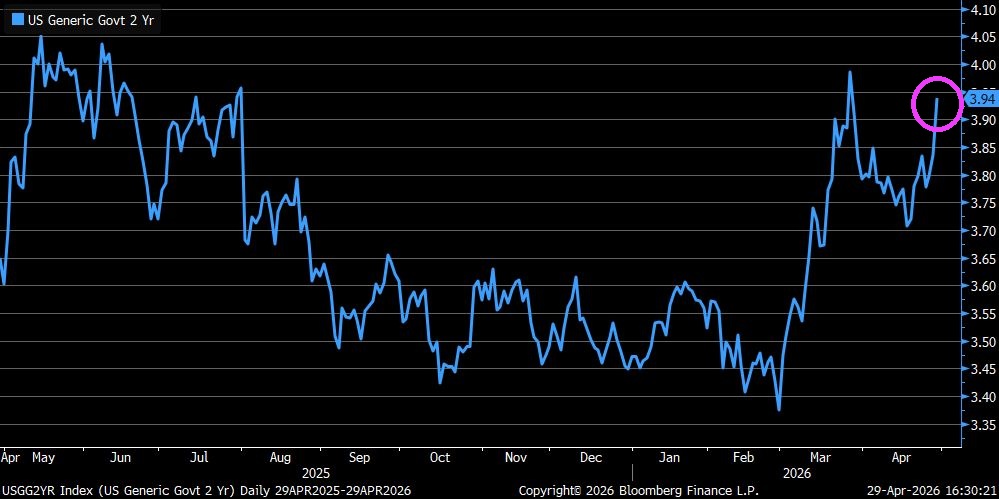
Yesterday’s Fed meeting left interest rates unchanged but 2y Treasury yield jumped 10bps to 3.94%.

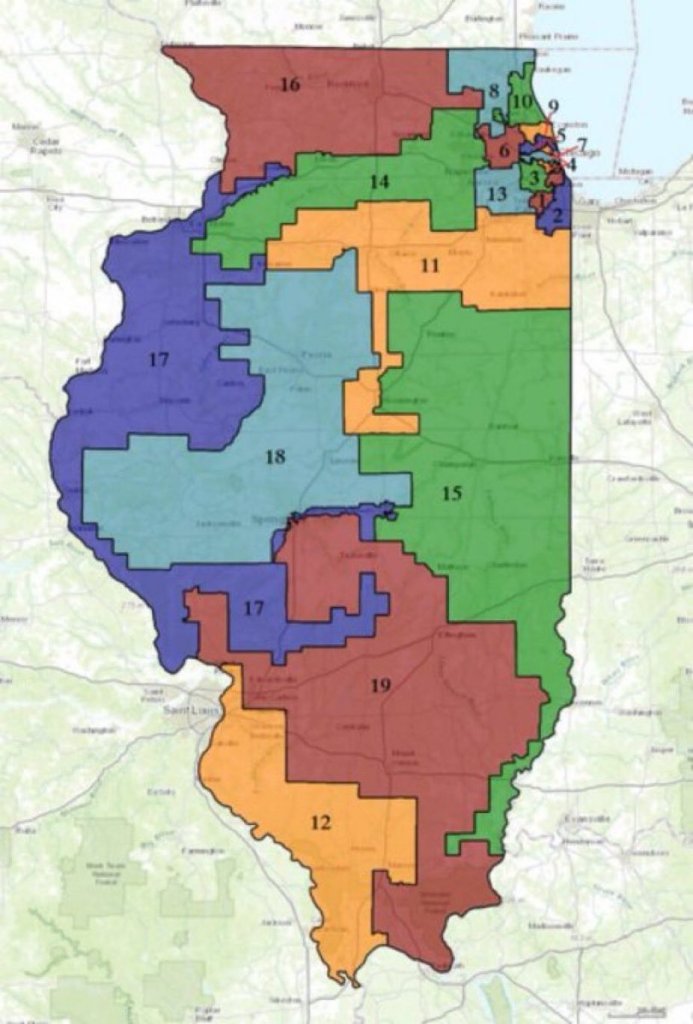
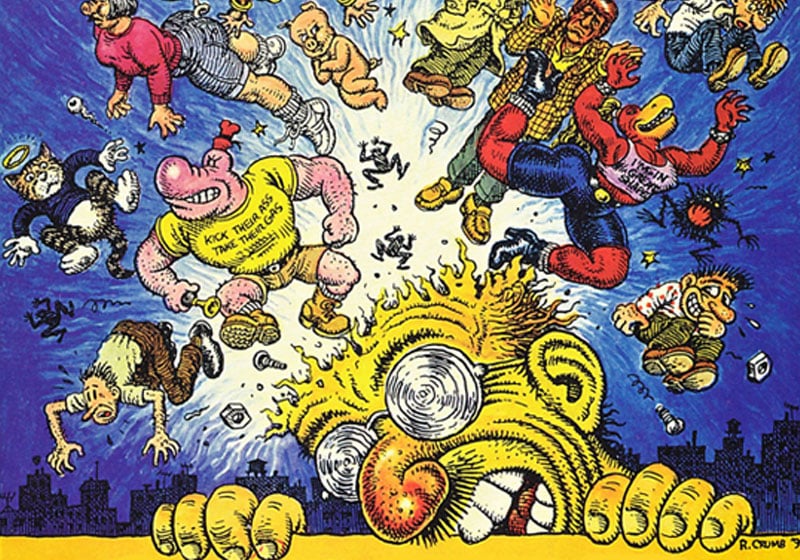
Here is the Illinois Congressional map that Ill Governor JB Pritzker approved. Almost looks like a psychedelic map of R Crumb.

It almost looks like artist R Crumb drew the Congressional map of Illinois.

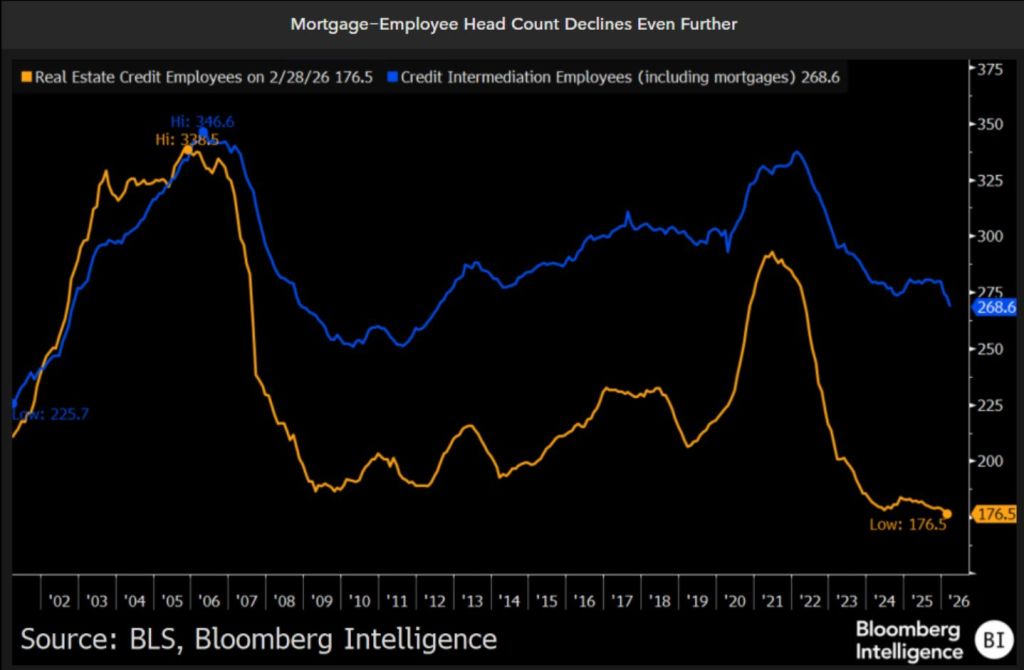
Mortgage Employment Headcount Lowest Since Housing Bubble Of 2005 As Case-Shiller National Home Price Index UP 0.29% In February (Denver Leads In Price Declines Beating Tampa)

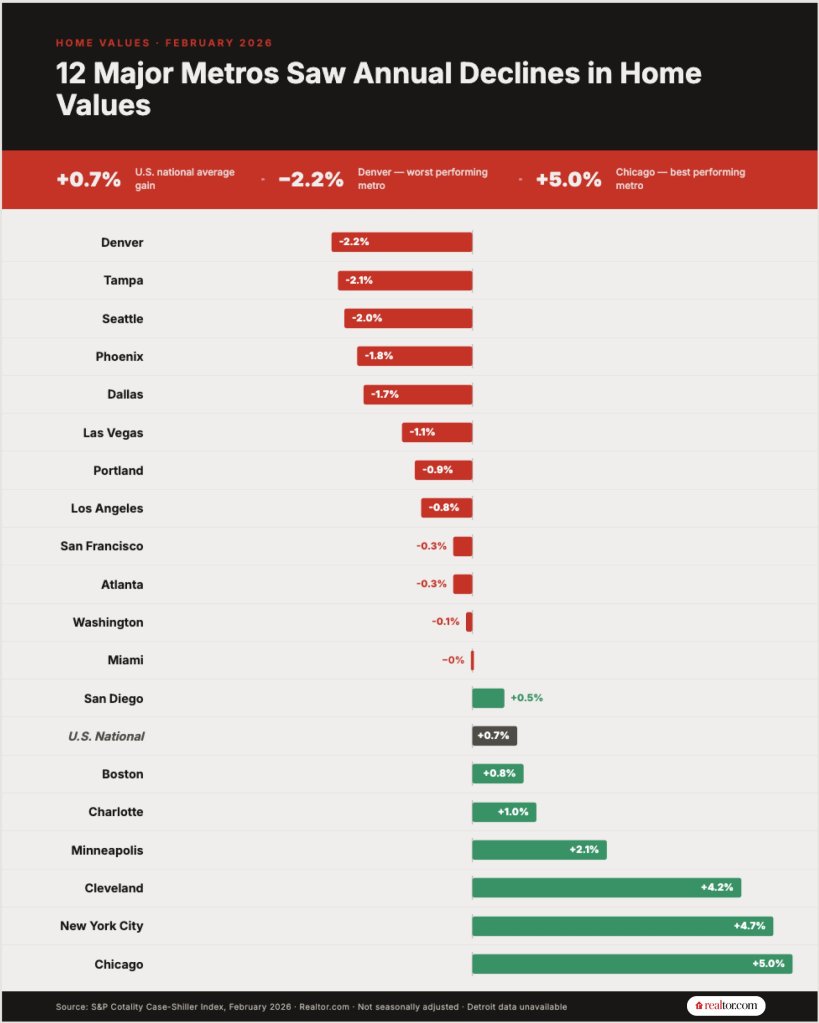
Home values in Denver are falling faster than any other major metro area tracked by a key index, earning the Mile High City a dubious distinction as the weakest housing market in the nation.

More than half of major U.S. metropolitan areas posted year-over-year home price declines in February, with Denver (-2.2%) displacing Tampa (-2.1%) as the weakest market, according to data from the S&P Cotality Case-Shiller Index released Tuesday.

Los Angeles (-0.8%) and Washington, DC (-0.1%) also joined the list of markets with falling home values, signaling weakness that expanding out of the long-suffering Sunbelt region.

kkk


Mortgage employee headcount has fallen to lowest level since the housing bubble and mortgage crisis of 2005-2008.

Trump Threatens To Bomb Iran Back To The Stone Age, Crude Oil And US Gasoline Prices Return To Obama/Biden Era Levels For The Moment

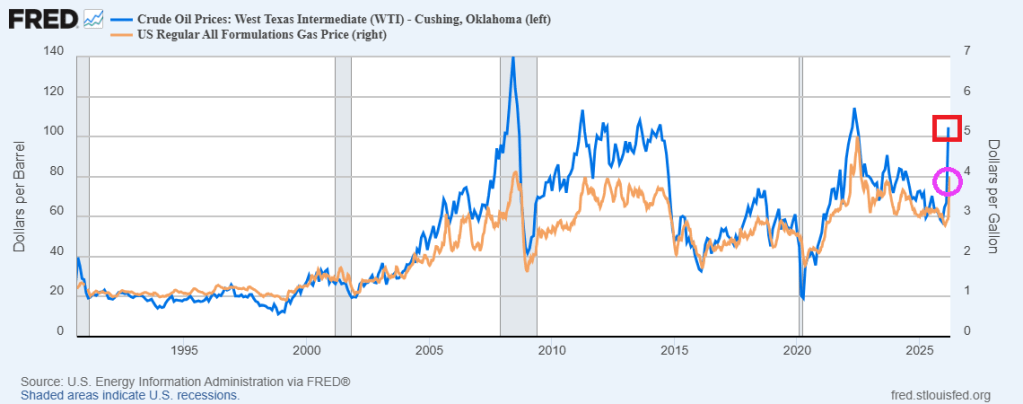
Since the attack on Iran by Israelis and US forces, crude oil and gasoline prices have soared … back to Obama and Bidem era levels.

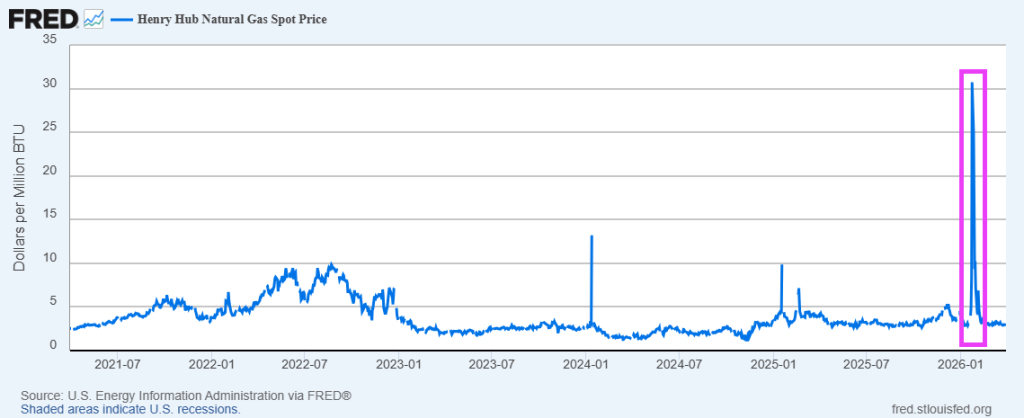
How about the impact of the Arctic cold blasts the northern states have received? You can see the spike in the Henry Hub Natural Gas Spot Price

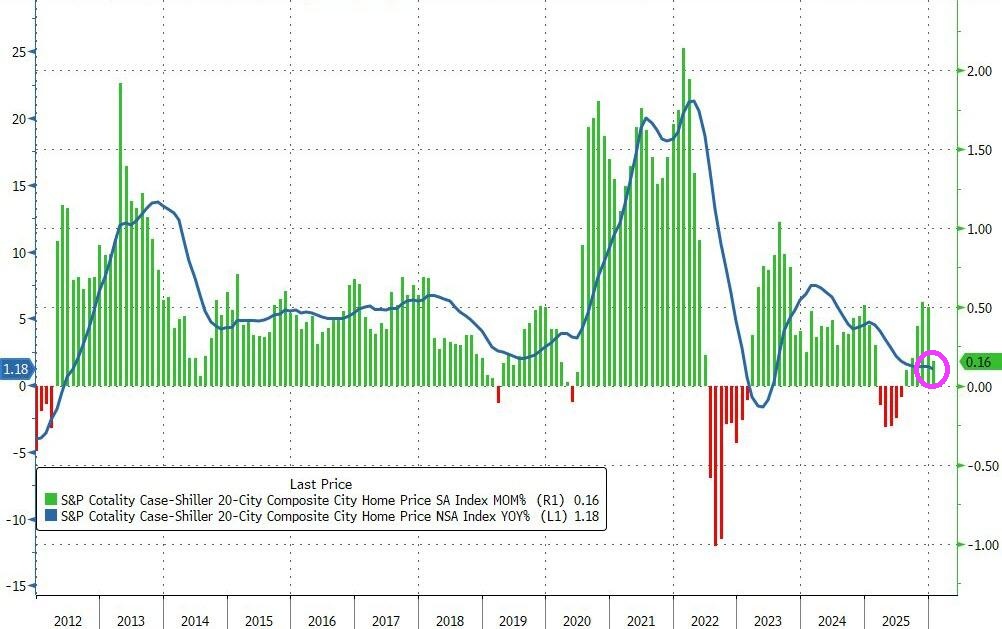
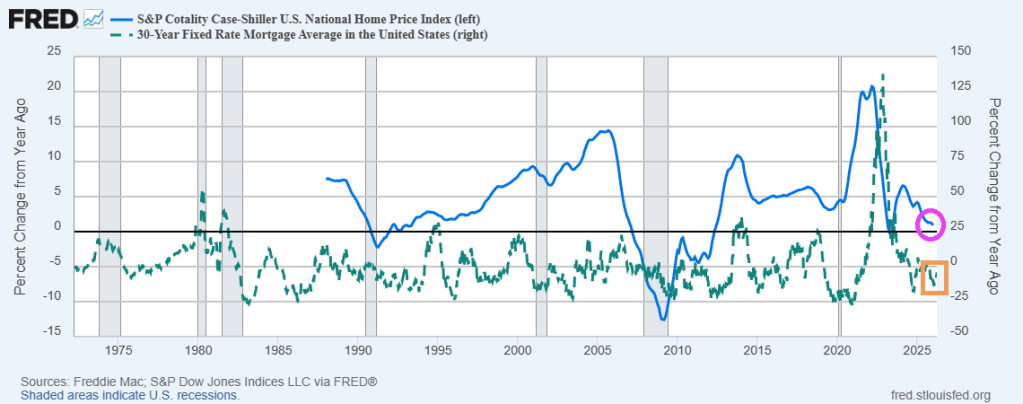
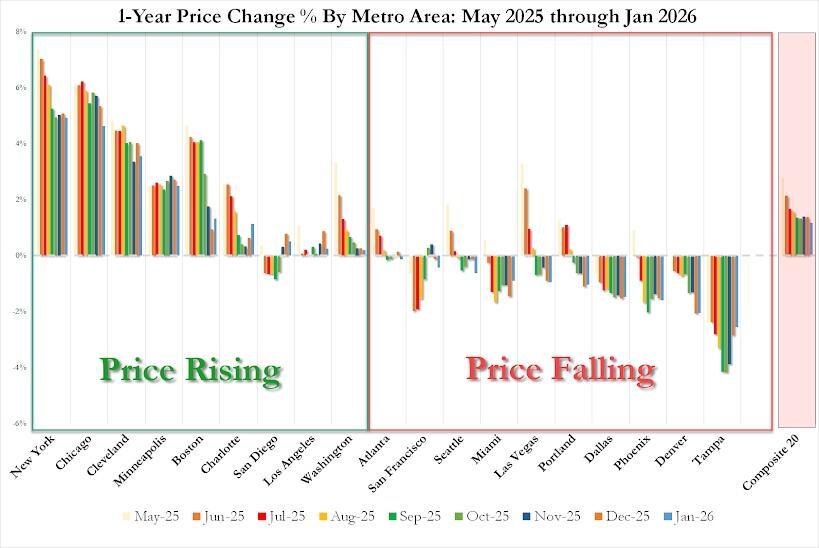
Home Prices Rise 0.9% YoY Despite Lower Mortgage Rates (Blue City Mean Reversion, New York 4.9% YoY Gain, Chicago 4.6% YoY, Cleveland 3.6% YoY While Tampa -2.5%)

We are seeing mean reversion in home prices in red cities and blue cities.

The price of homes in America’s to 20 cities rose just 0.16% MoM in January (the lowest MoM rise since August and well below the 0.35% MoM expected.

Source: Bloomberg

Home prices rose 0.9% YoY as mortgage rates have fallen. Home prices are still too high.

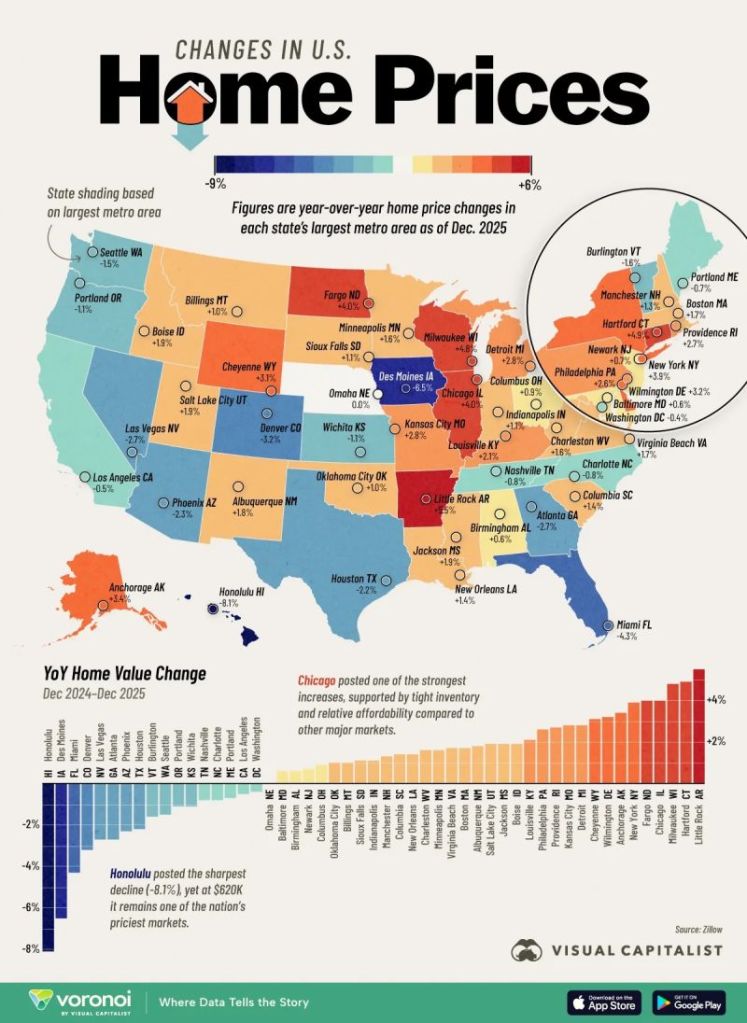
New York leads with a 4.9% annual gain, followed by Chicago at 4.6% and Cleveland at 3.6%, while Tampa fell 2.5%…

Don’t be confused. This isn’t leftists running to blue cities. It is mean reversion. The prior fleeing blue cities to red cities created a mean reversion effect where red cities home prices rose too fast and blue cities fell too fast.

Little Rock?

Hot, Hot, Hot! Producer Prices Print At 0.7% MoM, 3.4% YoY In February (Hottest Since Jan 2025) What Will Powell And Fed Do?

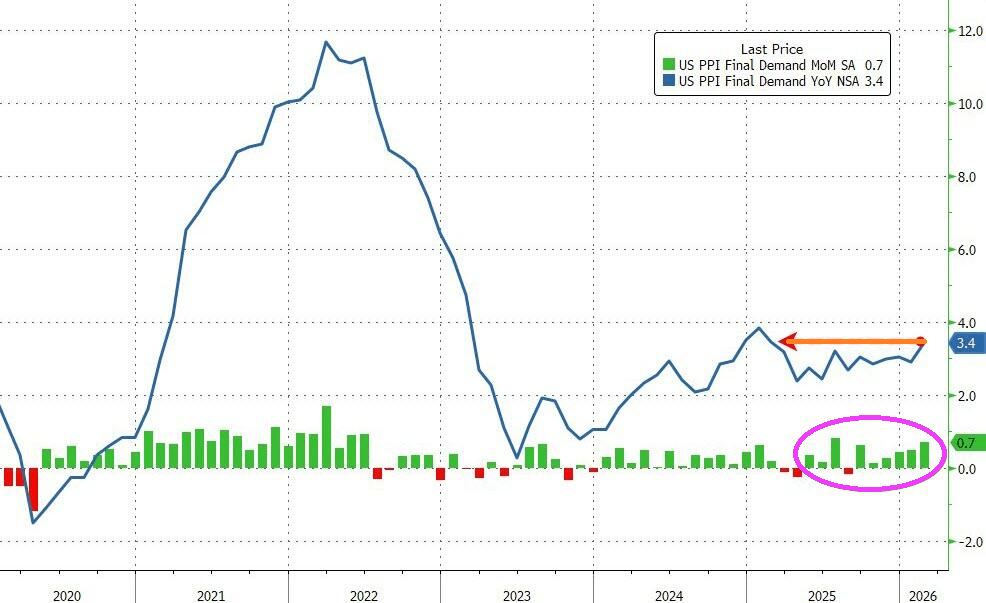
Producer prices are hot, hot, hot!

Producer prices were higher by 3.4% YoY (notably hitter than the 3.0% expected and up from the 2.9% prior). That is the hottest PPI since January 2025

Source: Bloomberg

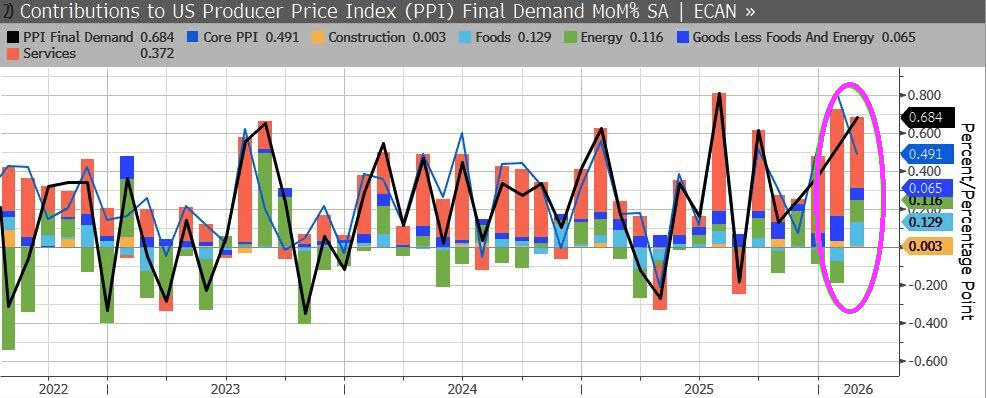
More than half of the February rise in prices for final demand can be attributed to a 0.5-percent advance in the index for final demand services. Prices for final demand goods increased 1.1 percent.

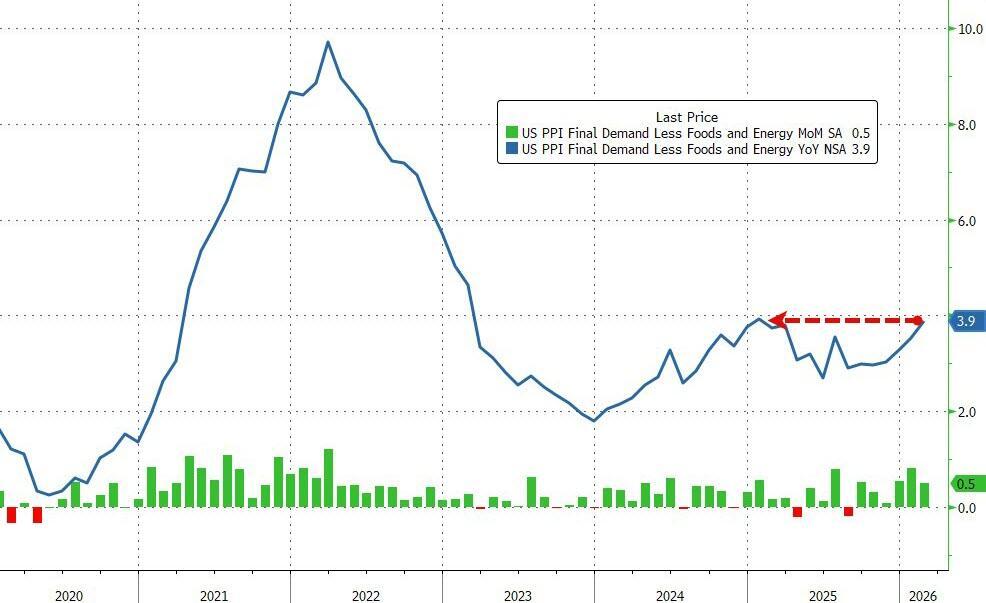
Core PPI (ex Food and Energy) also soared (+0.5% MoM) pushing core prices up by 3.9% YoY – the highest since Jan 2025.

Source: Bloomberg

What will Powell and The Fed do??