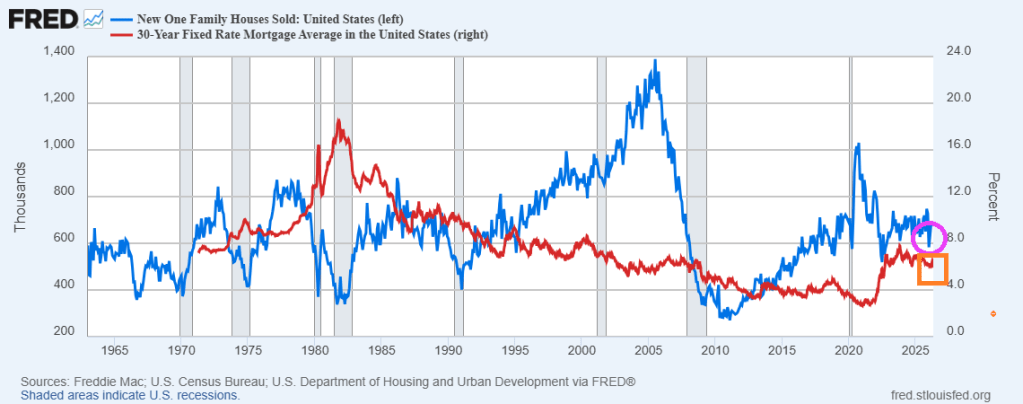
High home prices show signs of cooling, mortgage rates remain fairly constant, while new home sales increase by 47k in March. Despite rising mortgage rates.
The bigger picture? New home sales remain relatively depressed after the Covid outbreak in 2020.
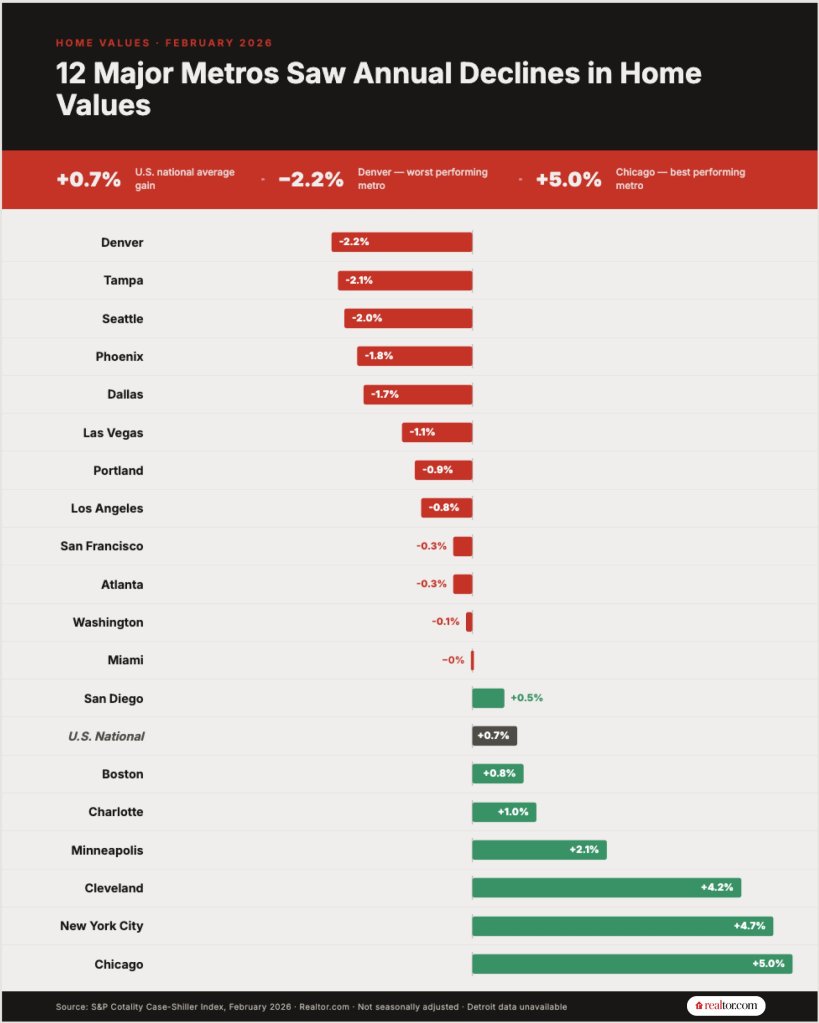
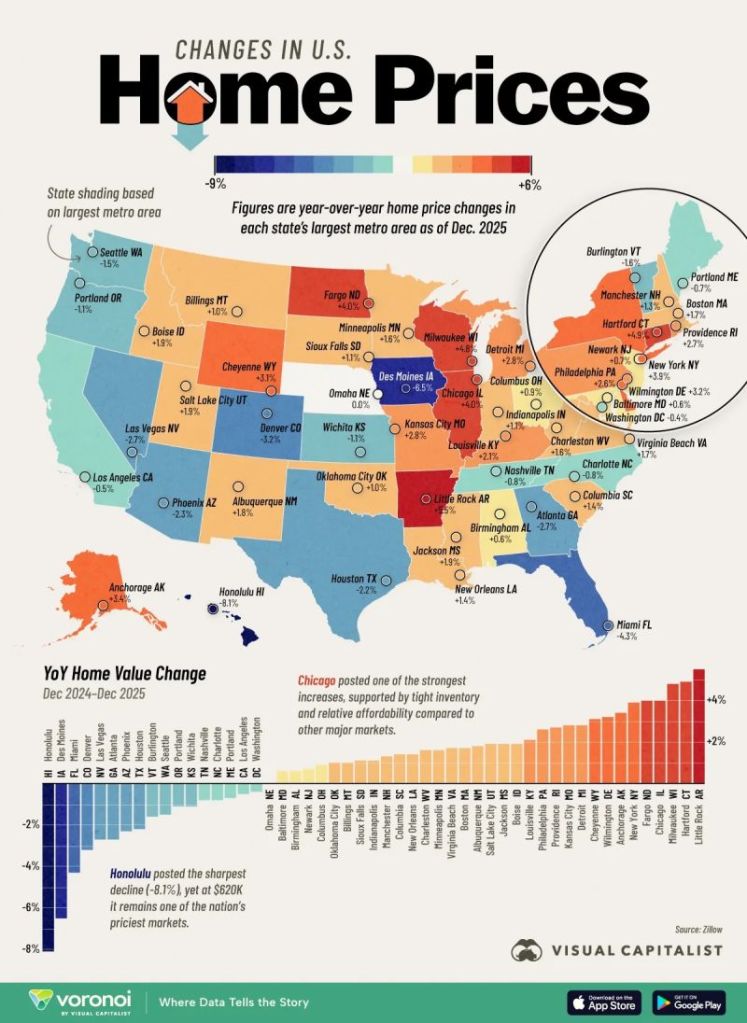
More than half of major U.S. metropolitan areas posted year-over-year home price declines in February, with Denver (-2.2%) displacing Tampa (-2.1%) as the weakest market, according to data from the S&P Cotality Case-Shiller Index released Tuesday.
Los Angeles (-0.8%) and Washington, DC (-0.1%) also joined the list of markets with falling home values, signaling weakness that expanding out of the long-suffering Sunbelt region.
kkk
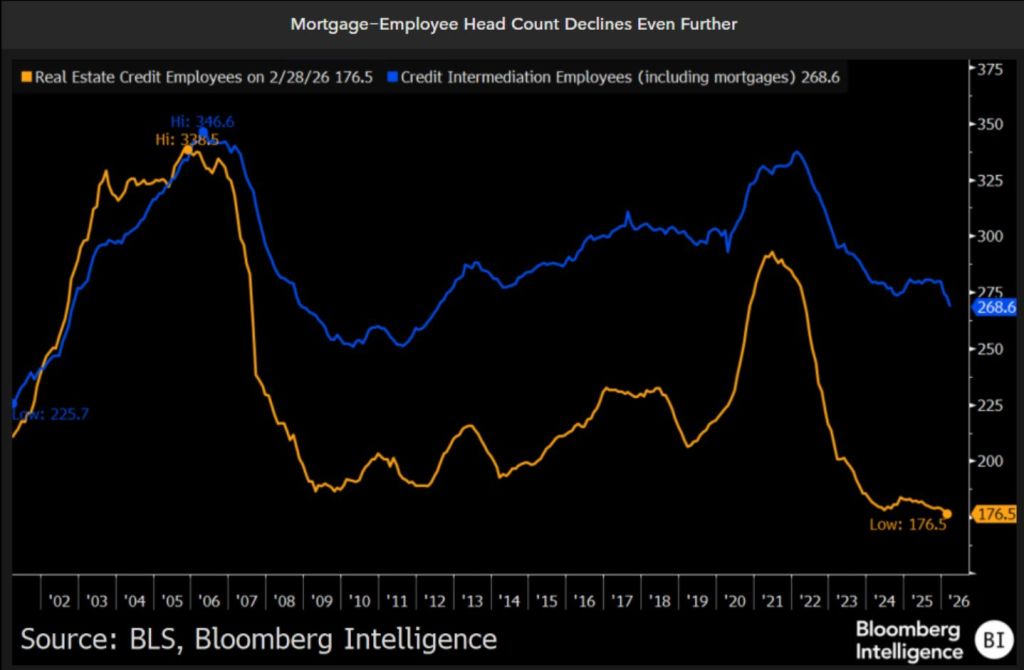
Mortgage employee headcount has fallen to lowest level since the housing bubble and mortgage crisis of 2005-2008.
We are seeing mean reversion in home prices in red cities and blue cities.
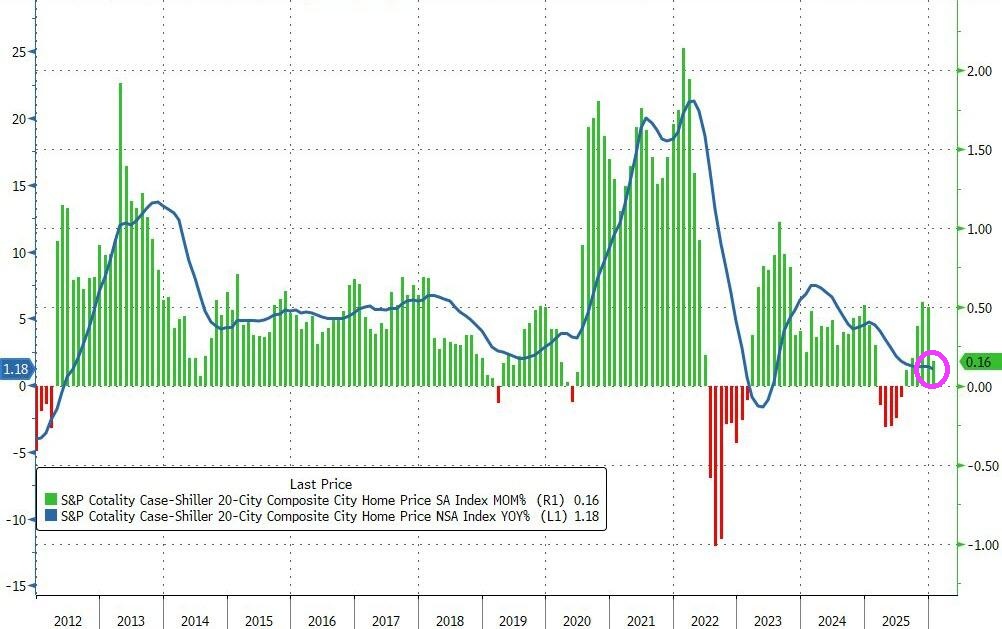
The price of homes in America’s to 20 cities rose just 0.16% MoM in January (the lowest MoM rise since August and well below the 0.35% MoM expected.
Source: Bloomberg
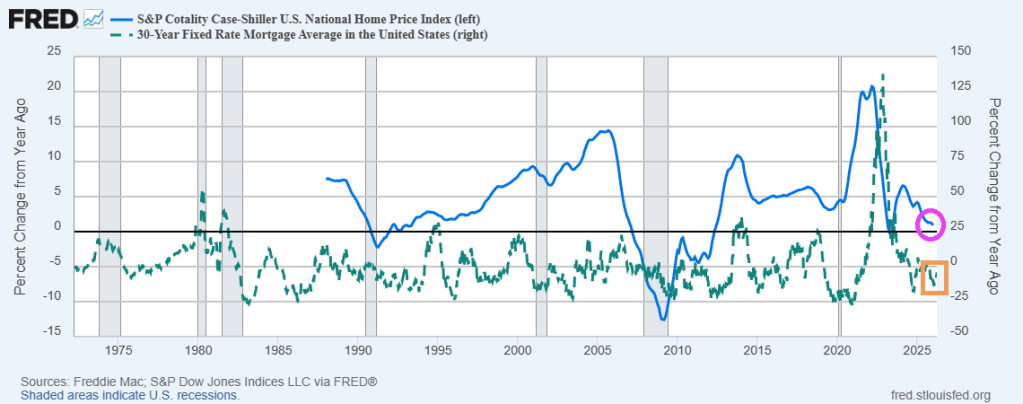
Home prices rose 0.9% YoY as mortgage rates have fallen. Home prices are still too high.
New York leads with a 4.9% annual gain, followed by Chicago at 4.6% and Cleveland at 3.6%, while Tampa fell 2.5%…
Don’t be confused. This isn’t leftists running to blue cities. It is mean reversion. The prior fleeing blue cities to red cities created a mean reversion effect where red cities home prices rose too fast and blue cities fell too fast.
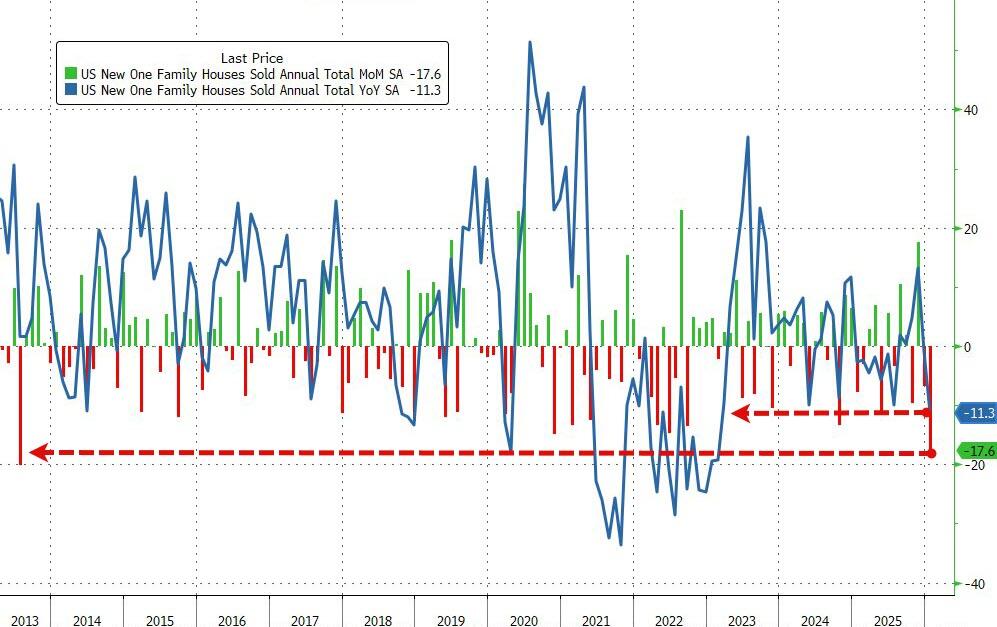
Despite falling mortgage rates, analysts expected December’s drop in new home sales to accelerate in January… and accelerate they did… crashing a stunning 17.6% MoM (-2.7% MoM exp) – the biggest MoM drop since July 2013.
This huge MoM drop dragged sales down 11.3% YoY – the worst slide in three years.
Source: Bloomberg
This huge drop dragged the new home sales SAAR down to its lowest since 2022, catching down to existing and pending sales…
Inventories are up (Houses for sale in Jan. rose 0.4% m/m to 476,000), prices are down (Median down 6.8% YoY at $400k – lowest since 2024)…
…and remember these deals were signed in January – meaning this is not mortgage related (some suggesting weather impact – Northeast sales down 44.7% MoM, MidWest -33.9% MoM, but the scale is immense).
Moral of the story: US home prices are too high for millions of households to afford.
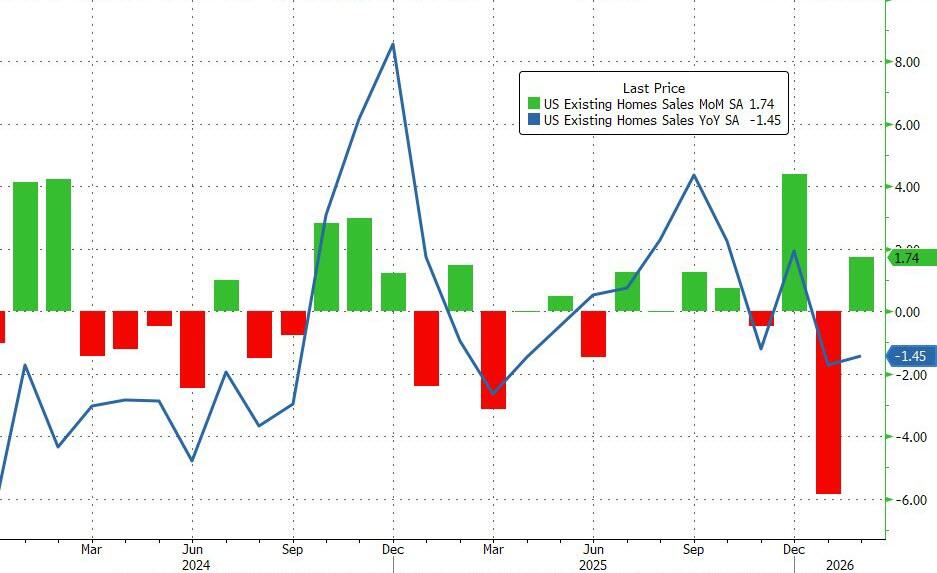
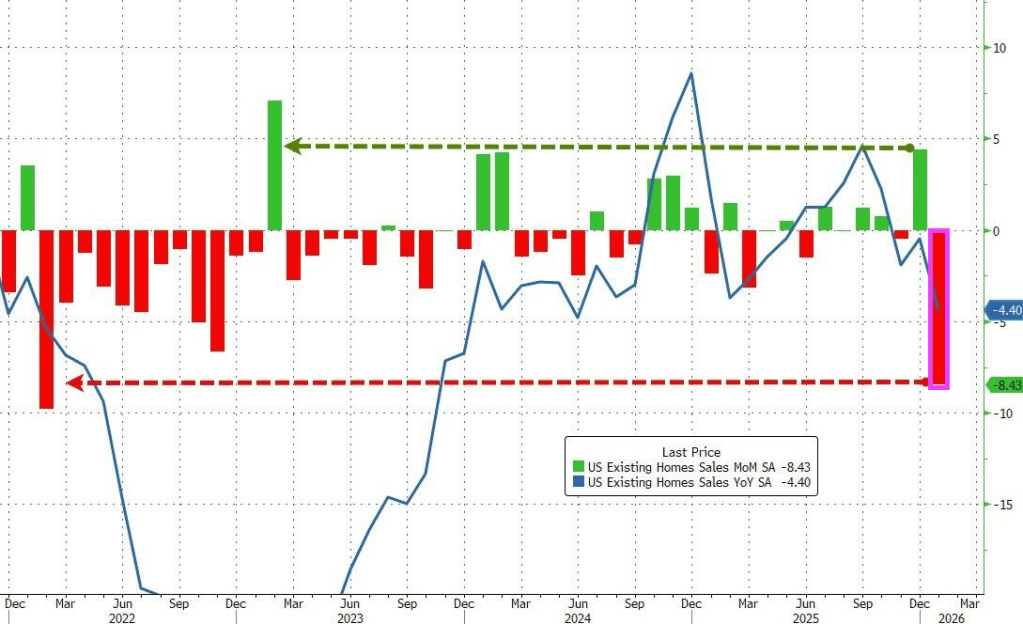
Existing homesales actually surprised to the upside, rising 1.7% MoM in February. Perhaps even more notably, January’s 8.4% MoM plunge was revised up to a slightly less crazy 5.9% MoM drop.
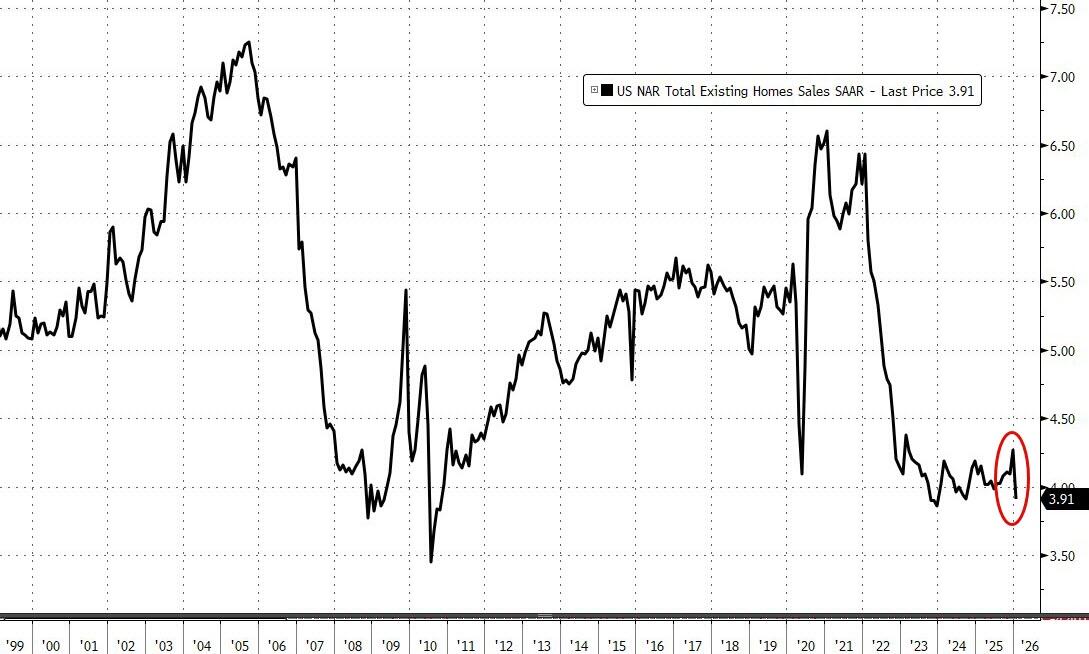
With the beat and upward revision, existing home sales were down just 1.45% YoY but SAAR topped 4mm (4.09mm) once again.
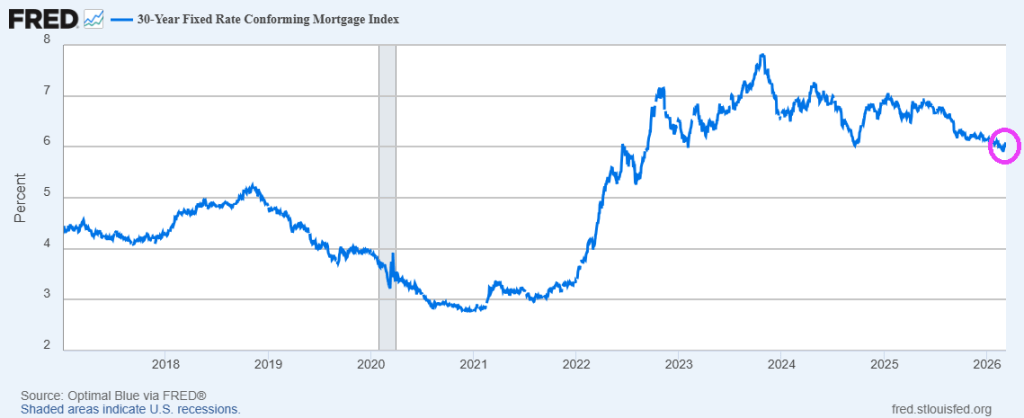
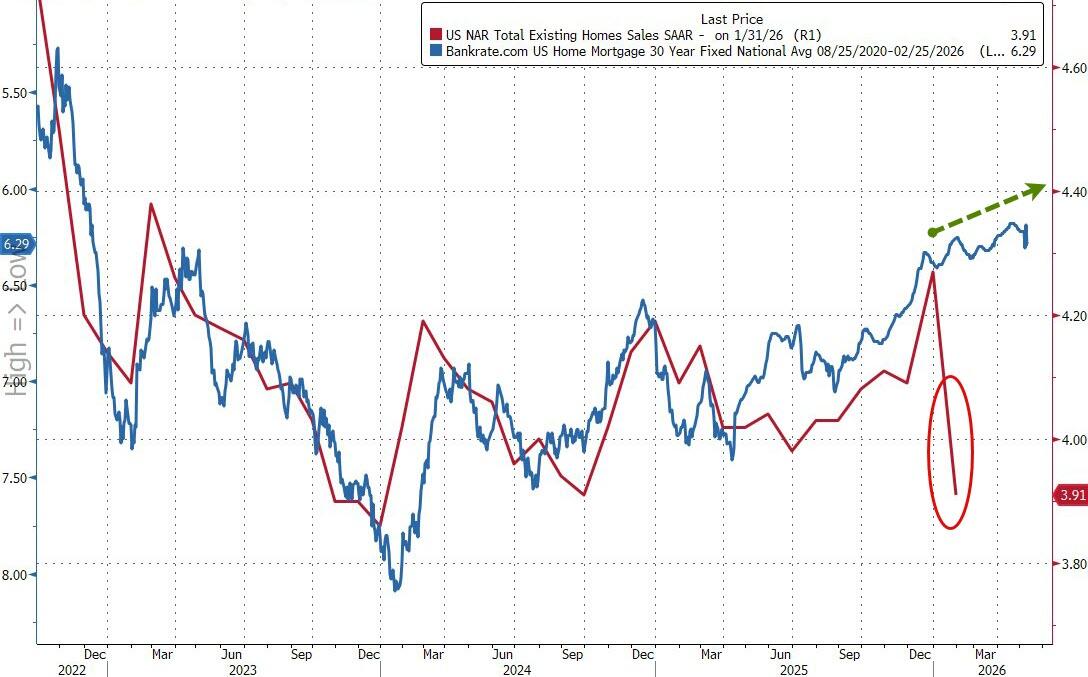
On the bright side, with mortgage rates at their lowest since 2022, existing home sales look set to continue to improve (unless Trump’s war triggers more panic in rates).
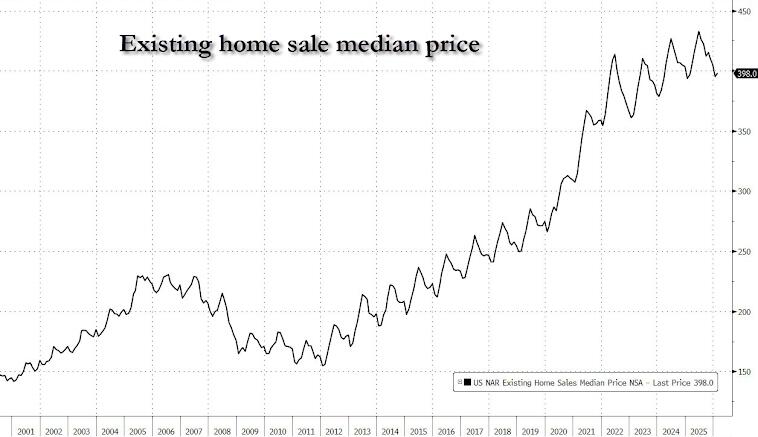
The NAR report showed the median selling price rose 0.3% from a year earlier — one of the smallest advances since the pandemic housing frenzy — to $398,000 last month.
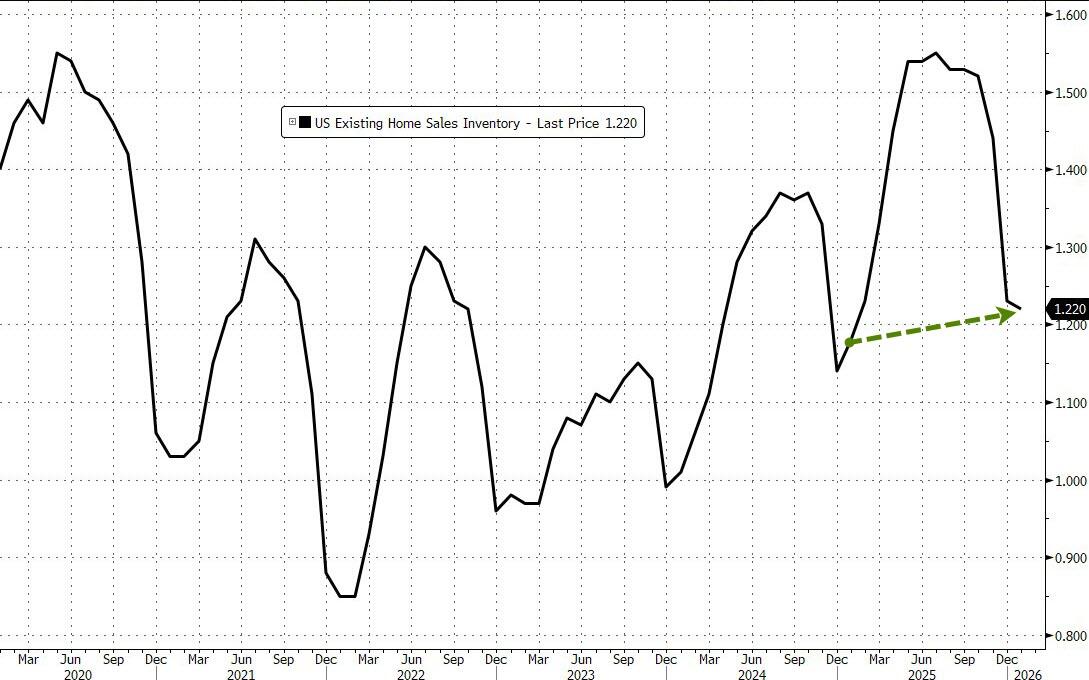
The inventory of previously owned homes increased 4.9% from a year ago to 1.29 million — the most for any February since 2020.
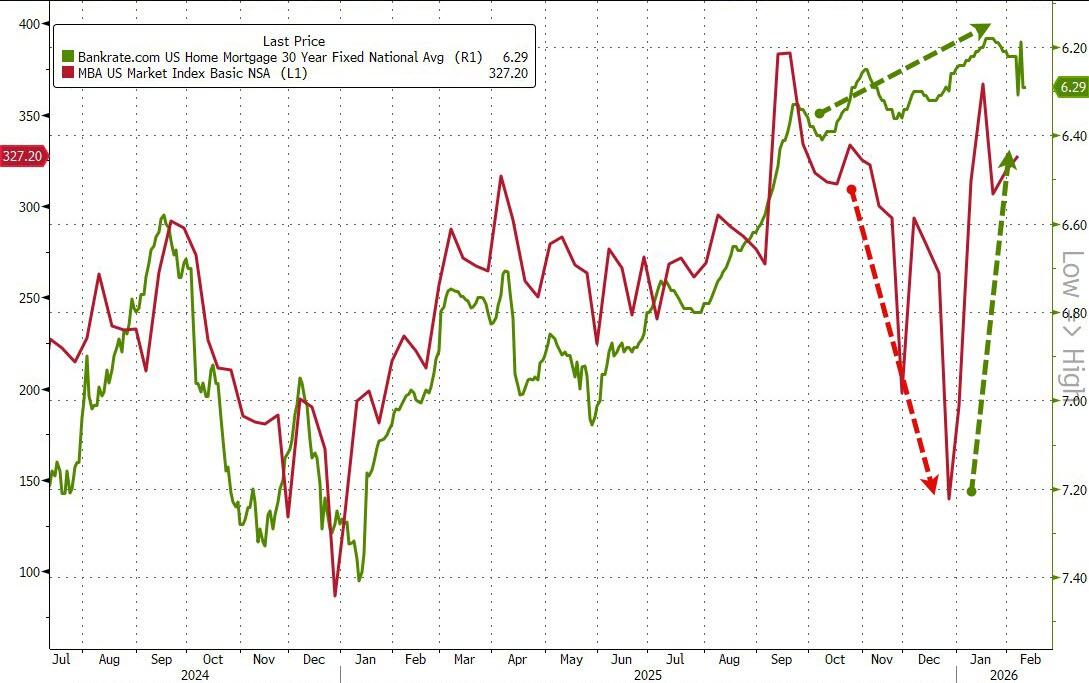
Mortgage rates? Up yesterday, but near lowest since 2023.
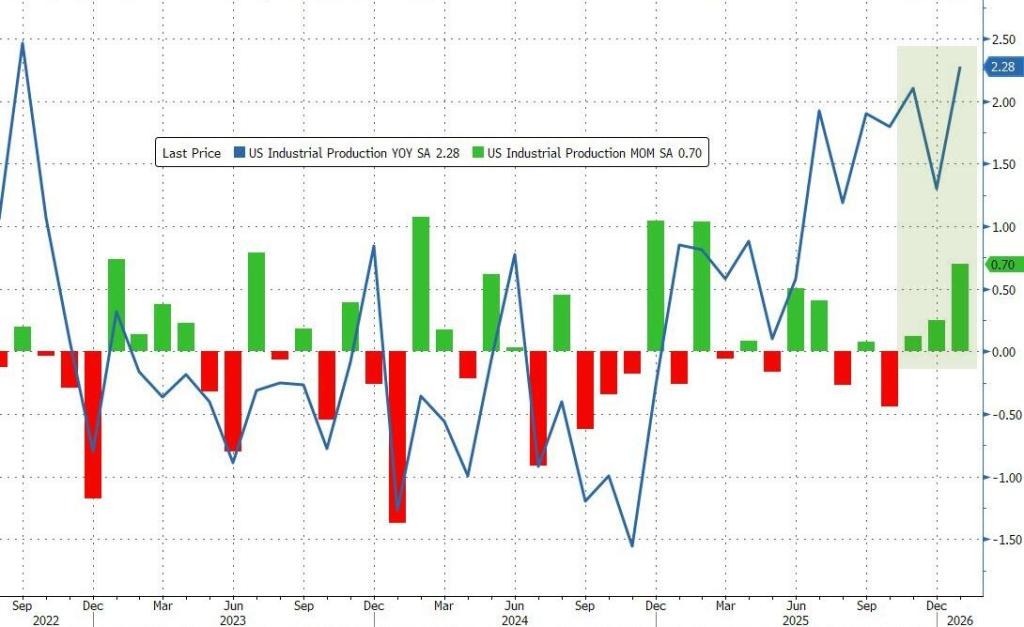
So much for the leftist fearmongers claiming that Trump Tariffs will kill US manufacturing, In January, US industrial production rose 0.7% MoM. And 2.28% YoY.
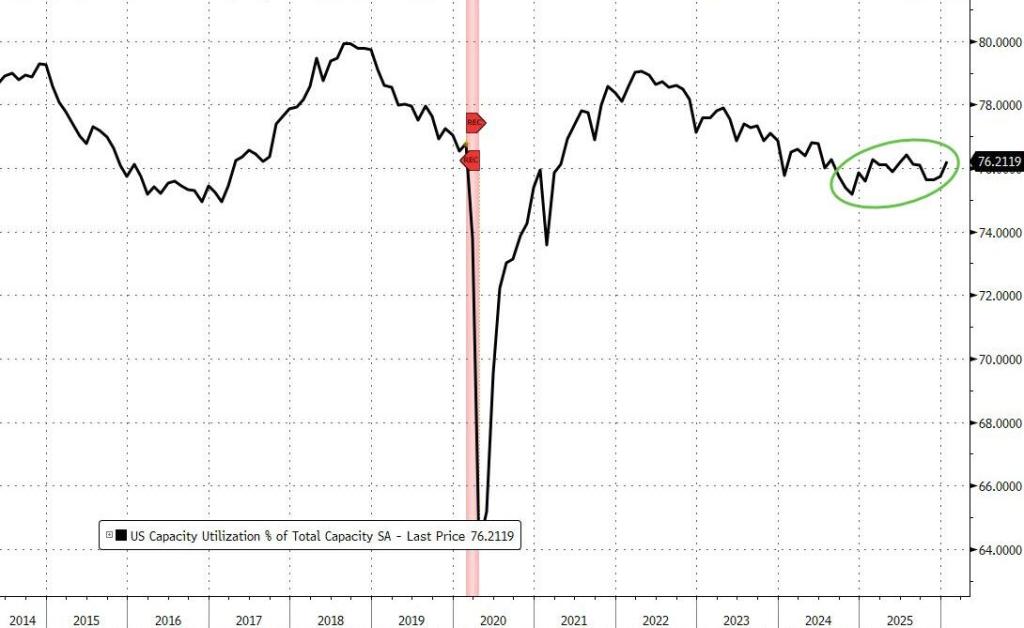
Capacity utililzation rose in January to 76.22%.
Pass the Save Act and don’t listen to leftist propaganda that women won’t be allowed to vote. Then get a passport and show that.
Rate-cut expectations have surged (dovishly) higher this week (along with tumbling Treasury yields) amid a mixed macro picture (Labor market ‘good’, Retail sales bad, Housing ugly).
Today could change all that as CPI for January prints with risk skewed to the upside. January brings annual resets and they tend to surprise on the high side.
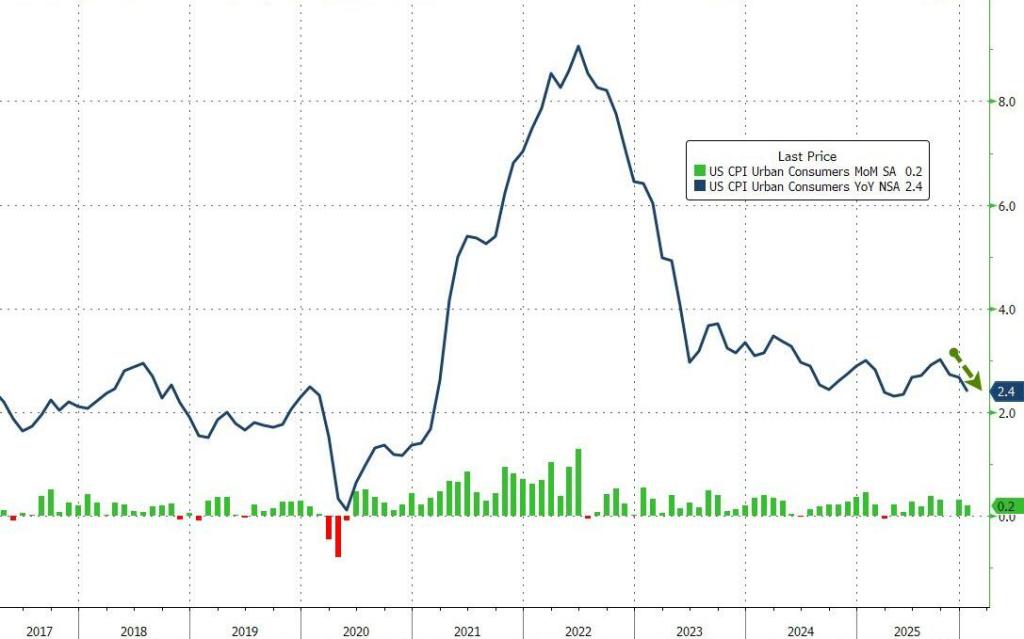
Despite the ‘hot’ whisper numbers (and 4 previous Januarys in a row of upside surprises), headline consumer price inflation came in cooler than expected in January (+0.2% MoM vs +0.3% expected). That pulled the headline CPI down dramatically from +2.7% to +2.4% – near the lowest in 4 years.
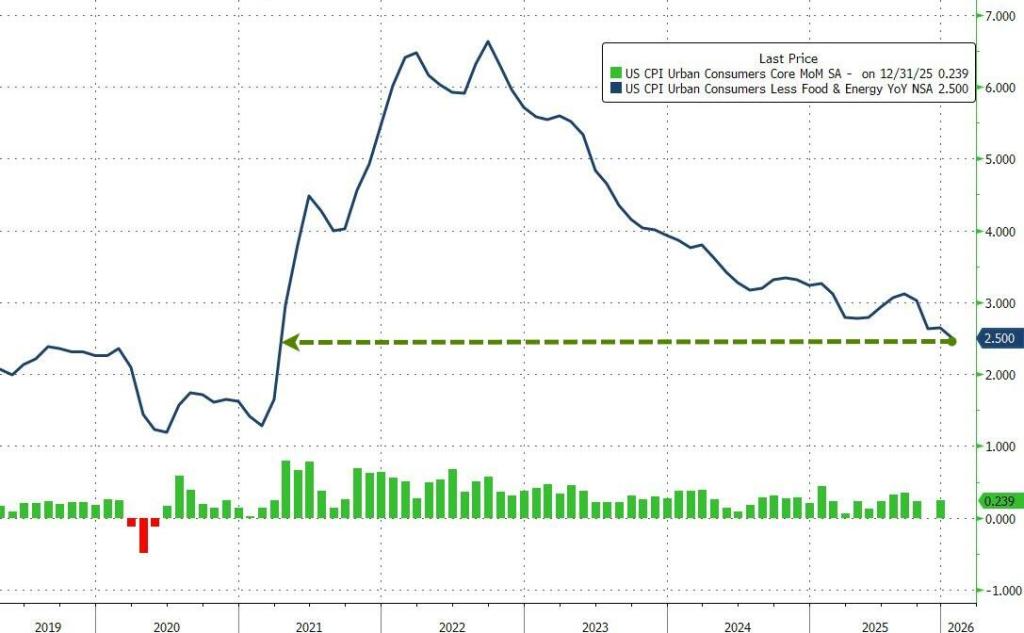
Core CPI printed +0.3% MoM (in line with expectations), lowering the YoY change in core prices to +2.5% – the lowest since March 2021.
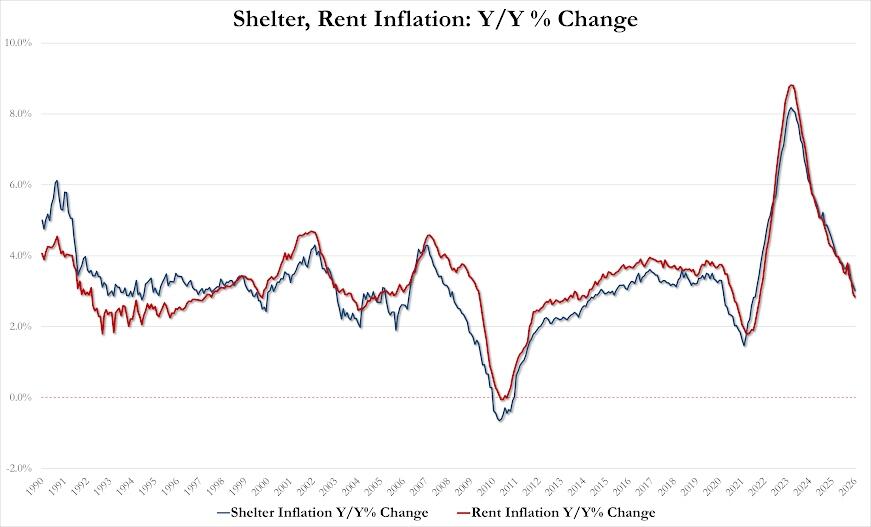
The Shelter index rose 0.2% in January and was the largest factor in the all items monthly increase. The food index increased 0.2% over the month as did the food at home index, while the food away from home index rose 0.1 percent. These increases were partially offset by the index for energy, which fell 1.5% in January.
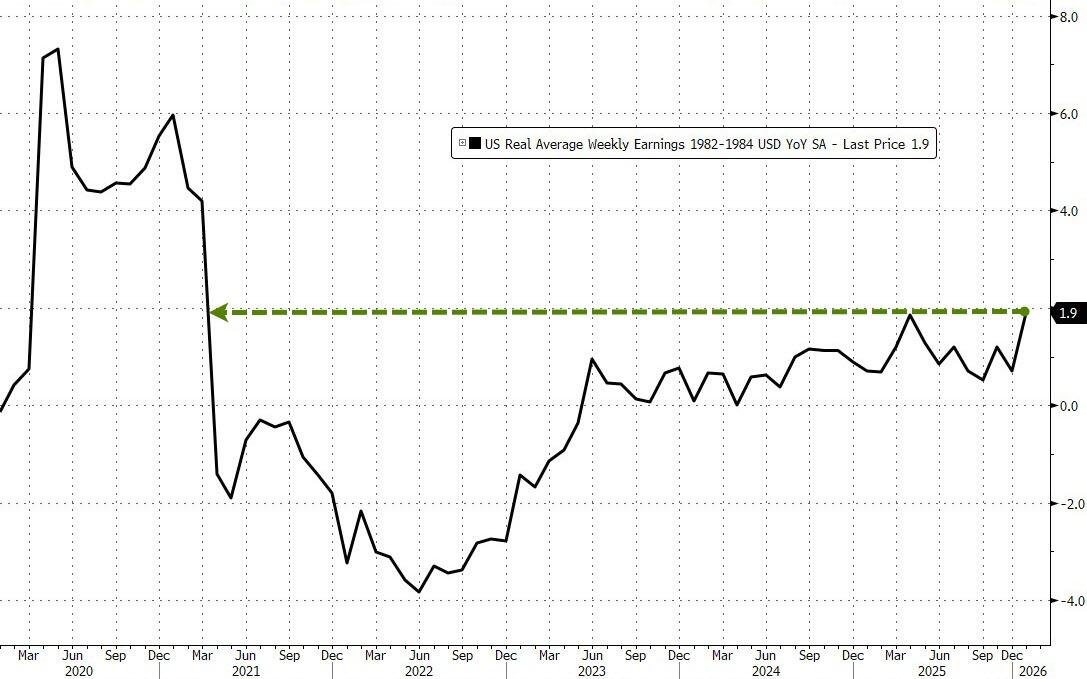
January saw real average weekly earnings rise 1.9% YoY – its highest since March 2021…
The analysts were correct on the direction but wrong on the scale as existing home sales plunged 8.4% MoM in January from a downwardly revised +4.4% MoM in December. That is the biggest MoM drop since February 2022.
While some suggested this could be impacted by the Winter Storms, this is based on contracts signed in November/December… and the biggest decline was in The West (which had zero weather impact)
Nevertheless, realtors gonna realtor:
“The below-normal temperatures and above-normal precipitation this January make it harder than usual to assess the underlying driver of the decrease and determine if this month’s numbers are an aberration,” NAR Chief Economist Lawrence Yun said in a statement.
That MoM plunge pulled the total SAAR down near 15 year lows…
Without an extended period of improved affordability, the recovery in the housing market is likely to be prolonged.
The NAR report showed the median selling price rose 0.9% from a year earlier to $396,800 last month.
First-time buyers represented 31% of buyers of existing homes in January, up slightly from 29% in the prior month and higher than a year ago.
The inventory of previously owned homes increased 3.4% in January from a year ago to 1.22 million.
A pickup in supply through 2025 has helped to tame price growth, though Yun said on a call with reporters that listings need to increase much more to help improve sales.
On the bright side, it appears mortgage applications are rebounding as the year started with lower rates…
Source: Bloomberg
Arguably, existing home sales have much further to go to the upside as the lagged mortgage rate has continued to decline… so what triggered this collapse?
Source: Bloomberg
Finally, circling back to where we started, NAR expects home sales to rise a stunning 14% this year, higher than most other forecasts but a figure that NAR Chief Economist Lawrence Yun said he feels “confident” in. That assumes more inventory will come on the market, mortgage rates will hover around 6% and the Fed will cut interest rates another two times, compared to policymakers’ median projection for one.
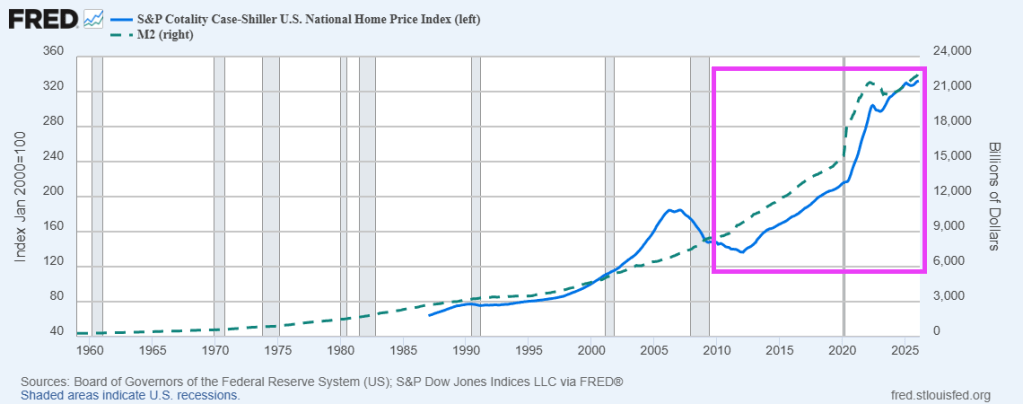
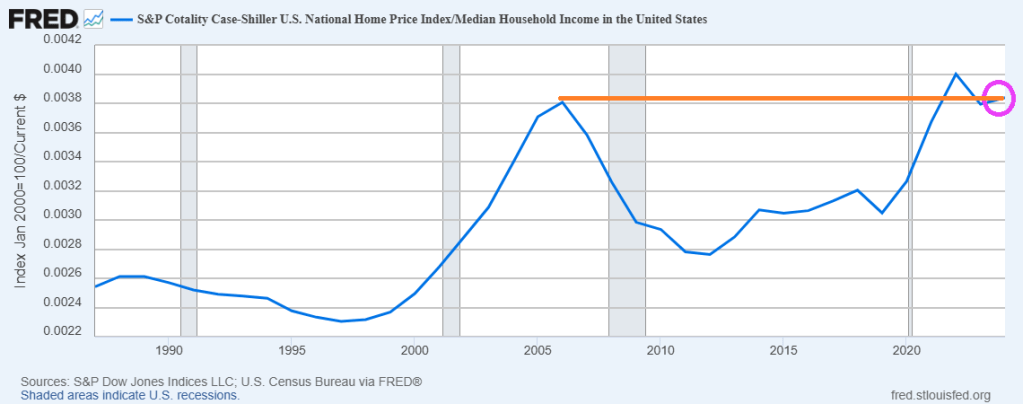
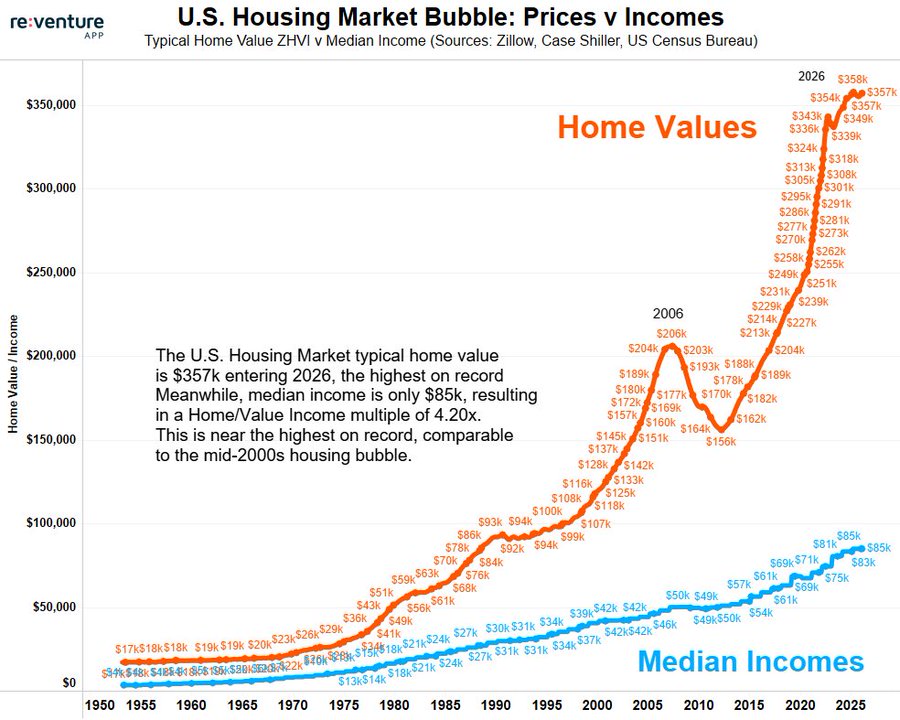
Yikes! The ratio of US Home Prices to US Median Household Income is now higher than the ratio during the catestrophic housing bubble during the latter half of the 2000s.
Here is a chart of home prices and median household incone,
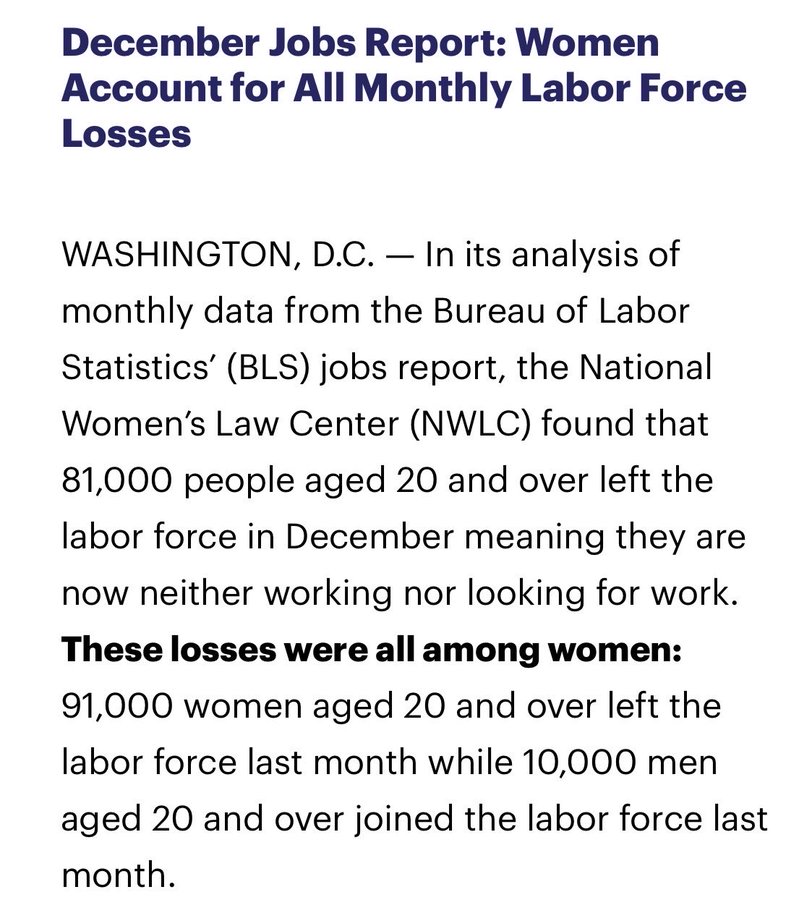
The labor market is truly screwed-up. The December jobs report reveals that women account for nearly all labor force losses.


You must be logged in to post a comment.