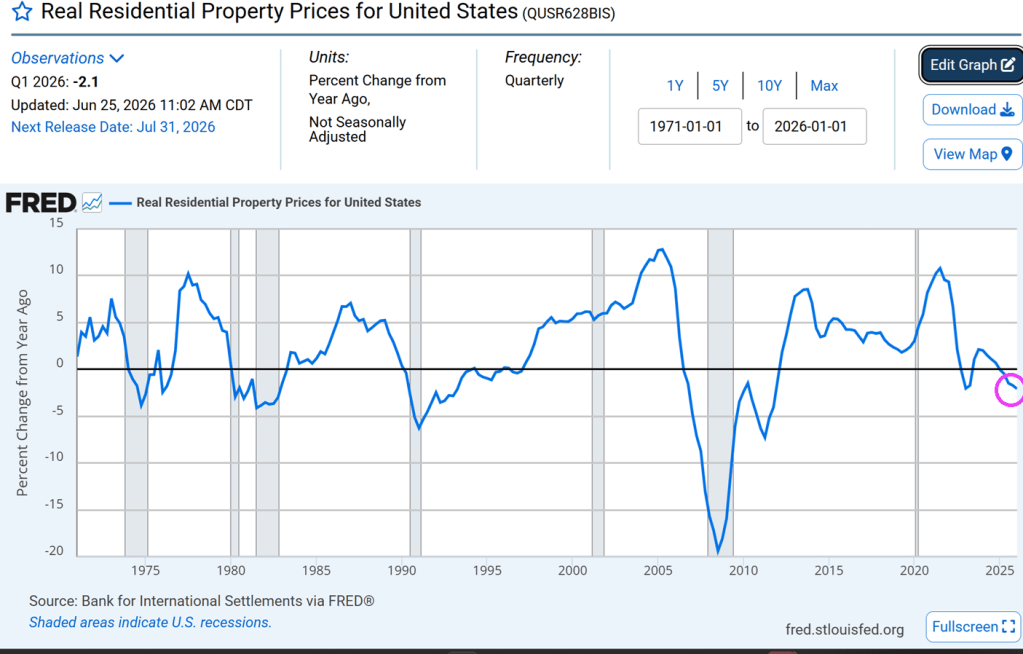
US home prices are clearly unaffordable for younger households, given the dearth of true starter homes. As of Q1 2026, REAL US residential property prices fell -2.1% YoY.
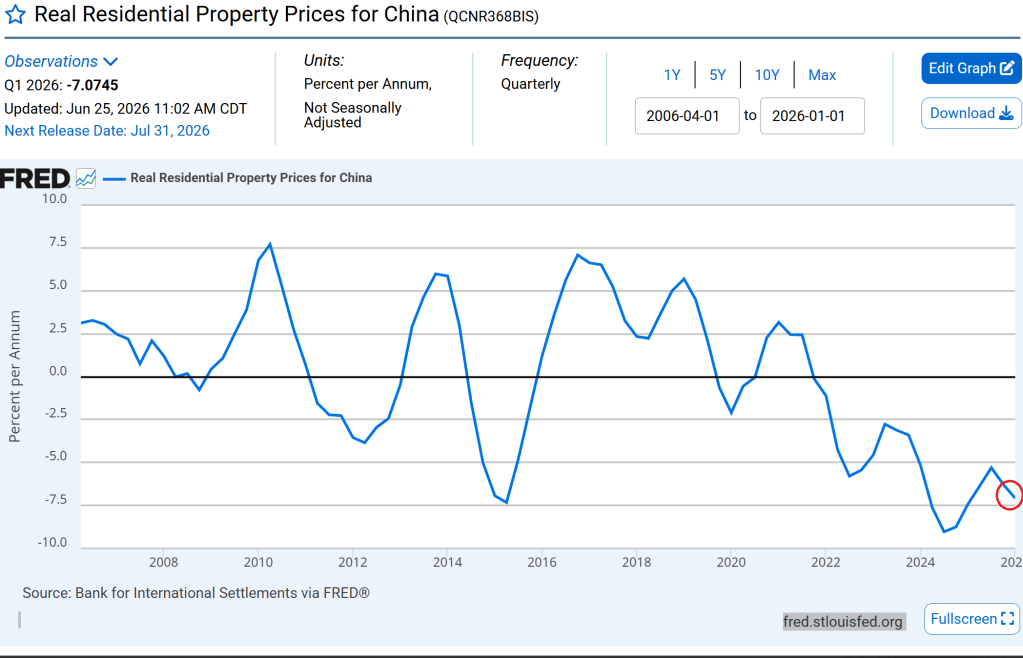
China’s real residential property prices are declining even faster than the US.
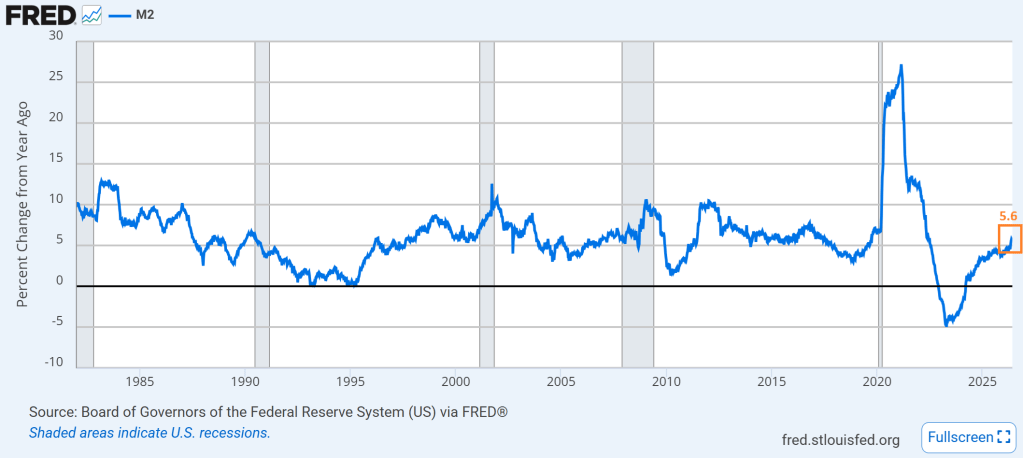
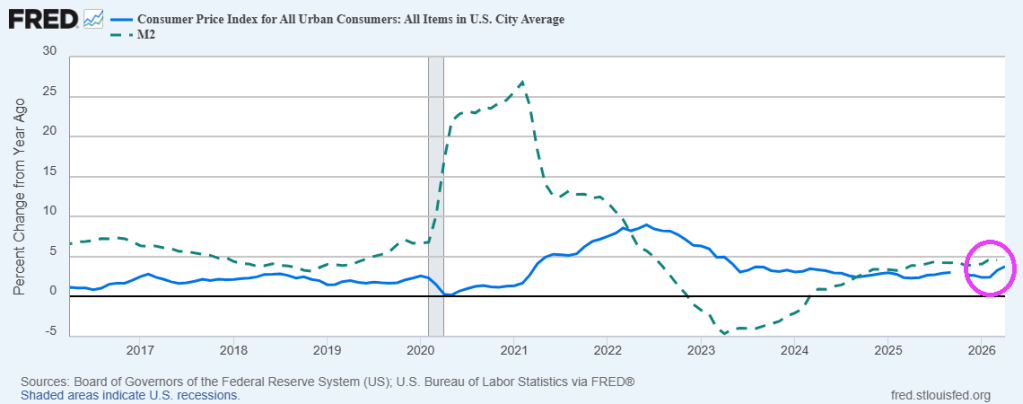
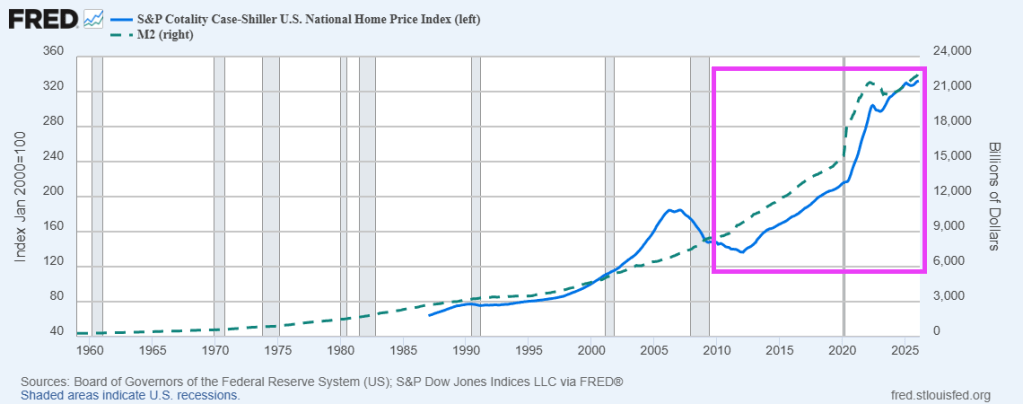
The US Federal Reserve is printing money M2 at a 5.6% YoY pace. Slower than during the Covid outbreak, and slower than the decade prior to Covid.
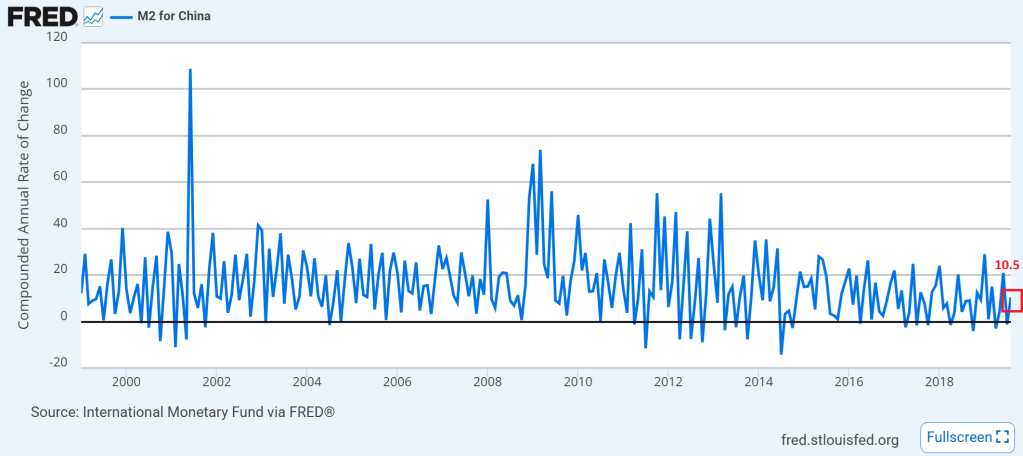
China is printing money at a gutwrenching pace (10.5% YoY as of August 2019). Note that China has historically printed money faster than The Federal Reserve.
Global Central Banks are the Neegans of the global economy.
A typical “starter home” is defined for this analysis as a home in the lowest third of home values in a given region. The count of cities with million-dollar starter homes has grown from 226 cities a year ago, even as affordability pressures have begun to ease in parts of the country.
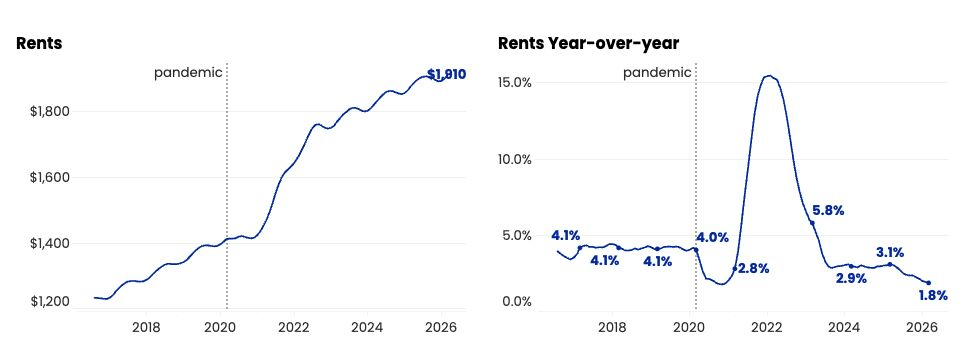
The effects of the pandemic housing boom have proven durable. A housing shortage, a decade in the making, ran headlong into intense demand amid historic lows in mortgage rates, driving up home values at a record pace. While plenty of markets are still feeling the pinch of this price reset, conditions are slowly becoming friendlier for buyers: The typical home buyer now breaks even relative to renting after roughly six years, down from more than eight years in late 2023.
“The pandemic reset the cost of buying a home, spreading million-dollar starter homes from a handful of coastal states to more than two dozen states across the country,” said Kara Ng, senior economist at Zillow. “But while it may feel like a market of beer tastes at champagne budgets, those million-dollar starter homes are still the exception. More inventory, slower price growth and a narrowing rent-versus-buy gap mean buyers who are financially prepared are generally in better shape than in recent years.”
New York and New Jersey are the fastest-growing states on the list, adding 15 cities combined in the past year. New York’s total has reached 41 — up from just 12 before the pandemic — while New Jersey’s has grown to 26, up from only one. The pattern mirrors what Zillow found in its 2026 hottest markets analysis: Six of the 10 most competitive housing markets in the country are in the Northeast, where new construction has lagged and inventory deficits run deep.
“Million-dollar starter homes are popping up in more Northeast cities because the housing shortage there hasn’t been solved,” said Ng. “Sun Belt markets have responded with new supply and seen price growth moderate as a result. The Northeast hasn’t had that relief. Eliminating barriers to building like restrictive zoning is the most direct path to improvement, which is something Zillow is actively advocating for across the country.”
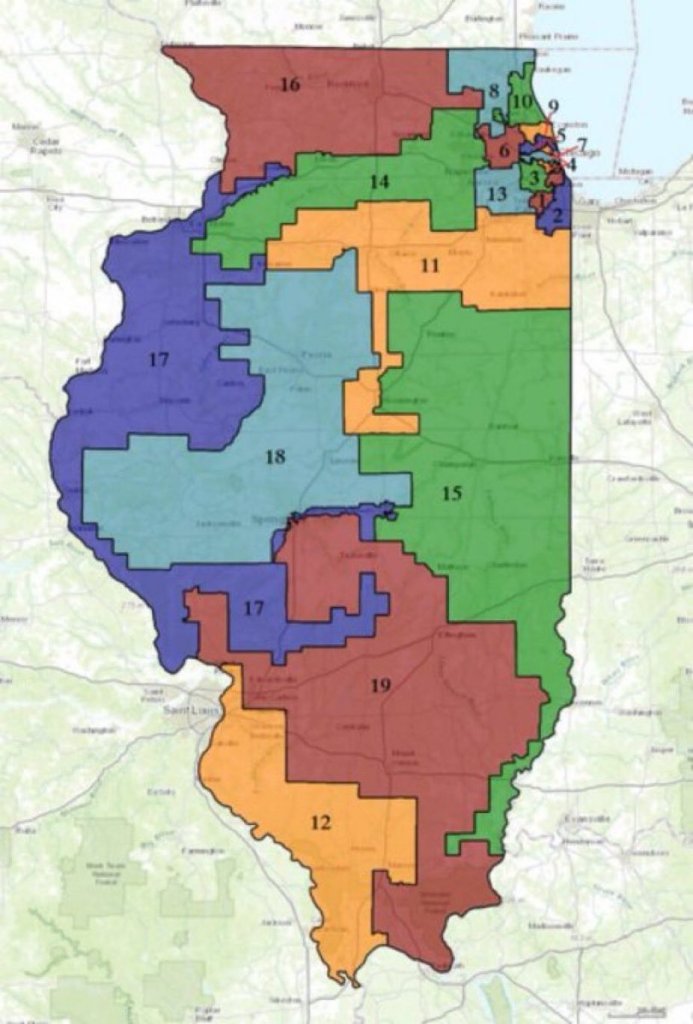
California still leads overall with 105 cities, and 26 states now have at least one city with million-dollar starter homes, up from nine before the pandemic. Before 2020, this list was made up almost entirely of coastal states; Colorado was the only interior state with a million-dollar starter home city. Now, Texas, Wyoming and Illinois, among others, have multiple such cities.
The New York City metro area, which includes parts of New Jersey and Pennsylvania, leads all metro areas with 63 cities where a typical starter home costs $1 million or more. The San Francisco metro follows with 37, then Los Angeles (33), San Jose (13), Miami (8) and Seattle (8).
For buyers navigating today’s market, Zillow Home Loans’ BuyAbility℠ tool provides a personalized, real-time estimate of the home price and monthly payment that fit within their budget. Home listings on Zillow also include a down payment assistance module to help shoppers identify local programs that may be available to them.
For those who decide renting is the right call, Zillow Rentals® lists options across every price point and property type — including single-family homes, apartments and individual room listings. Renters can also use CreditClimb to report on-time rent payments to the major credit bureaus, building the credit history that will put them in a stronger position when they’re ready to buy.
Of course, builders are reluctant to build starter homes since the profit margin on starter homes is lower than on premium homes.
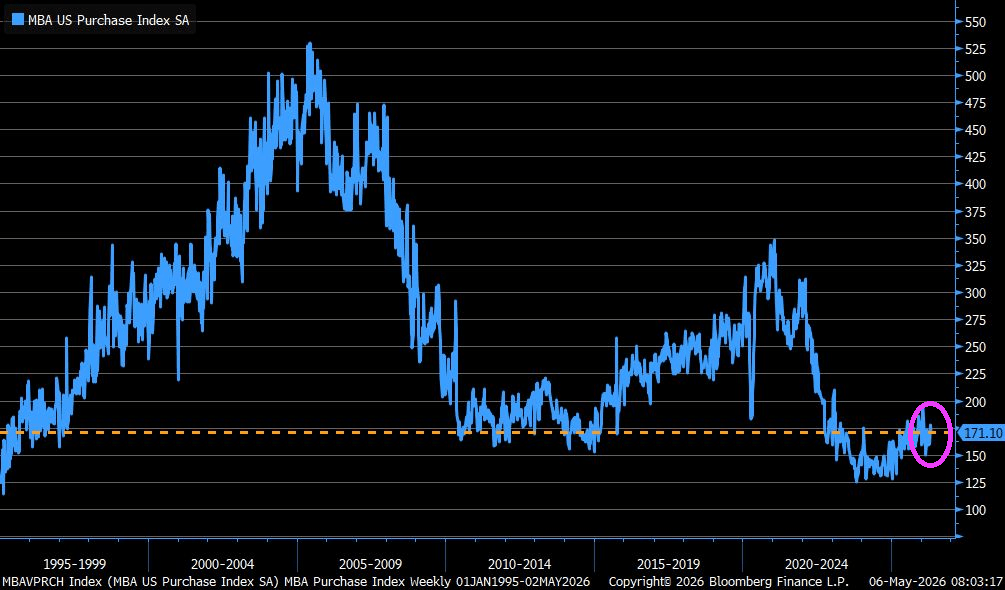
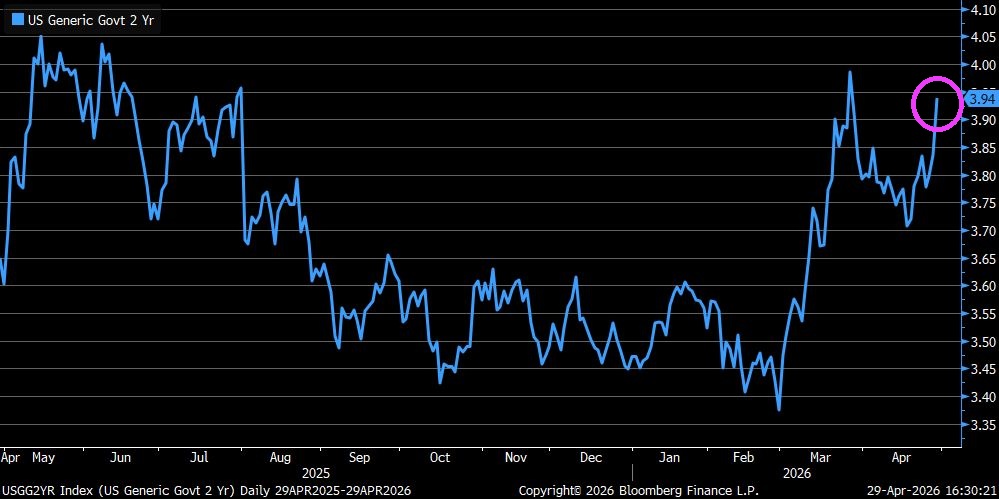
MBA Mortgage Purchase Index down -3.7% over the past week after climbing +1.2% in prior week…30y mortgage rate rose to +6.45% up from +6.37% and highest in a month.
With the Federal government playing an outsized role in the housing and mortgage markets, the Federal goverment is like an enormous Mantis Shrimp.
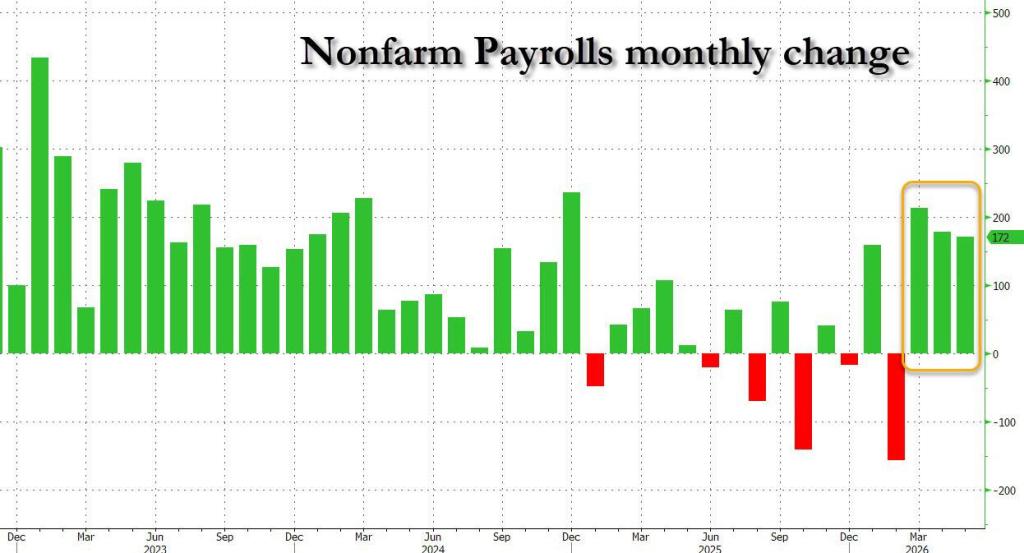
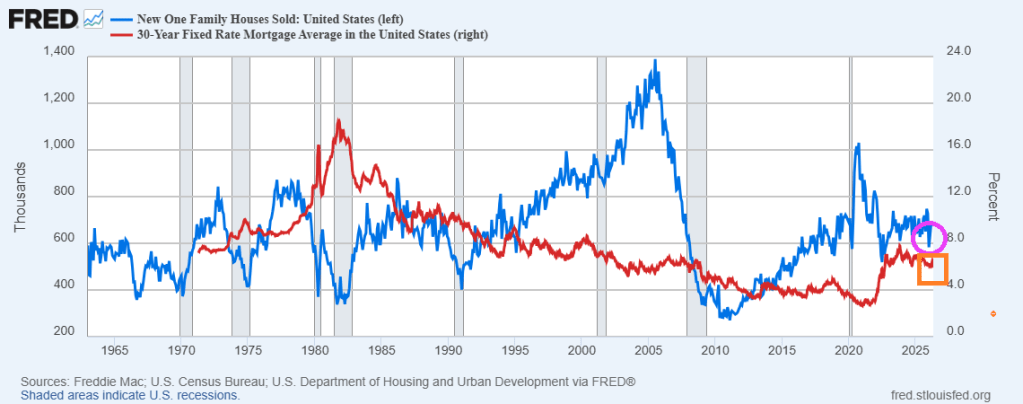
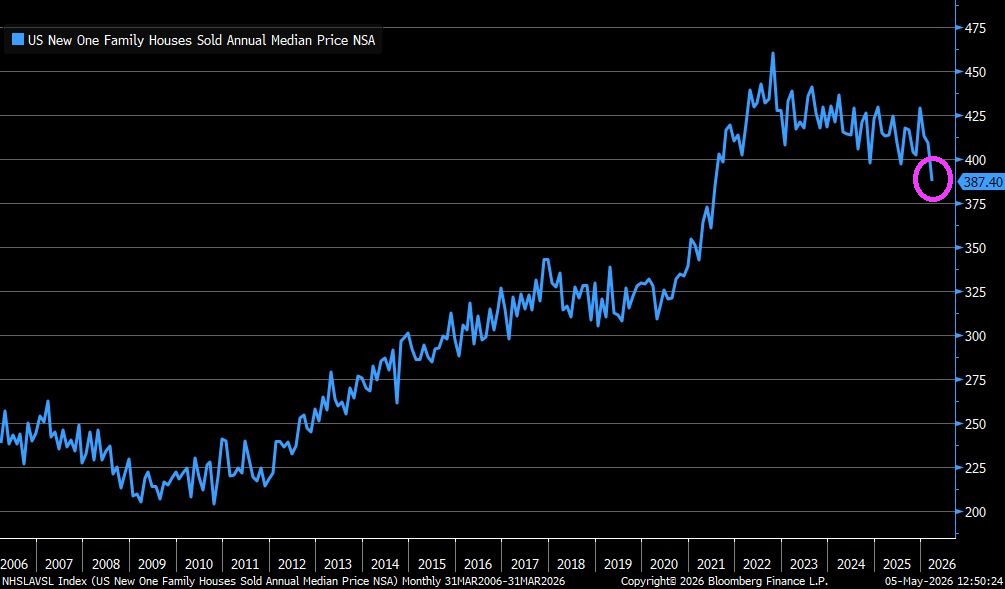
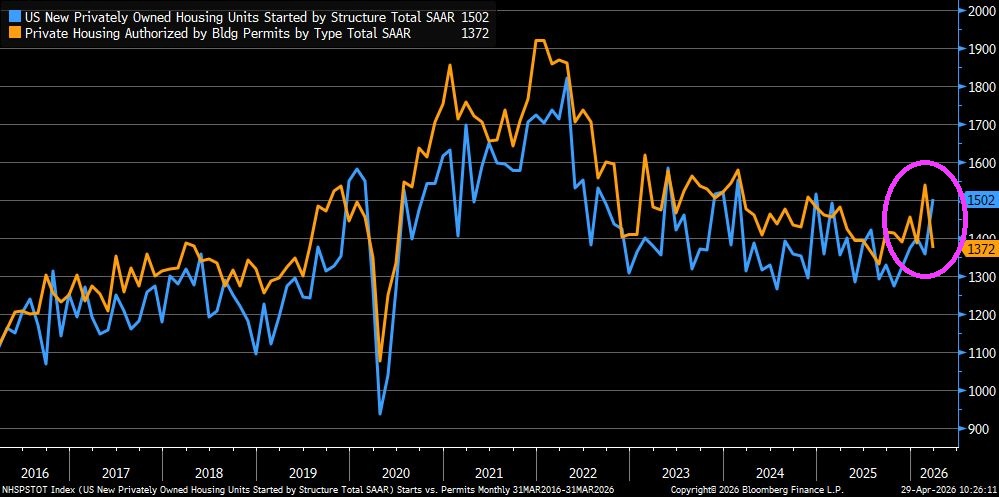
High home prices show signs of cooling, mortgage rates remain fairly constant, while new home sales increase by 47k in March. Despite rising mortgage rates.
The bigger picture? New home sales remain relatively depressed after the Covid outbreak in 2020.
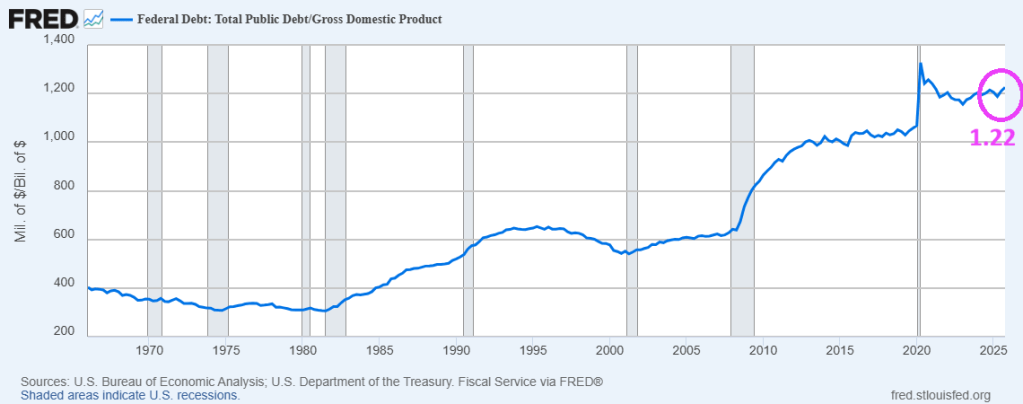
It used to be that a debt-to-GDP (Gross Domestic Product) ratio above 1.0 would be disastrous. Yet, the US Debt-to-GDP ratio rises during and after most recessions. Why? The old Keynesian model called for increased government spending and debt to pull the country out of a recession. But the Keynesian model called for debt to be repaind after the recession ended. But after most recessions, the Federal government keeps spending and borrowing. Following the Covid outbreak of 2020, the US debt-to-GDP ratio exceeded 1.0 and has remained fairly constant since.
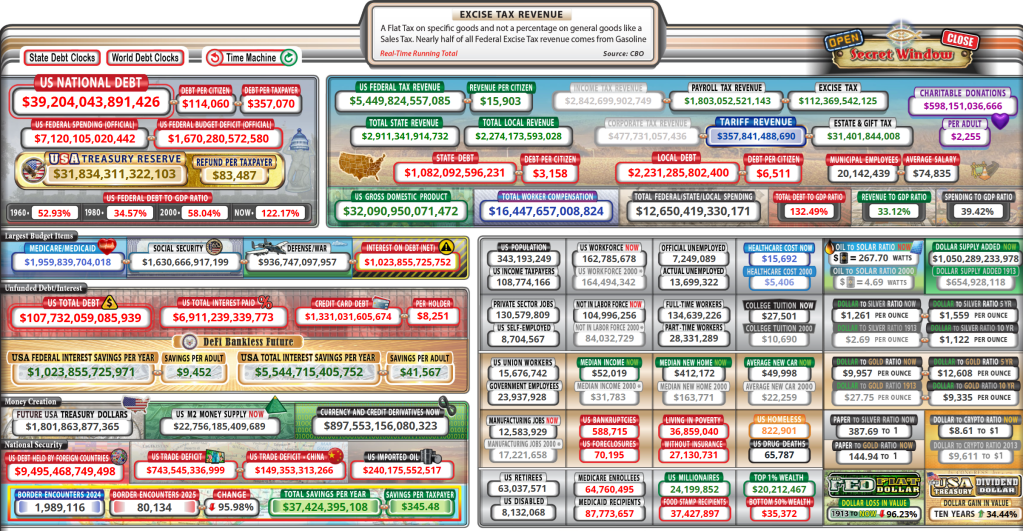
As of today, the US Federal debt load is $39.204 trillion while GDP is $32.090 trillion resulting in a debt-to-GDP ratio of 1.22.
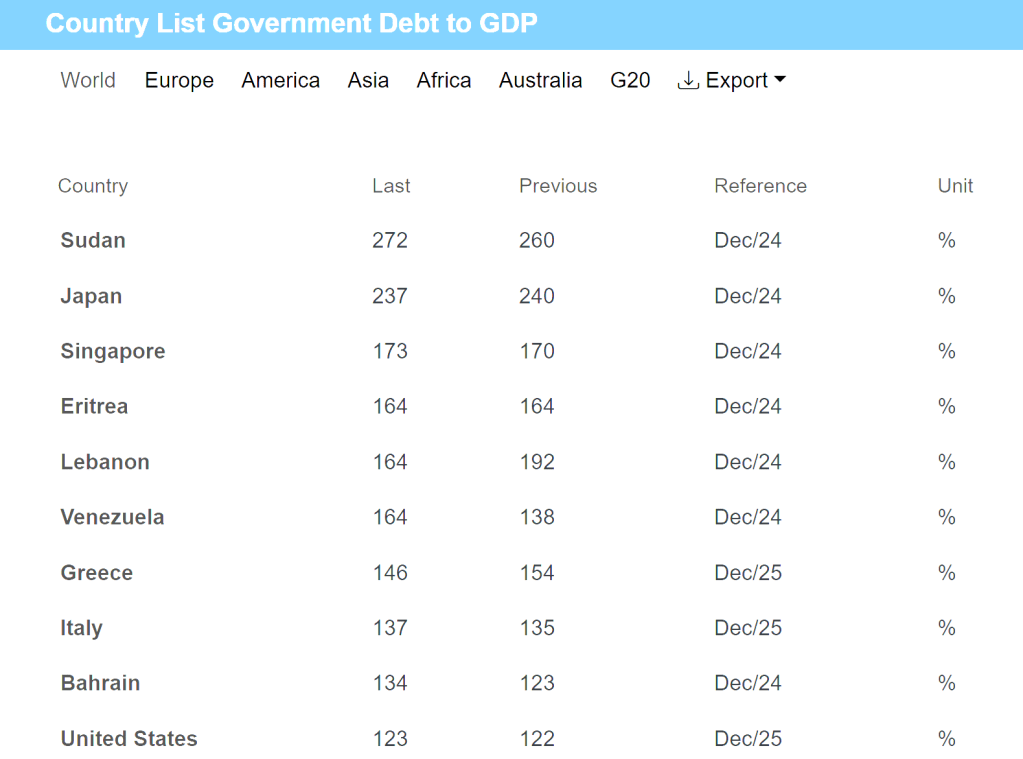
The leader in the debt-to-GDP race is … Sudan! Followed by Japan and Singapore.
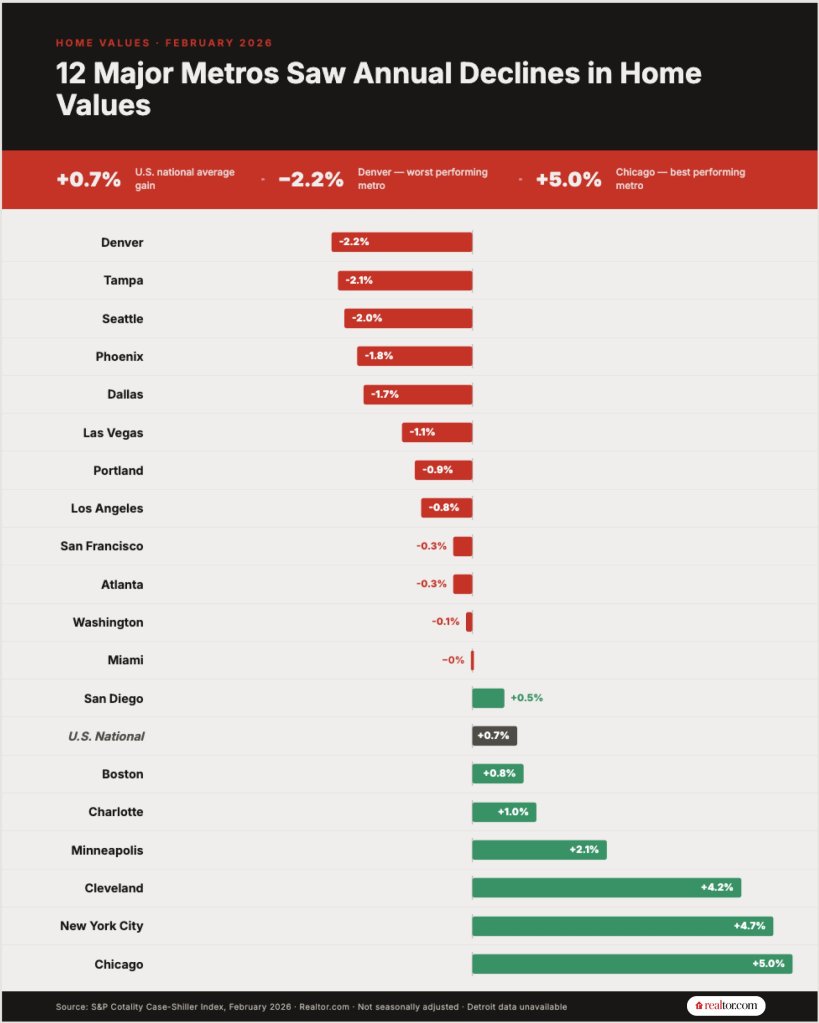
More than half of major U.S. metropolitan areas posted year-over-year home price declines in February, with Denver (-2.2%) displacing Tampa (-2.1%) as the weakest market, according to data from the S&P Cotality Case-Shiller Index released Tuesday.
Los Angeles (-0.8%) and Washington, DC (-0.1%) also joined the list of markets with falling home values, signaling weakness that expanding out of the long-suffering Sunbelt region.
kkk
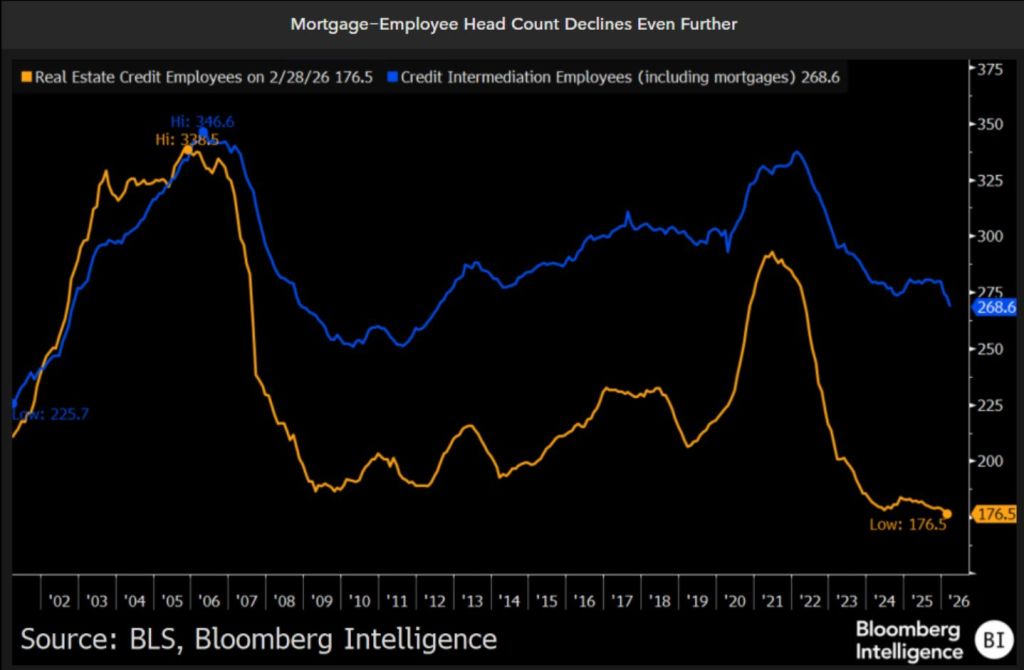
Mortgage employee headcount has fallen to lowest level since the housing bubble and mortgage crisis of 2005-2008.


You must be logged in to post a comment.