Biden is out and so are the crazy job preferences of his administration (e.g., green energy). There is a new sheriff in town (Donald Trump).
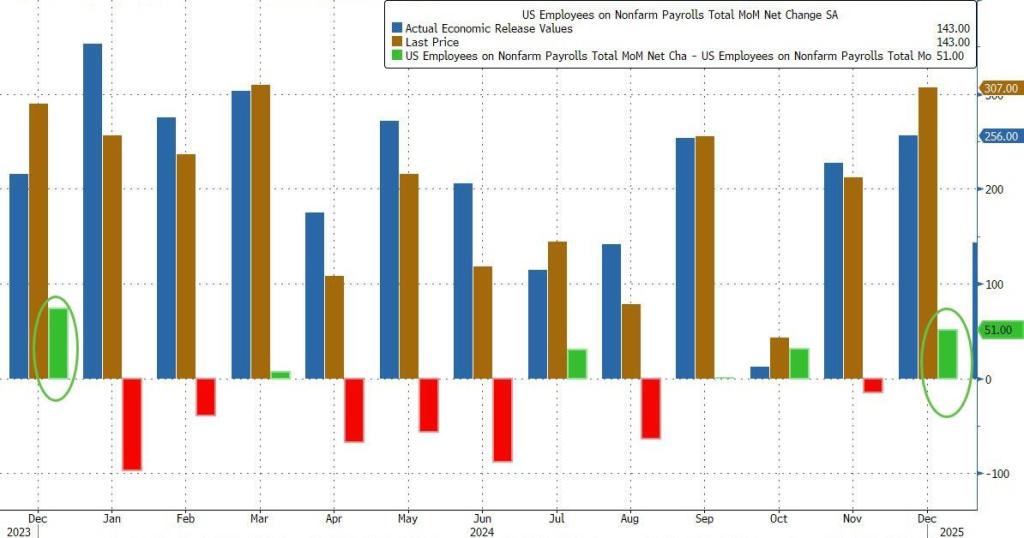
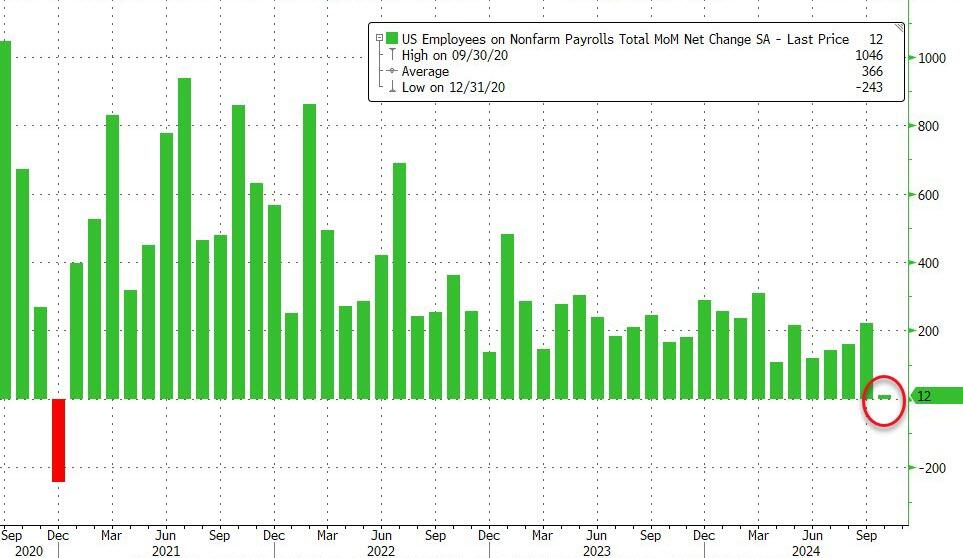
Here’s what the BLS reported in Trump’s first official jobs report since he returned to the White House: total payrolls printed at 143K.
down sharply from an upward revised 307K (256K originally) and missing estimates of 175K.
Looking further back, the change in total nonfarm payroll employment for November was revised up by 49,000, from +212,000 to +261,000, and when adding the +51,000 revision to December employment in November and December combined is 100,000 higher than previously reported
But while the sequential change in the Establishment survey was notable, what was far more remarkable was the Household survey where we saw massive population related revisions (discussed last night), which pushed the civilian labor force higher by 2.2 million to 170.744 million, while the number of employed workers also increased by over 2.2 million to 163.895 million. As a result, the Household survey has finally caught up to Establishment survey.
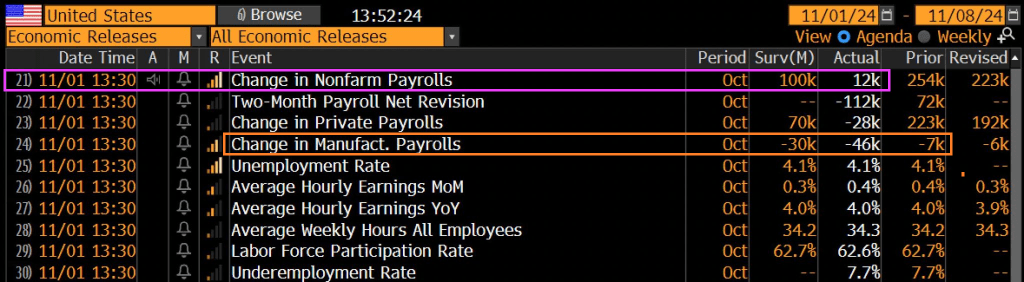
Total jobs including government rose by a measly 12k.
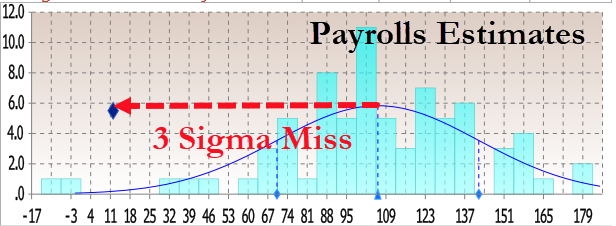
The print was so low it was only above the two lowest estimates (those of Bloomberg Econ for -10K and ABN Amr0 for a 0 print). That means it was a 3 sigma miss to estimates.
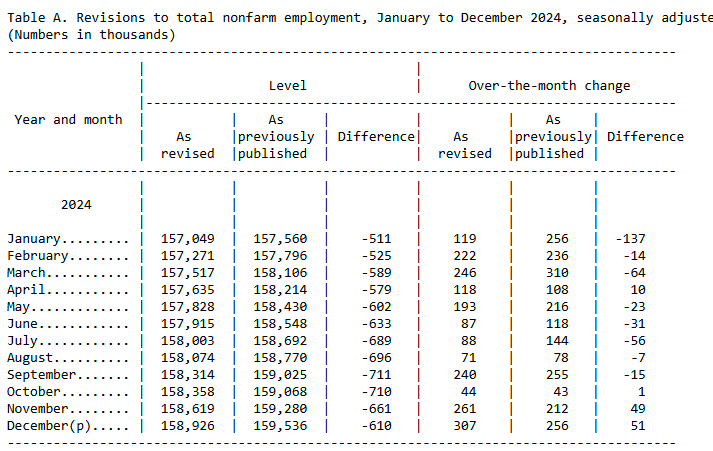
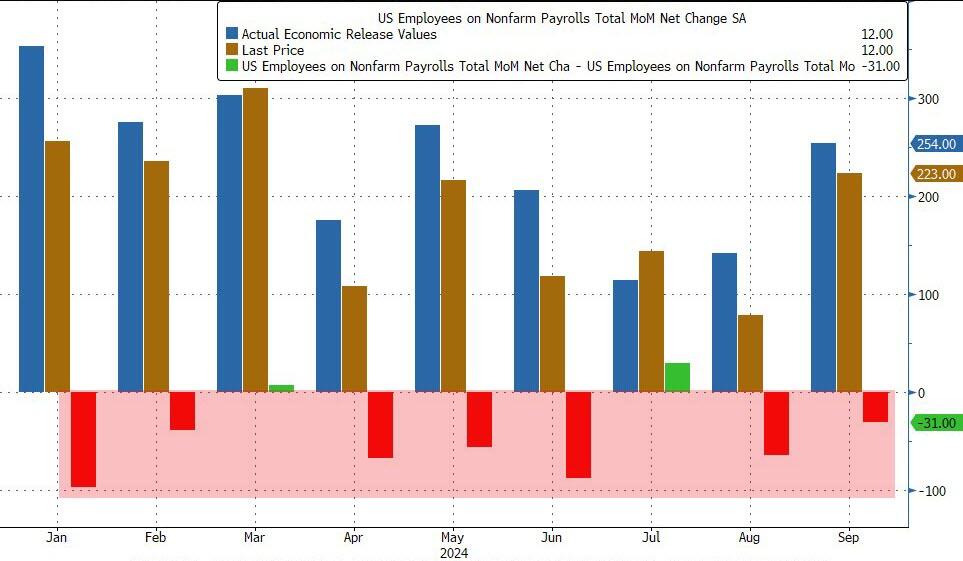
And of course, as has been the case for the entire Biden admin, previous months were revised sharply lower once again: August was revised down by 81,000, from +159,000 to +78,000, and September was revised down by 31,000, from +254,000 to +223,000. With these revisions, employment in August and September combined is 112,000 lower than previously reported. This means that even after the monster September revision when 818K jobs were removed, 7 of the past 9 months were again revised lower!
This means that once the November jobs are released, we can be virtually certain that October will be revised to negative.
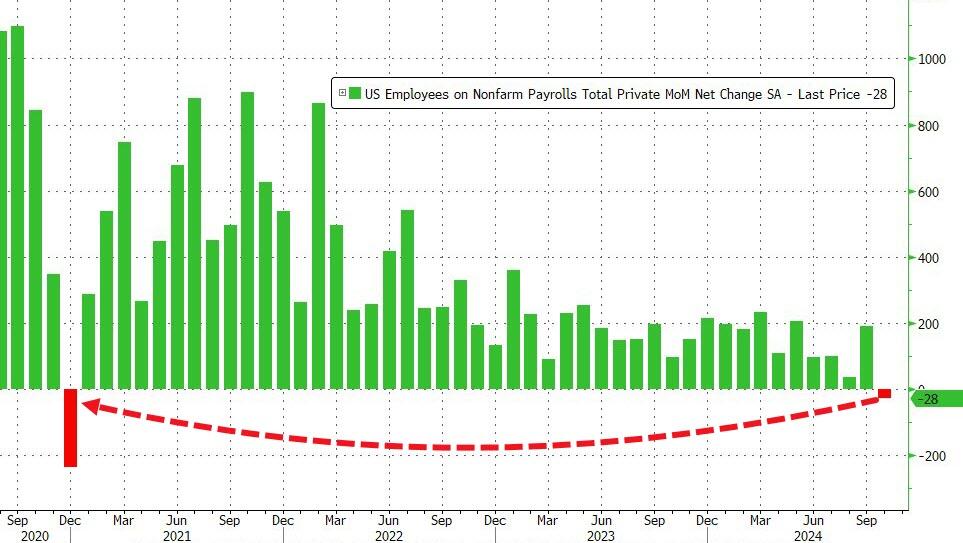
But wait, there’s more because while the total payroll number was just barely positive, if one excludes the 40K government jobs, private payrolls was in fact negative to the tune of -28K, down from 223K pre-revision last month, and the first negative print since December 2020. In other words, we were right… when it comes to actual, non-parasite “government” jobs.
To be sure, a big part of the drop was due to the one-time event discussed, including the Boeing strike and Hurricanes Helene and Milton. This is what the BLS said on the topic: “In October, the household survey was conducted largely according to standard procedures, and response rates were within normal ranges” however, “the initial establishment survey collection rate for October was well below average. However, collection rates were similar in storm-affected areas and unaffected areas. A larger influence on the October collection rate for establishment data was the timing and length of the collection period. This period, which can range from 10 to 16 days, lasted 10 days in October and was completed several days before the end of the month.”
More importantly, the BLS said that “it is likely that payroll employment estimates in some industries were affected by the hurricanes; however, it is not possible to quantify the net effect on the over-the-month change in national employment, hours, or earnings estimates because the establishment survey is not designed to isolate effects from extreme weather events. There was no discernible effect on the national unemployment rate from the household survey.”
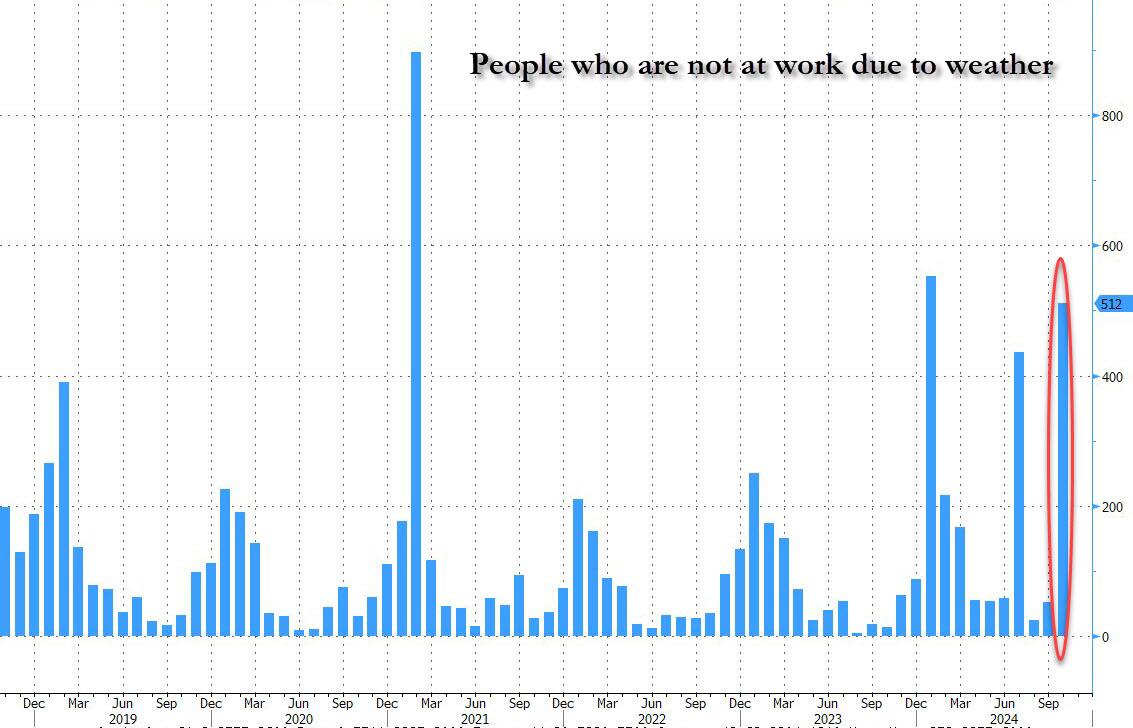
Ironically, while the BLS was unable to “quantify the net effect” from the hurricanes, it was able to calculate that the number of people not at work due to weather surged to the third highest in recent history, up 512K!
In other words, the BLS now has an excuse to blame the plunge on, it just doesn’t know how to quantify it. Translation: if Trump is president next month, expect the downtrend to continue with little to no mention of hurricane as the BLS prepares to admit the true state of the labor market; if however Kamala wins, the November jobs will magically rebound (even as downward revisions accelerate) and all shall be back to fake normal.
Oh, and of course, today’s catastrophic jobs print gives the Fed a full carte blanche to again cut 25bps next week, even if the plunge was all hurricanes…
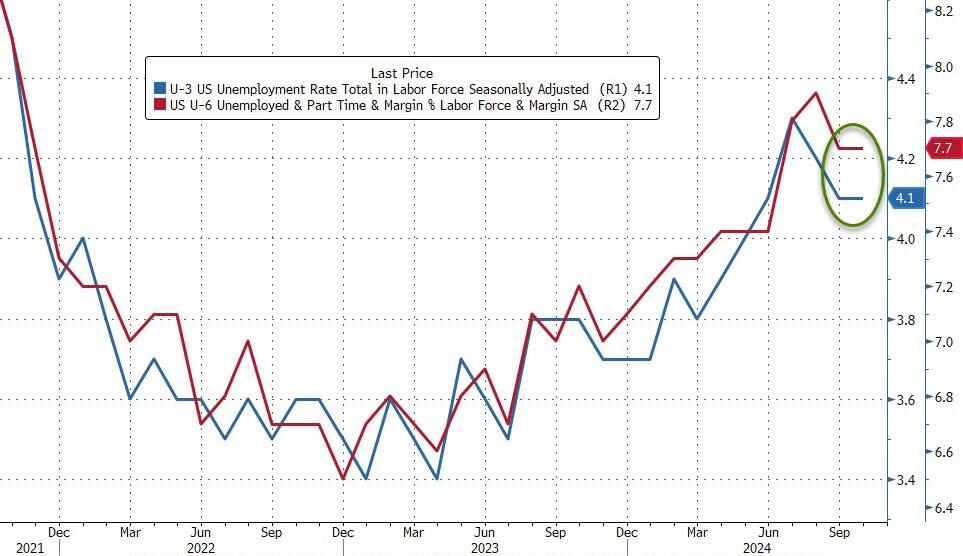
The rest of the jobs report was not that exciting: the unemployment rate printed at 4.1%, unchanged from last month and in line with expectations. The number of unemployed people was little changed at 7.0 million.
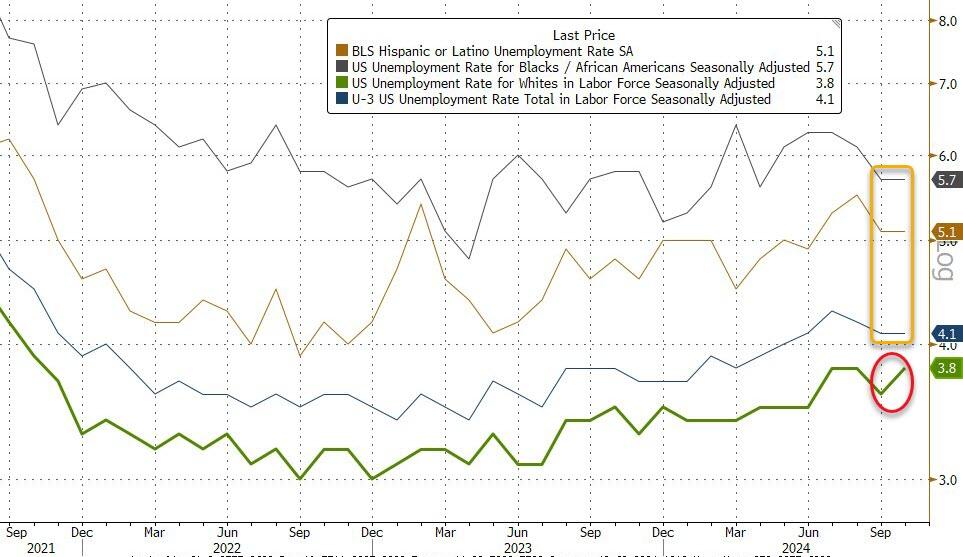
Among the major worker groups, the unemployment rates for adult men (3.9 percent), adult women (3.6 percent), teenagers (13.8 percent), Whites (3.8 percent), Blacks (5.7 percent), Asians (3.9 percent), and Hispanics (5.1 percent) showed little or no change over the month.
It’s worth noting that the unemployment rate actually rose almost 0.1% despite being reported as flat because in September it was 4.05% and in October it was 4.145%, and rose due to a surge in layoffs (+166K) as well as re-entrants (+108K). Additionally, as Southbay research notes, the average duration of unemployment rose from 22.6 weeks to 22.9 weeks
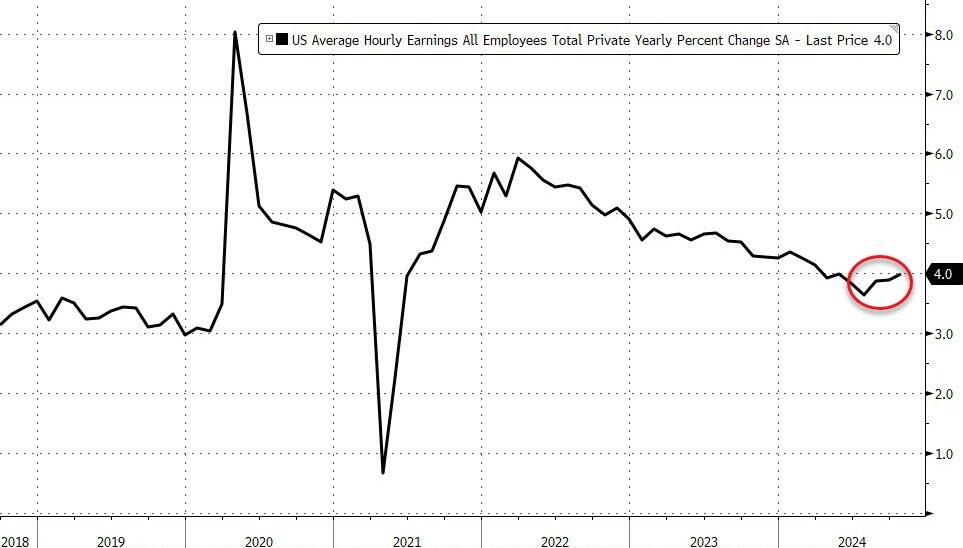
Wage growth came in slightly higher than expected, with average hourly earnings rising 0.4% in October, higher than the 0.3% expected, and up from the downward revised 0.3% in September (was 0.4%). On an annual basis, earnings rose 4.0%, in line with expectations, and above the downward revised 3.9% (was 4.0%).
Some more stats from the latest monthly report:
Among the unemployed, the number of permanent job losers edged up to 1.8 million in October. The number of people on temporary layoff changed little at 846,000.
The number of long-term unemployed (those jobless for 27 weeks or more) was little changed at 1.6 million in October. This measure is up from 1.3 million a year earlier. In October, the long-term unemployed accounted for 22.9 percent of all unemployed people.
Both the labor force participation rate, at 62.6 percent, and the employment-population ratio, at 60.0 percent, changed little in October.
The number of people employed part time for economic reasons was little changed at 4.6 million in October.
The number of people not in the labor force who currently want a job, at 5.7 million, was essentially unchanged in October. These individuals were not counted as unemployed because they were not actively looking for work during the 4 weeks preceding the survey or were unavailable to take a job.
Among those not in the labor force who wanted a job, the number of people marginally attached to the labor force, at 1.6 million, was little changed in October. These individuals wanted and were available for work and had looked for a job sometime in the prior 12 months but had not looked for work in the 4 weeks preceding the survey. The number of discouraged workers, a subset of the marginally attached who believed that no jobs were available for them, changed little at 379,000 in October.
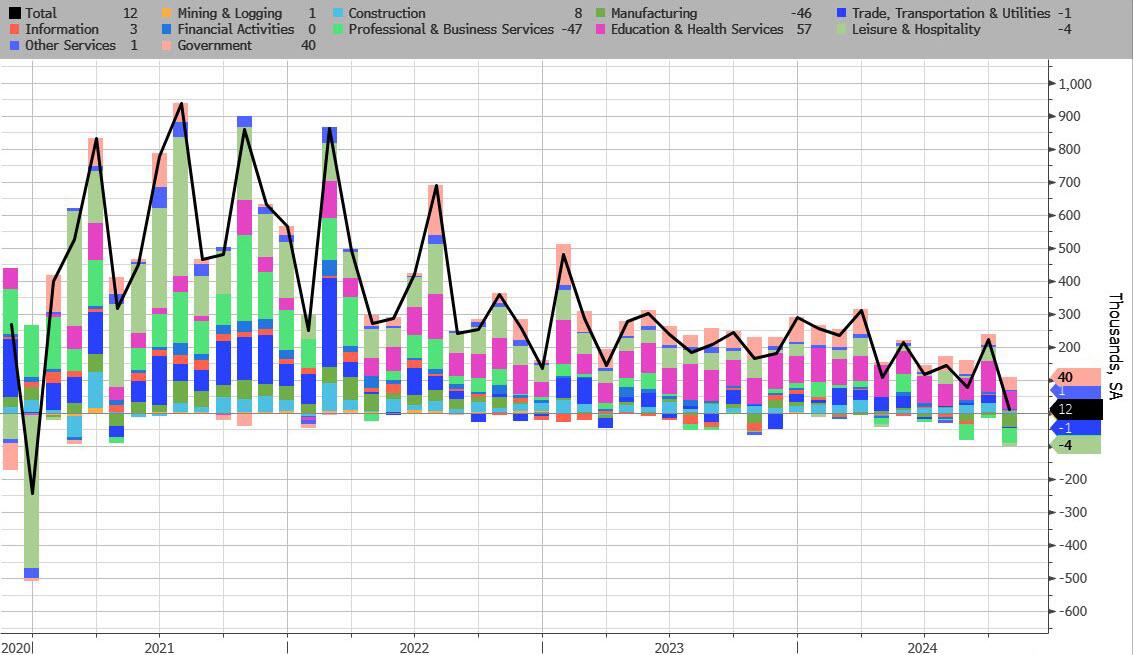
Turning to the establishment survey, we find the following breakdown in jobs:
Health care added 52,000 jobs in October, in line with the average monthly gain of 58,000 over the prior 12 months. Over the month, employment rose in ambulatory health care services (+36,000) and nursing and residential care facilities (+9,000).
Employment in government continued its upward trend in October (+40,000), similar to the average monthly gain of 43,000 over the prior 12 months. Over the month, employment continued to trend up in state government (+18,000).
Within professional and business services, employment in temporary help services declined by 49,000 in October. Temporary help services employment has decreased by 577,000 since reaching a peak in March 2022.
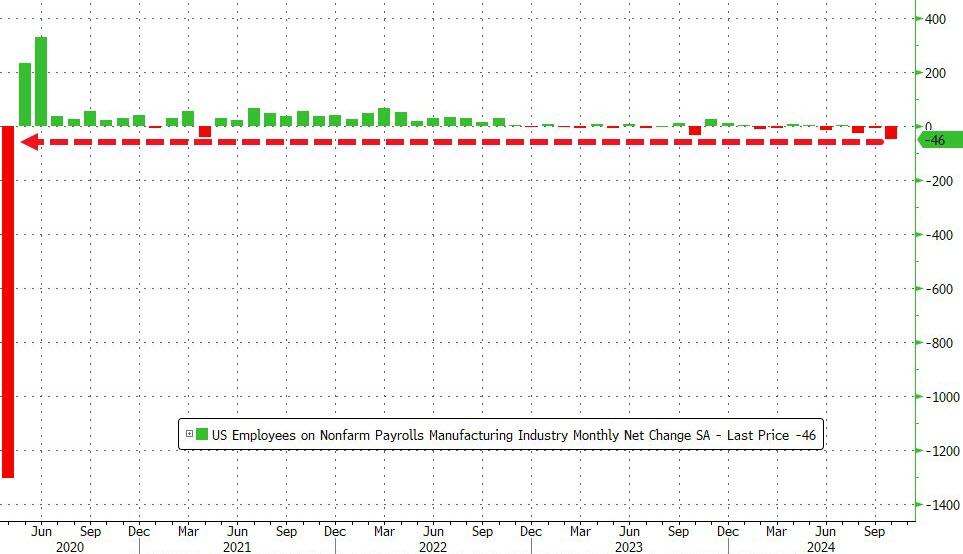
Manufacturing employment decreased by 46,000 in October, reflecting a decline of 44,000 in transportation equipment manufacturing that was largely due to strike activity.
Employment in construction changed little in October (+8,000). The industry had added an average of 20,000 jobs per month over the prior 12 months. Over the month, nonresidential specialty trade contractors added 14,000 jobs.
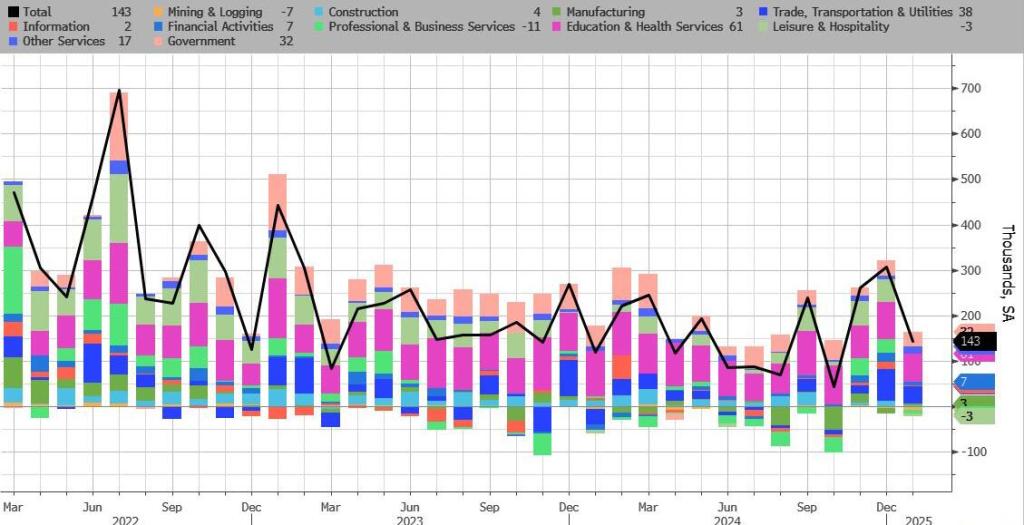
And visually:
Three things stick out here:
First, manufacturing is a disaster, with the US losing manufacturing jobs for 3 months in a row, and 4 of the last 5. Can’t blame that on hurricanes.
Second, the number of construction jobs is becoming absolutely ridiculous, especially when contrasted with the plunge in actual housing starts, completions and last but not least, actual job openings.
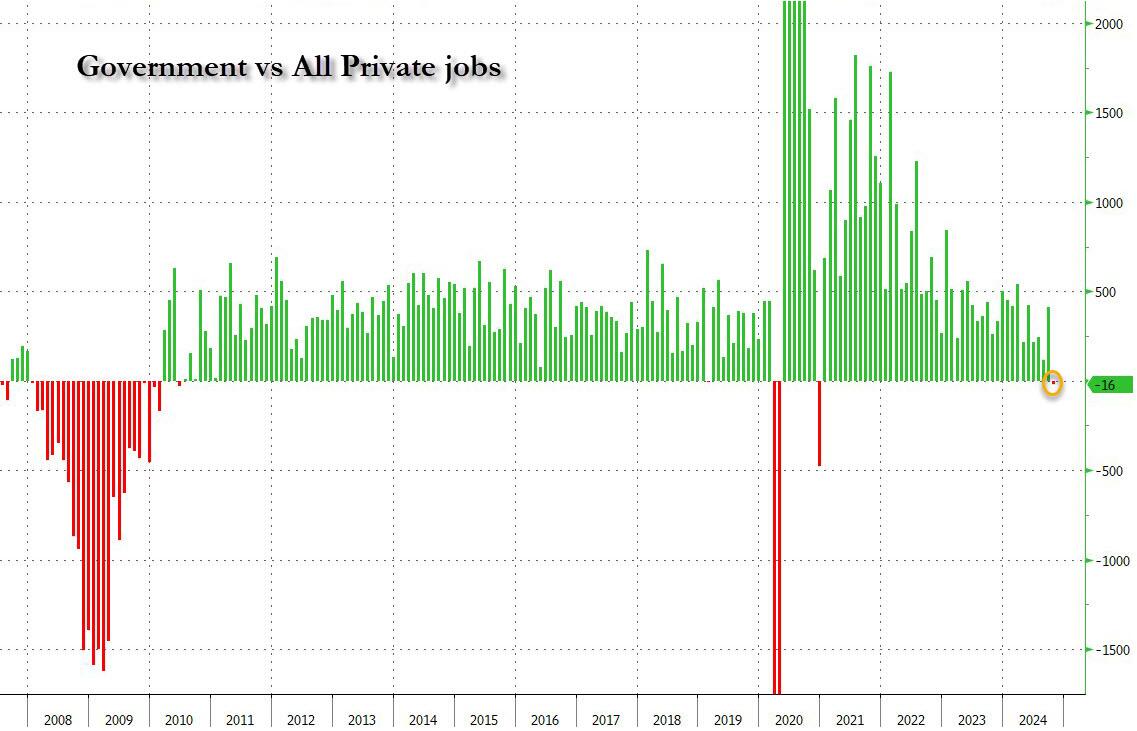
Finally, delta between government jobs and private jobs was a whopping 12K, the biggest since covid. This means that more government jobs were added in October than all private jobs lost in the month! Just in case you needed to know how the Biden admin avoided a negative total headline print.
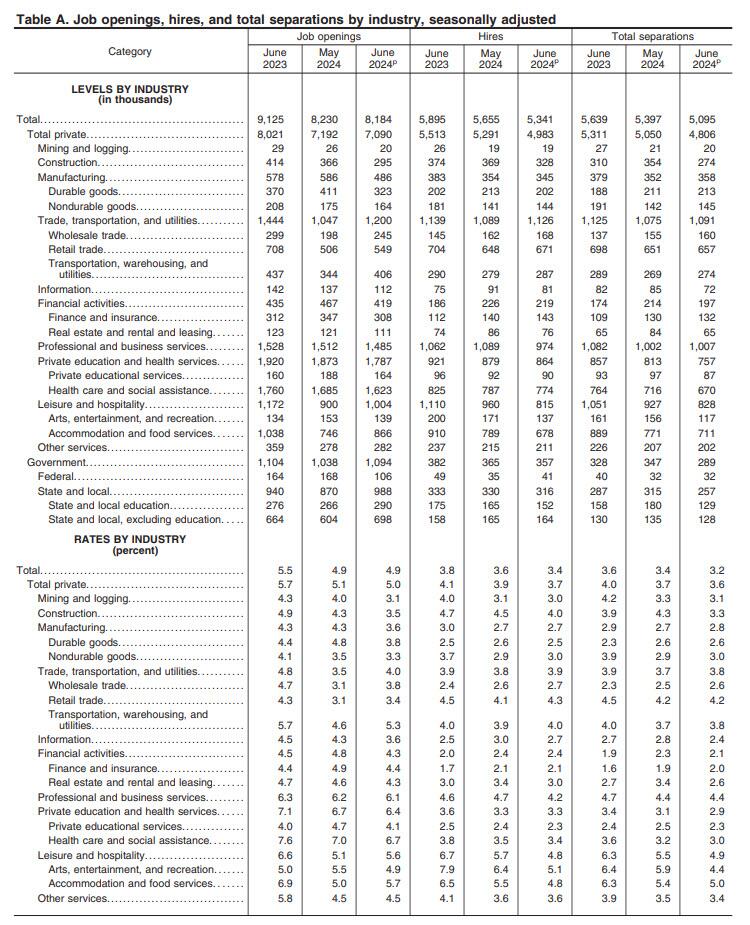
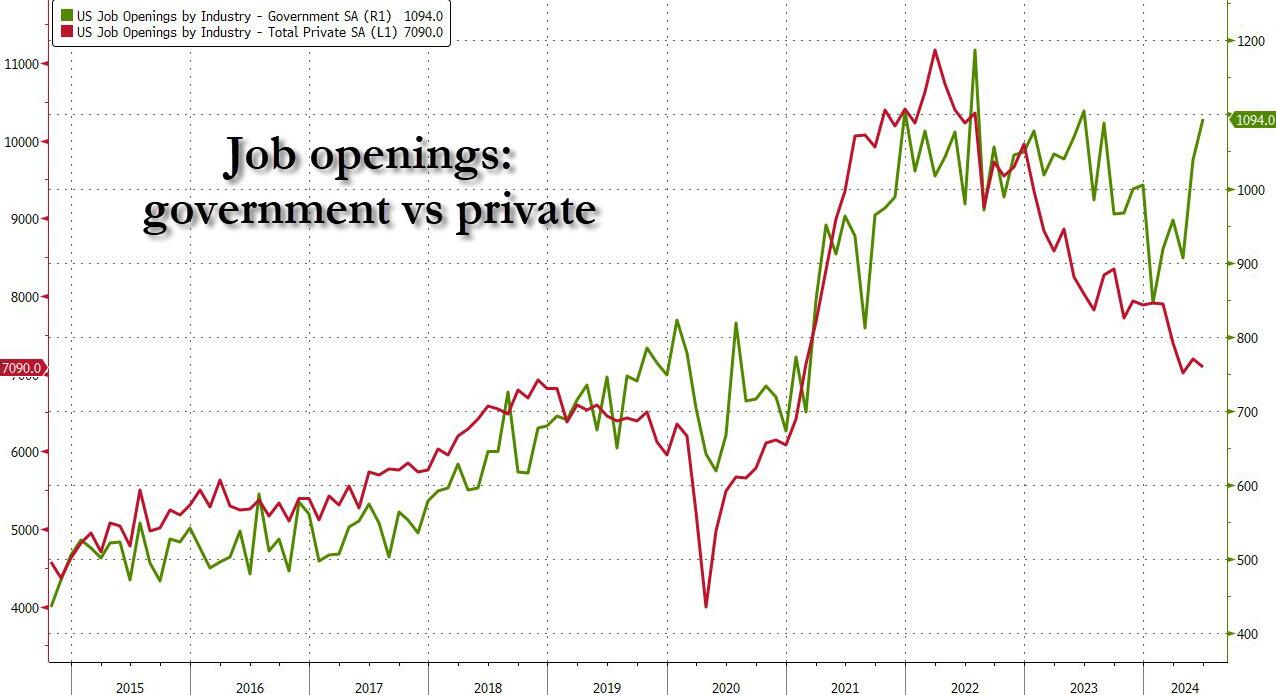
And yet, the same data rigging observed last month took place once again, because a quick look at the breakdown shows that while private jobs saw another broad drop in openings across private sectors…
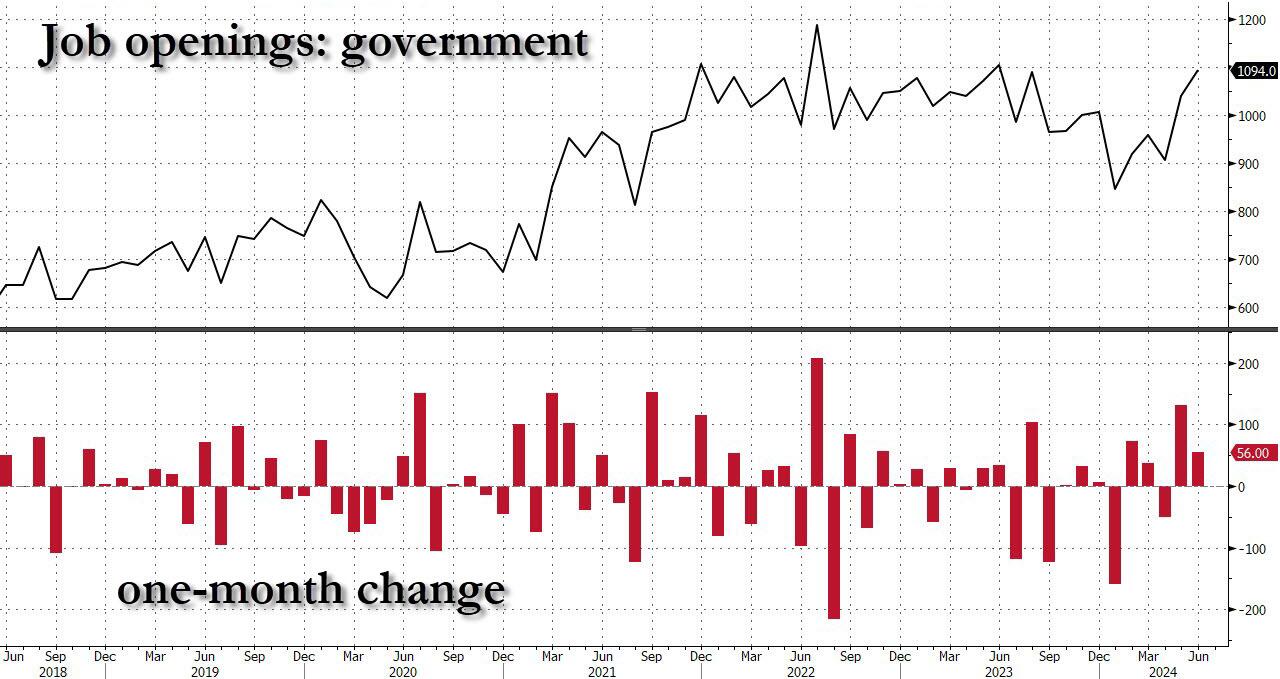
… this was almost fully offset by the relentless surge in government job openings.
Yes, while May was indeed revised lower, June saw another bizarre jump in government job openings, surging to a near record 1.094 million, driven by a 118K spike in State and Local job openings.
Putting it all together, while private sector job openings plunged to a level seen back in late 2018, government job openings are just shy of a record high!
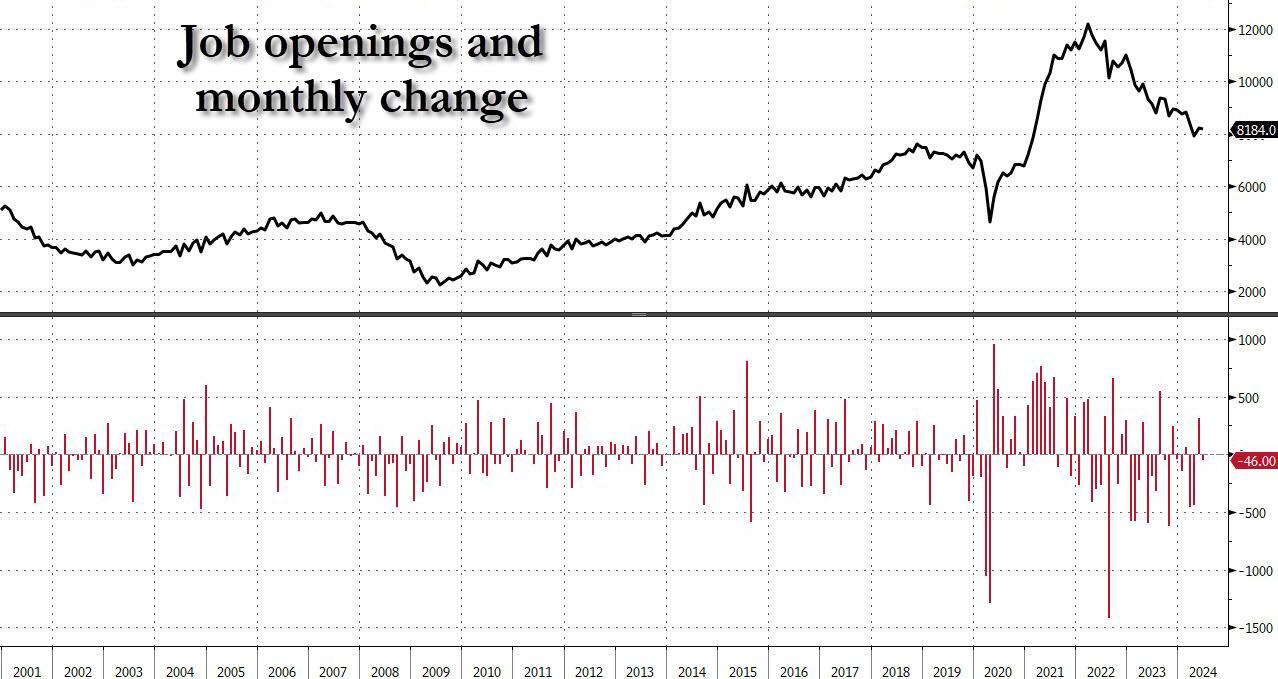
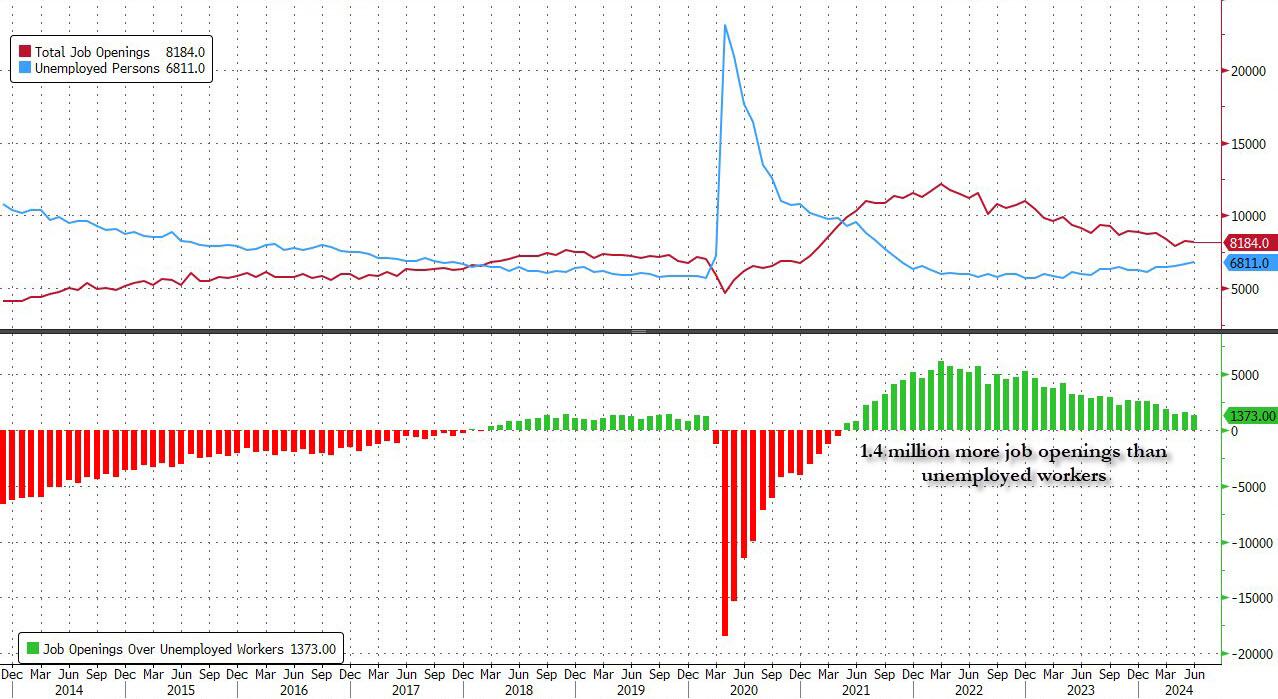
Ignoring the data manipulation, in the context of the broader jobs report, in June the number of job openings was 1.373 million more than the number of unemployed workers (which the BLS reported was 6.811 million), down from last month’s 1.581 million and the lowest since the summer of 2021.
Said otherwise, in April the number of job openings to unemployed dropped to just 1.24, a sharp slide from the March print of 1.30, the lowest level since June 2021 and now officially back to pre-covid levels.
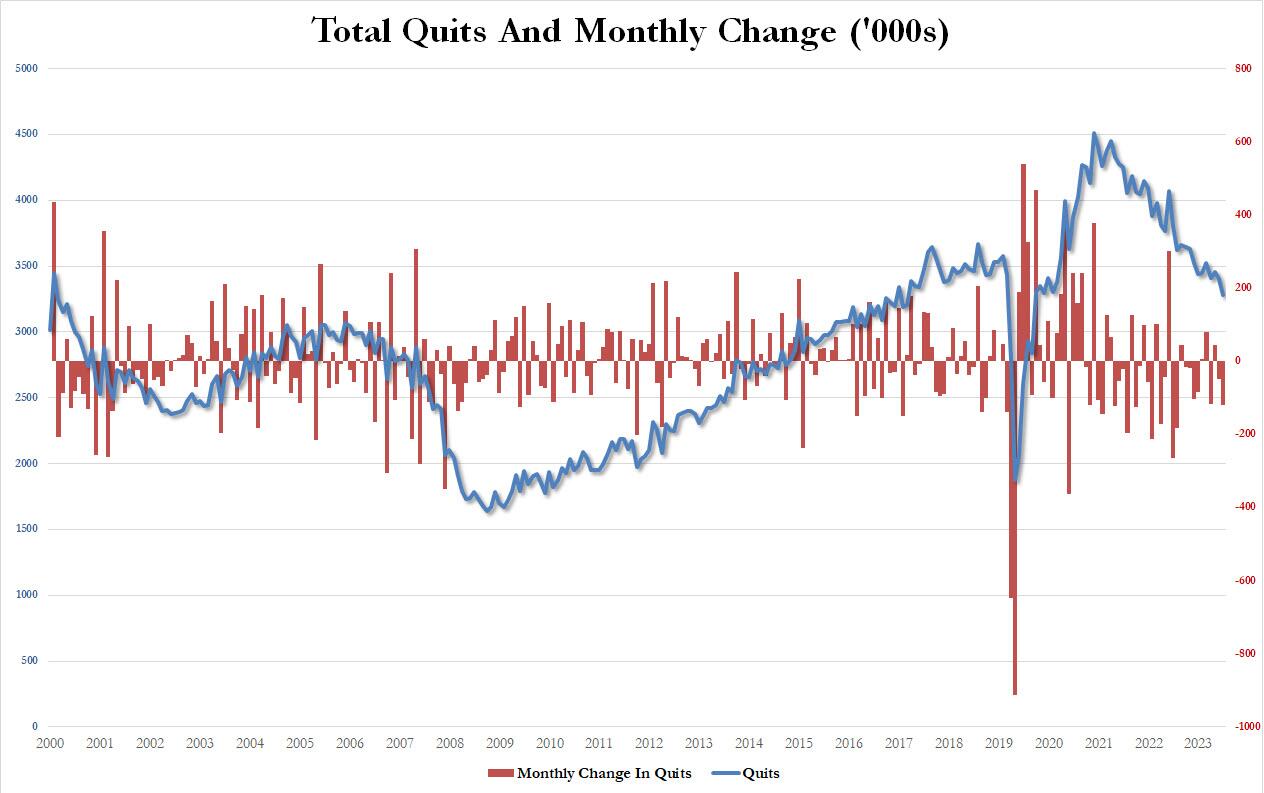
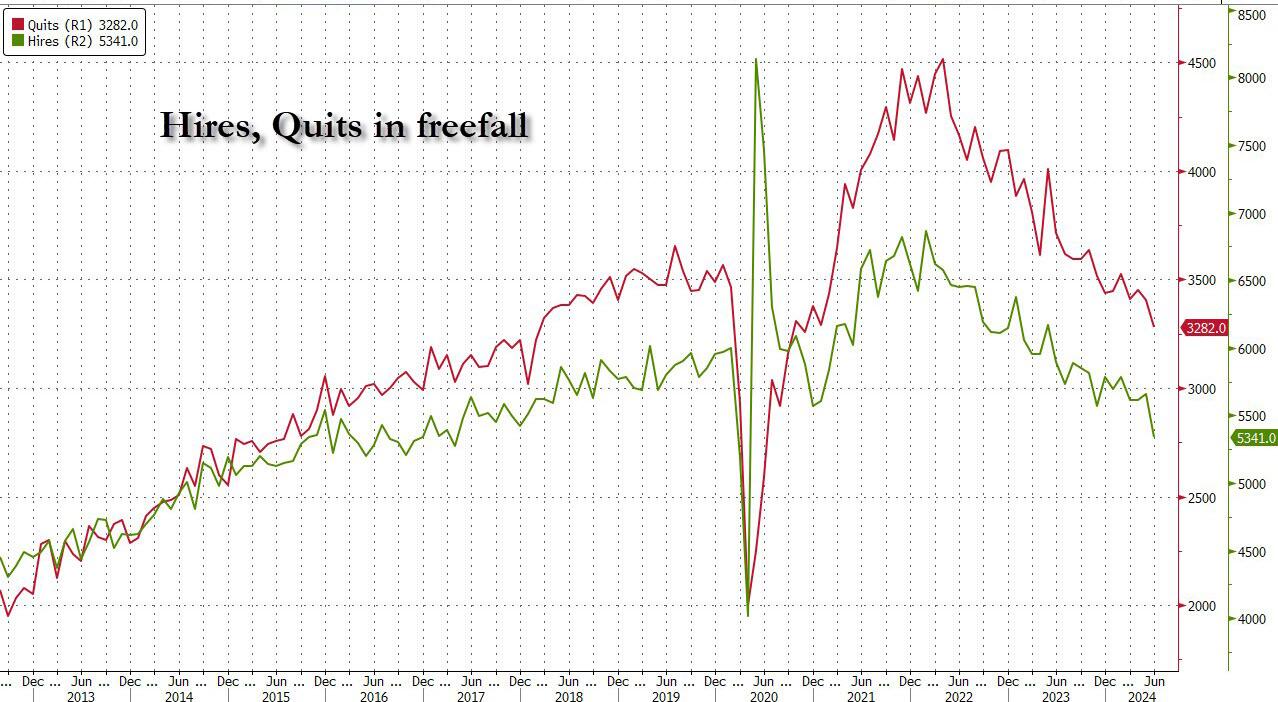
But wait there’s more: confirming that if one ignores the clearly manipulated jump in government job openings (“quick, let’s hire a ton more TSA agents and deep state apparatchiks to make it seems that Kamalanomics is working”), a quick look at the number of quits – an indicator closely associated with labor market strength as it shows workers are confident they can find a better wage elsewhere – showed a plunge in June, dropping by 121K, the most since July 2023, to just 3.282 million, the lowest since August 2020!
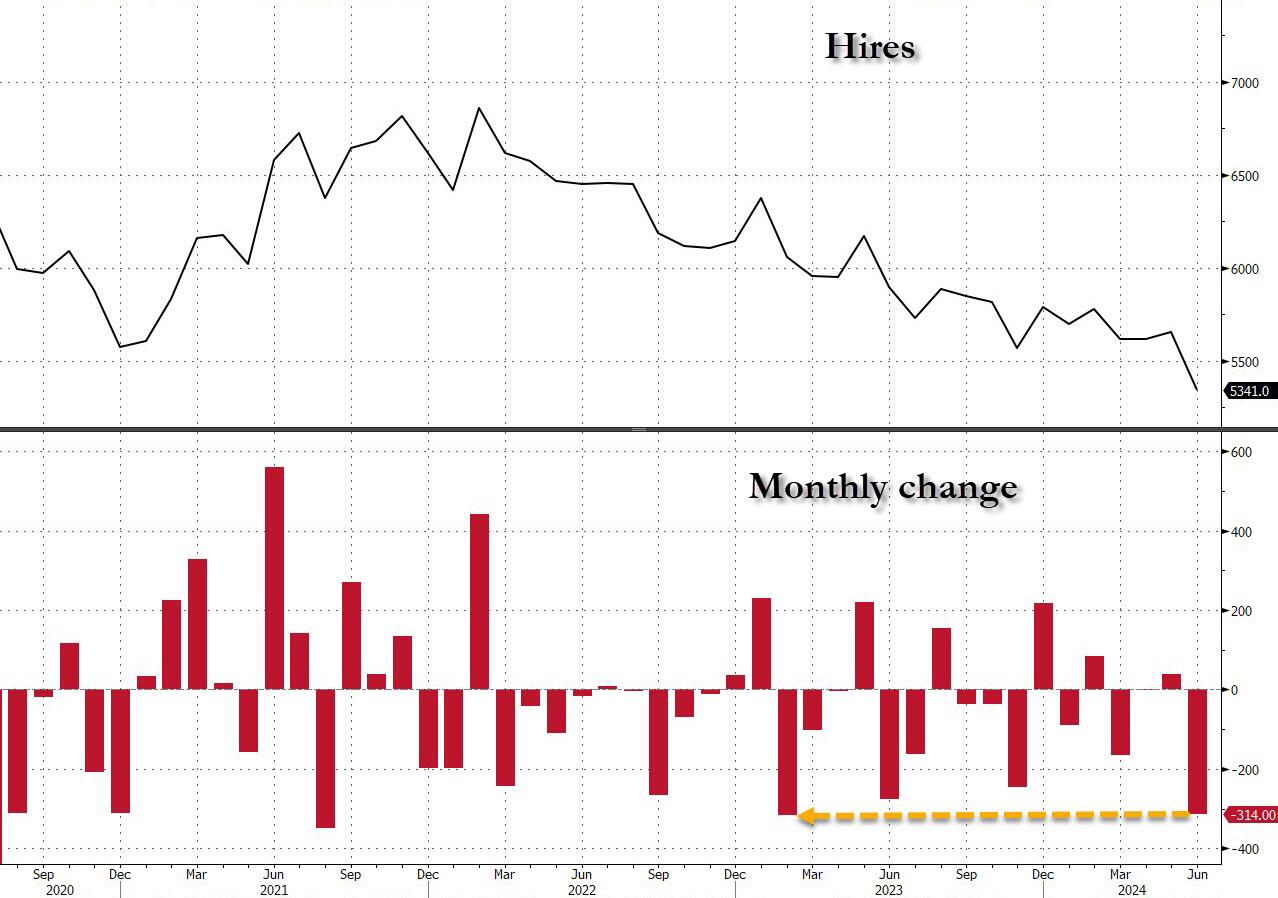
Finally, the piece de resistance was the number of actual hires, which in June also tumbled to just 5341, down a massive 314K in one month, the biggest monthly drop since February 2023…
… dragging the total to just 5.3 million, the lowest level since the depts of the covid lockdowns.
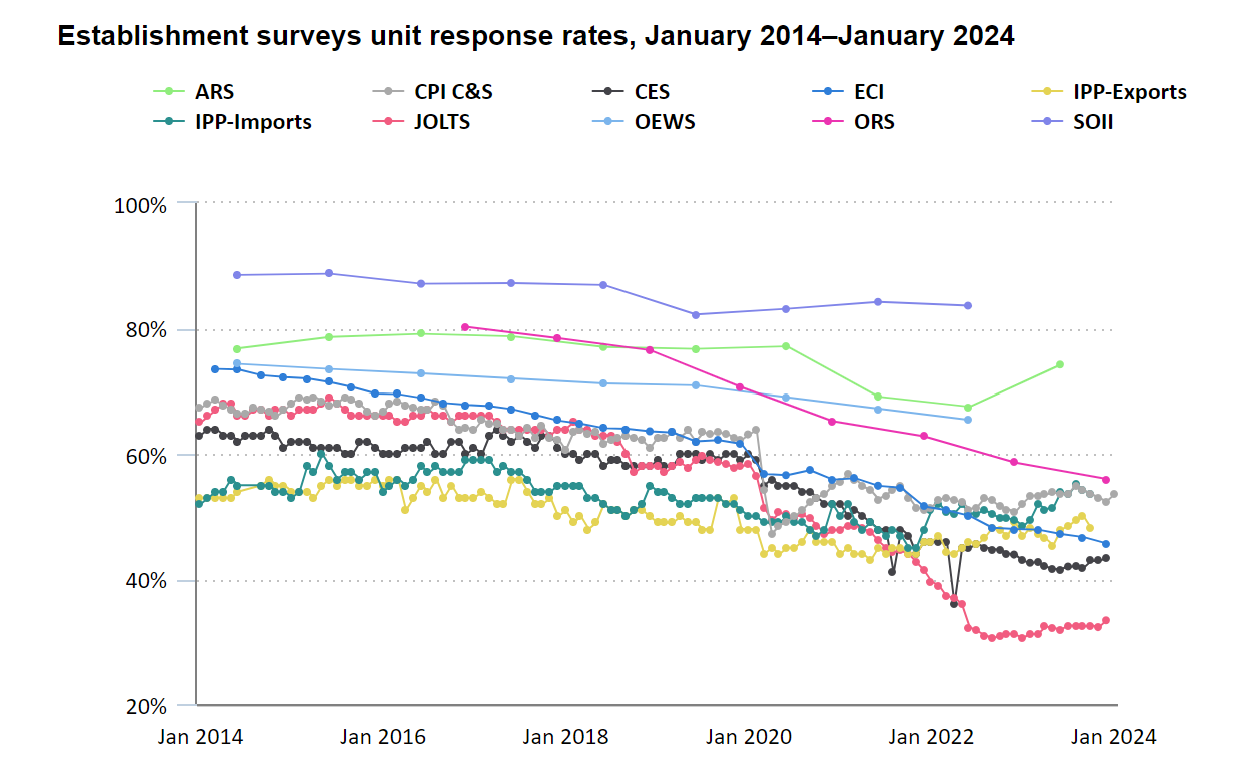
Finally, no matter what the “data” shows, let’s not forget that it is all just estimated, and it is safe to say that the real number of job openings remains still far lower since half of it – or some 70% to be specific – is guesswork. As the BLS itself admits, while the response rate to most of its various labor (and other) surveys has collapsed in recent years, nothing is as bad as the JOLTS report where the actual response rate remains near a record low 33%
In other words, more than two thirds, or 70% of the final number of job openings, is estimated!
And at a time when it is critical for Biden, pardon Kamala, to still maintain the illusion that at least the labor market remains strong when everything else in the economy is crashing and burning, we’ll let readers decide if the near record number of government job openings at a time when hiring and quitting are both crashing, is an accurate reflection of a strong labor market, or is merely a reflection of a debt-funded deep state gone full tilt. We’ll know the answer on Friday.


You must be logged in to post a comment.