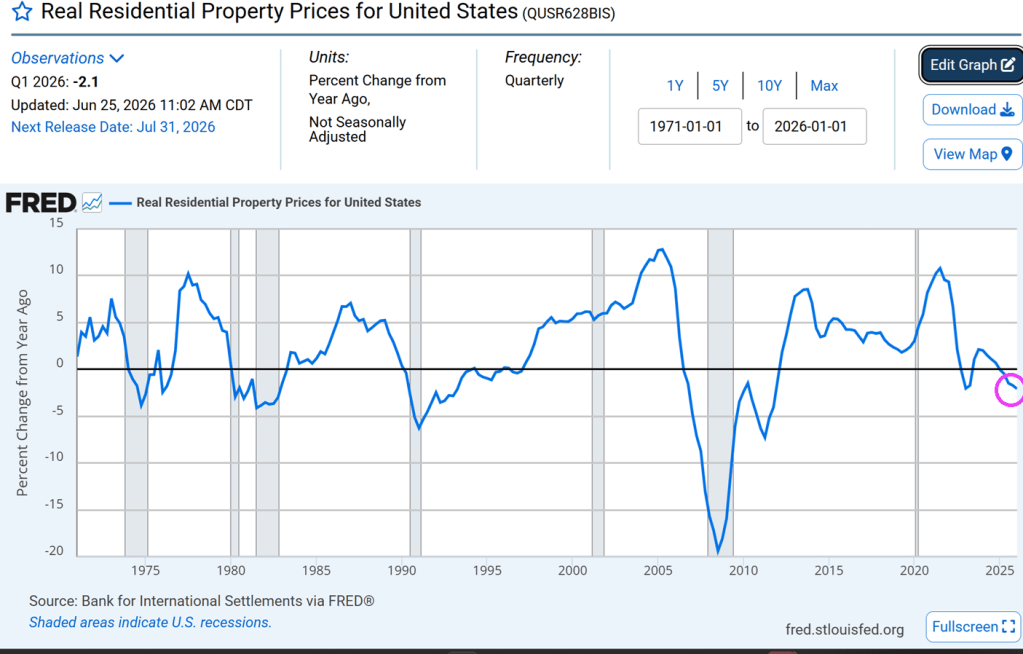
US home prices are clearly unaffordable for younger households, given the dearth of true starter homes. As of Q1 2026, REAL US residential property prices fell -2.1% YoY.
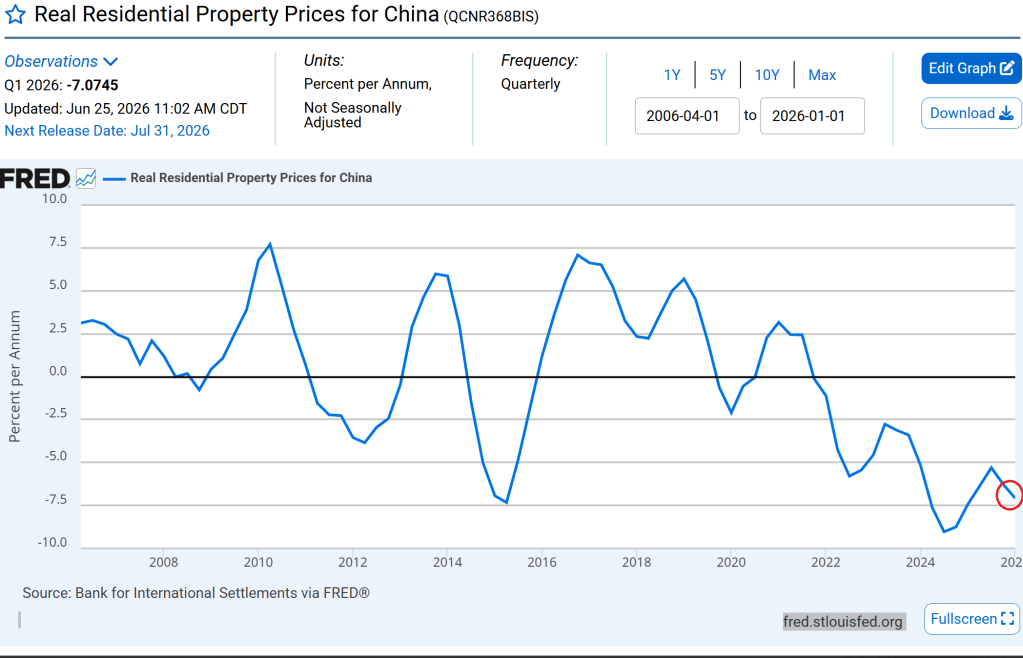
China’s real residential property prices are declining even faster than the US.
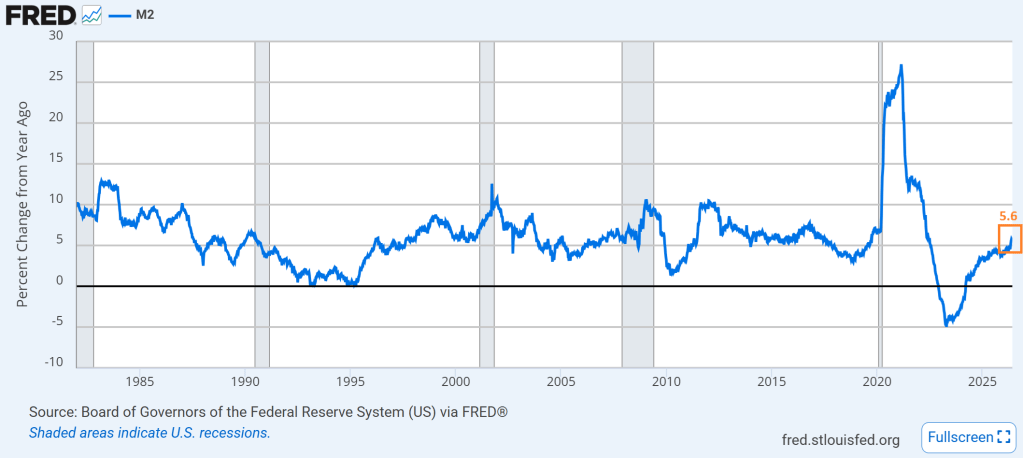
The US Federal Reserve is printing money M2 at a 5.6% YoY pace. Slower than during the Covid outbreak, and slower than the decade prior to Covid.
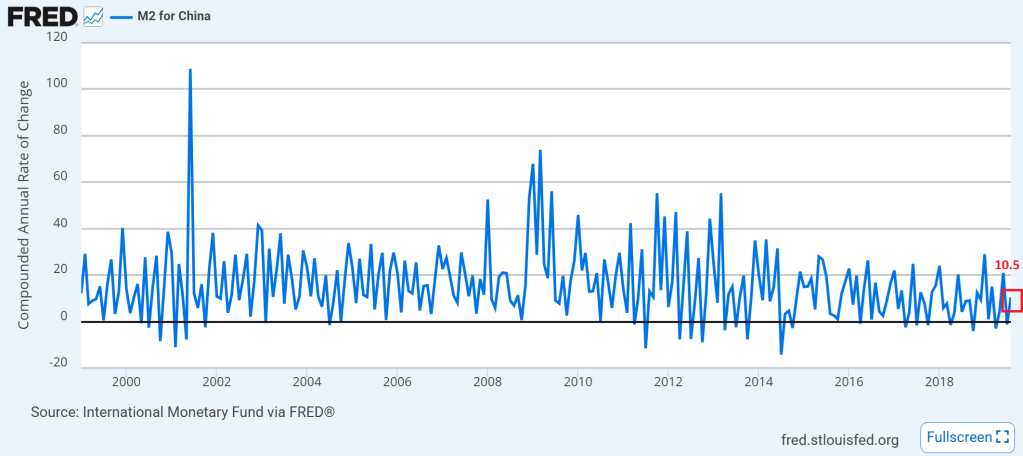
China is printing money at a gutwrenching pace (10.5% YoY as of August 2019). Note that China has historically printed money faster than The Federal Reserve.
Global Central Banks are the Neegans of the global economy.
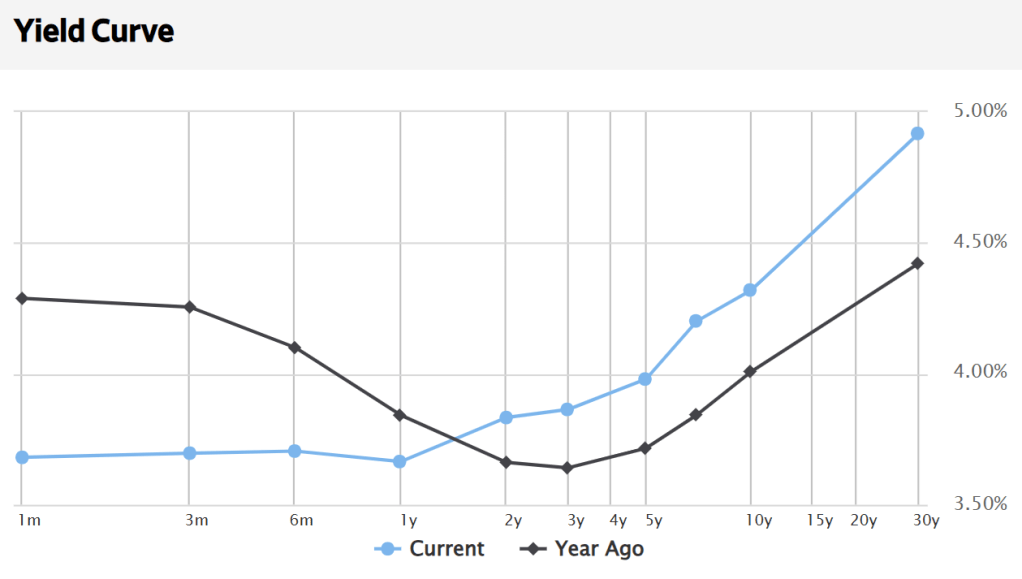
Trump’s threats of bombing Iran back to the stone age continues. But the impact on Treasury yields is interesting. As the US economy continues to grow, the US Treasury curve takes on the familiar upward slope. With rising long rates. Particularly when compared to the negative humped yield curve of a year ago.
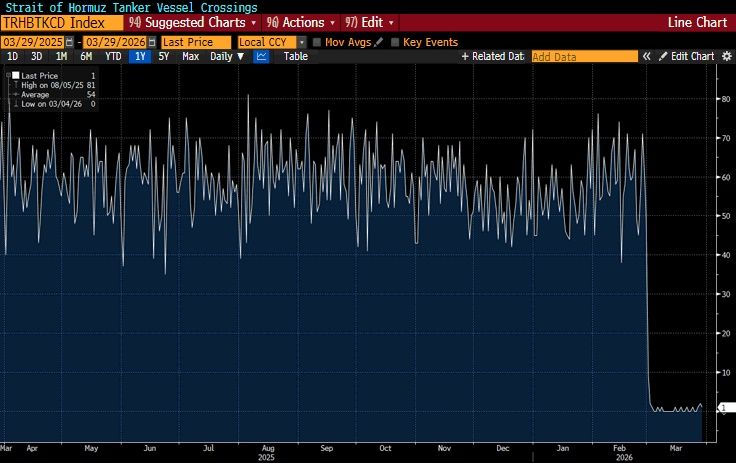
The Strait of Hormuz, a choke point for Middle East crude oil delivery to the rest of the world, has witnessed vessel crossings grinding to a near halt.
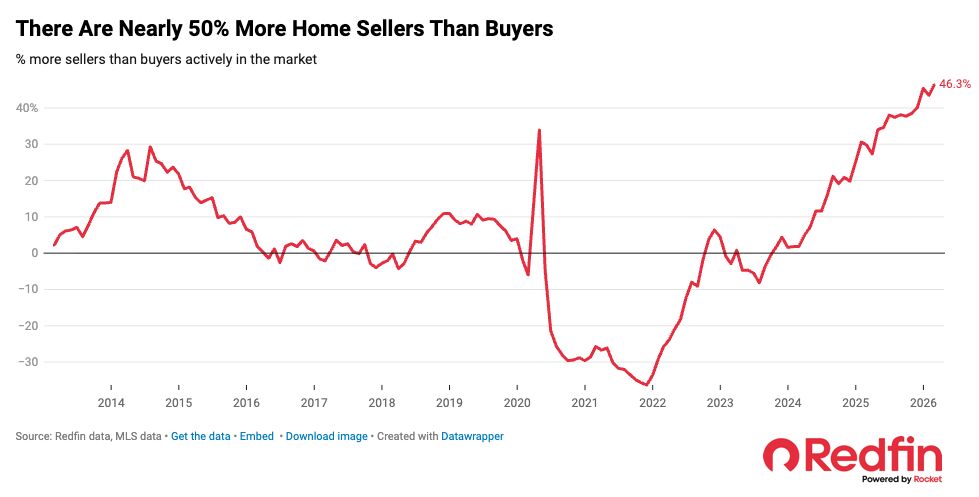
Nothing has been the same in the US housing market since the Covid outbreak of 2020. According to Redfin, there are nearly 50% more home sellers than buyers.
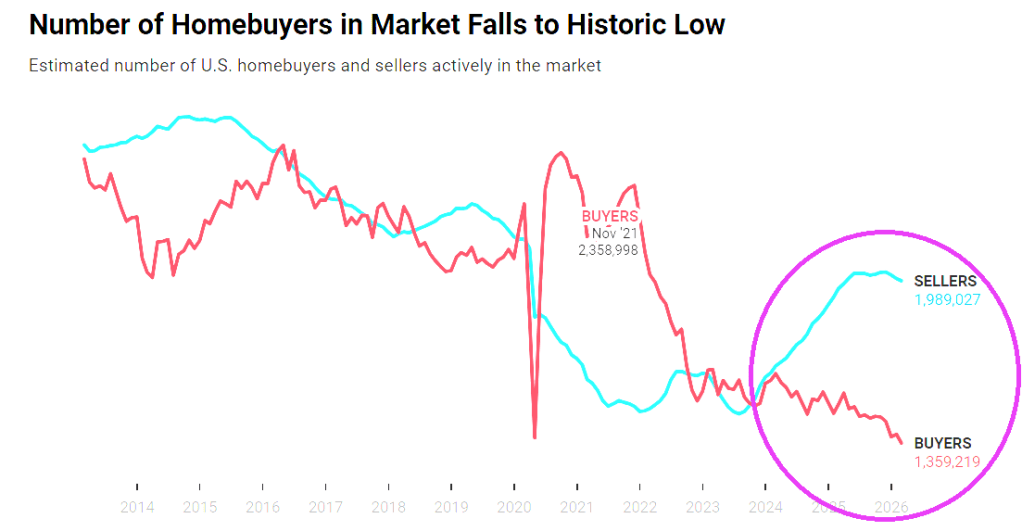
And the number of homebuyers has fallen to historic lows.
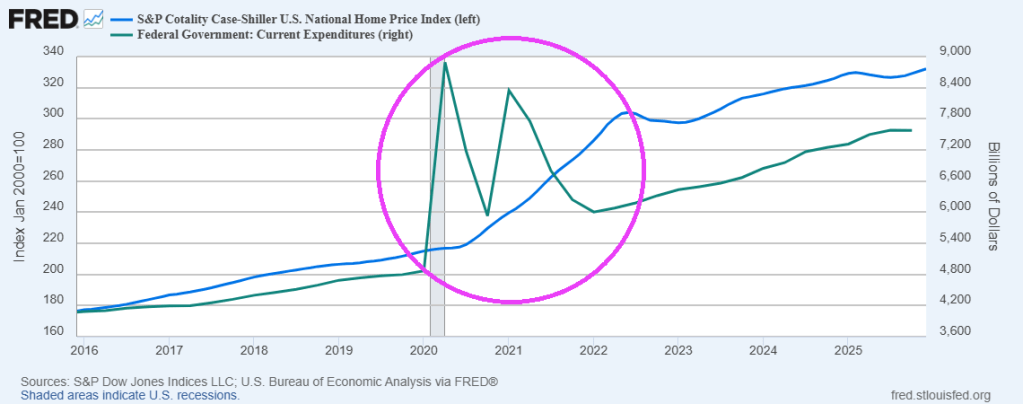
A good reason there are so few buyers is that home prices has soared after the Federal government’s spending spree after Covid.
Prayers for the soul of Noelia Castillo Ramos, murdered by the Spanish government. For being gangrape TWICE by immigrants then attempted suicide.
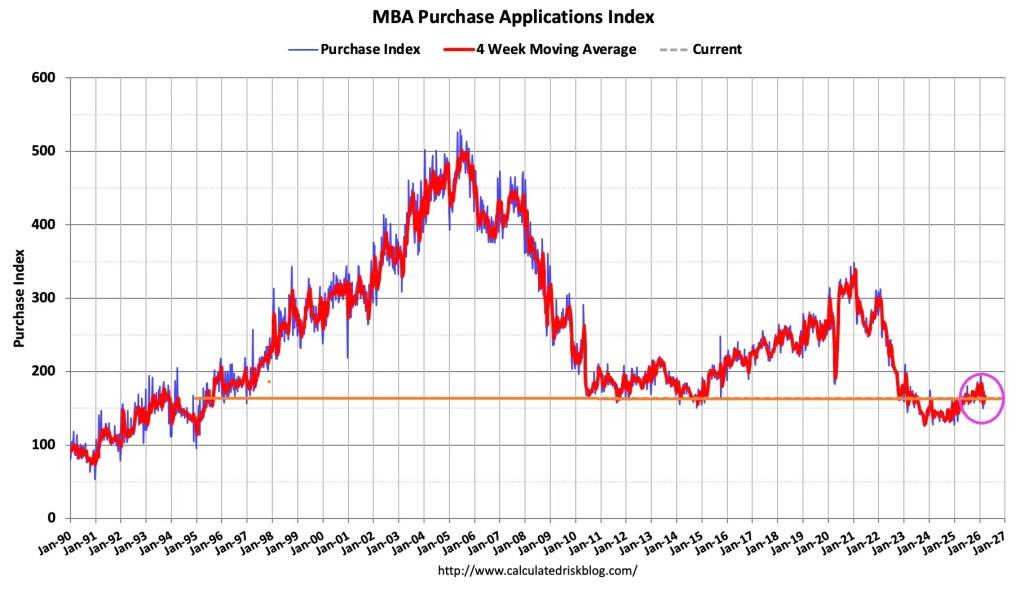
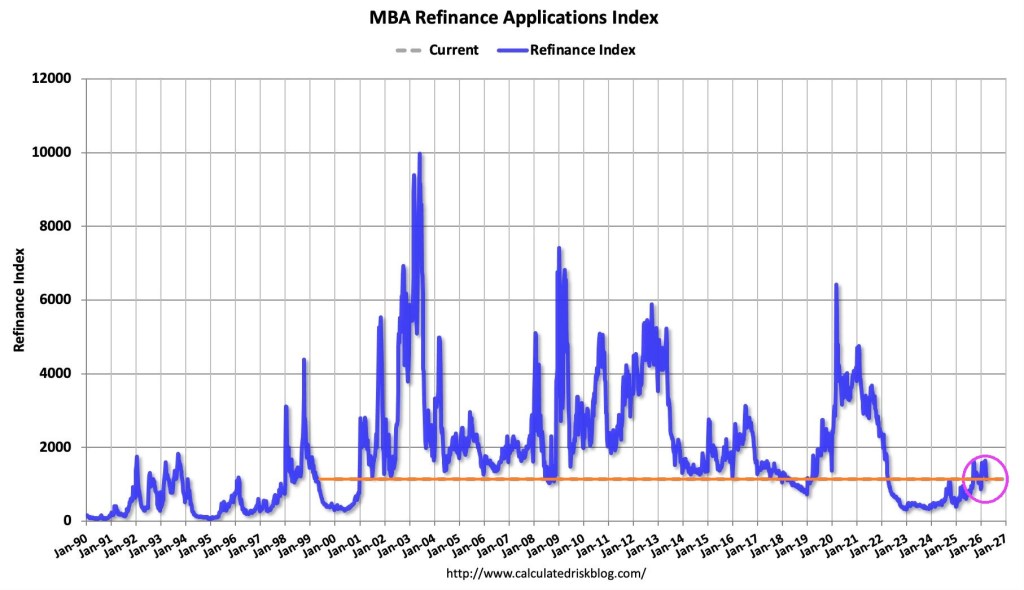
Mortgage applications decreased 10.5 percent from one week earlier, according to data from the Mortgage Bankers Association’s (MBA) Weekly Mortgage Applications Survey for the week ending March 20, 2026.
The Market Composite Index, a measure of mortgage loan application volume, decreased 10.5 percent on a seasonally adjusted basis from one week earlier. On an unadjusted basis, the Index decreased 10 percent compared with the previous week. The seasonally adjusted Purchase Index decreased 5 percent from one week earlier. The unadjusted Purchase Index decreased 5 percent compared with the previous week and was 5 percent higher than the same week one year ago.
The Refinance Index decreased 15 percent from the previous week and was 52 percent higher than the same week one year ago.
Nothing has been the same since Covid outbreak in 2020 and the resulting Federal government spemding spree.
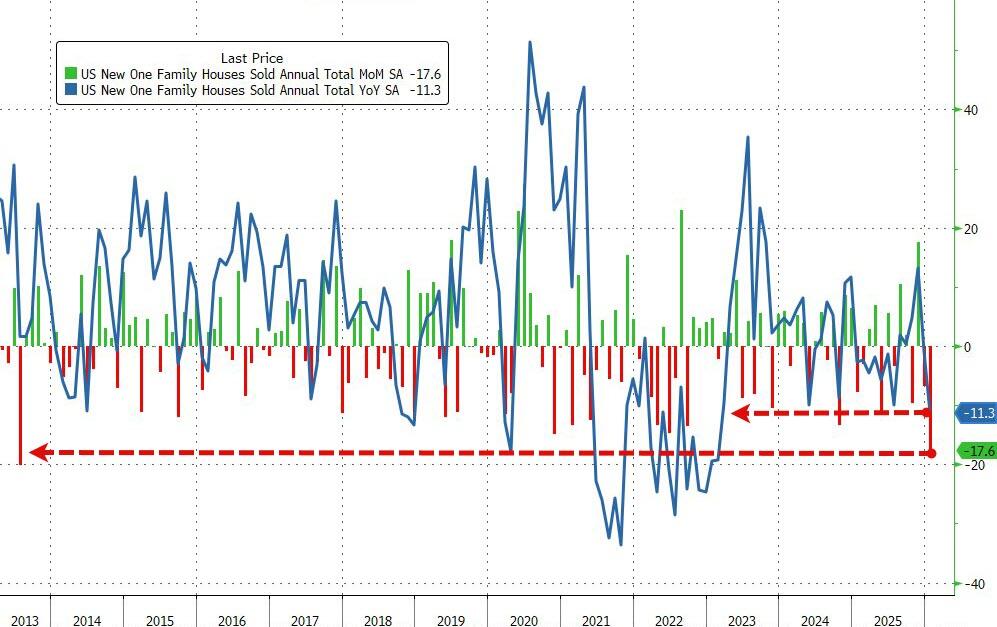
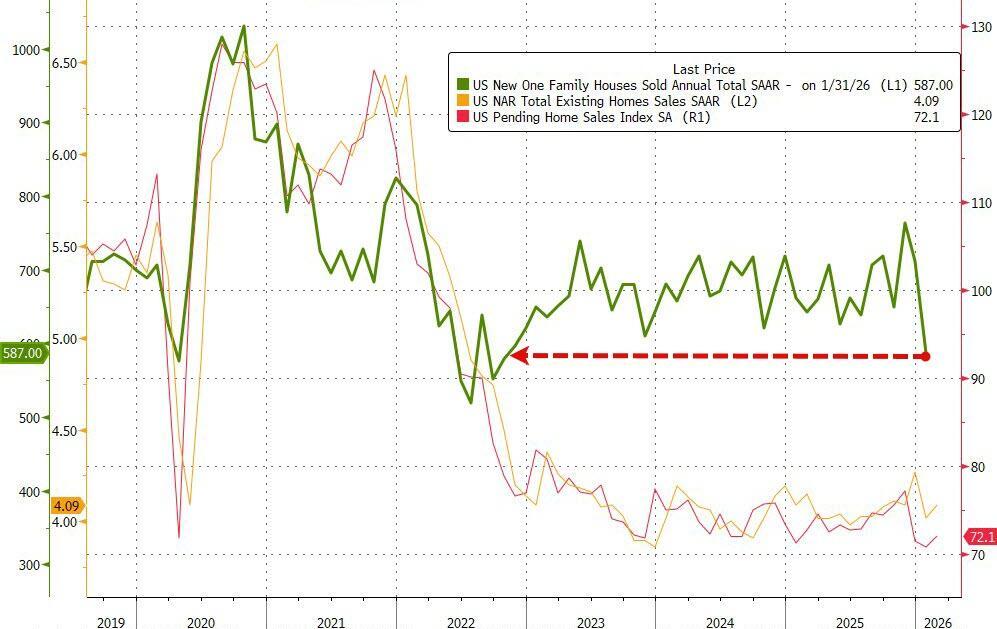
Despite falling mortgage rates, analysts expected December’s drop in new home sales to accelerate in January… and accelerate they did… crashing a stunning 17.6% MoM (-2.7% MoM exp) – the biggest MoM drop since July 2013.
This huge MoM drop dragged sales down 11.3% YoY – the worst slide in three years.
Source: Bloomberg
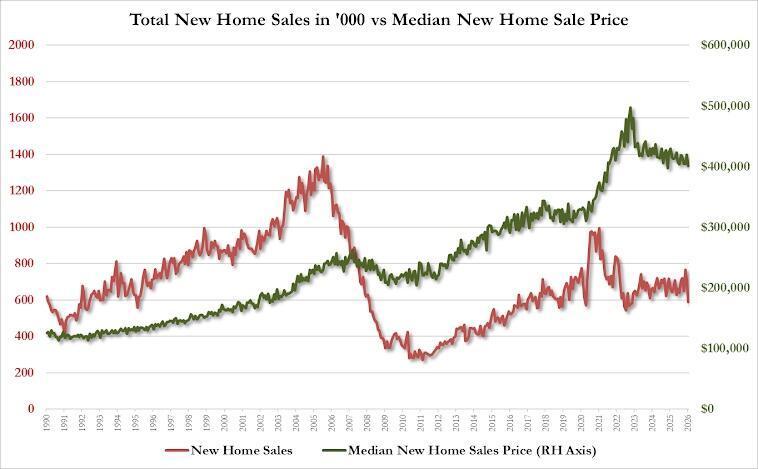
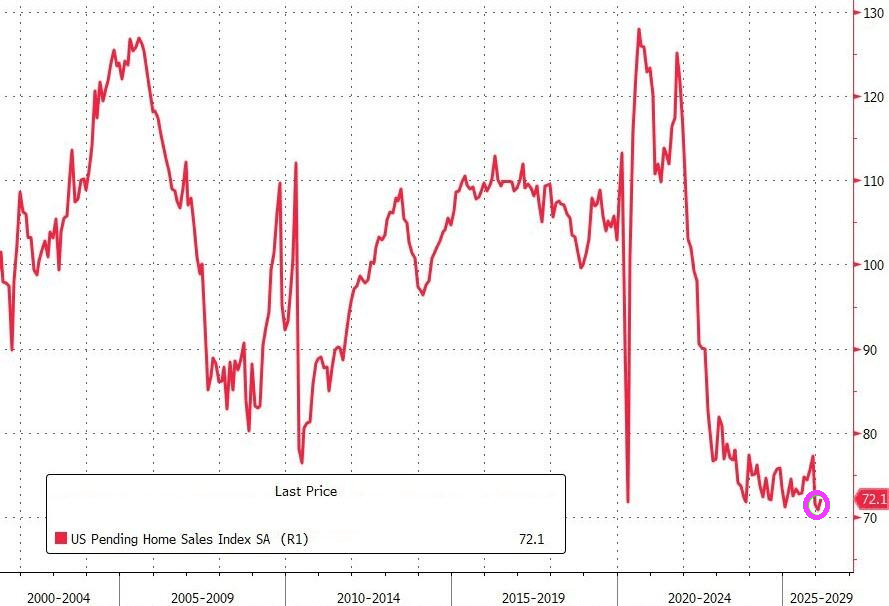
This huge drop dragged the new home sales SAAR down to its lowest since 2022, catching down to existing and pending sales…
Inventories are up (Houses for sale in Jan. rose 0.4% m/m to 476,000), prices are down (Median down 6.8% YoY at $400k – lowest since 2024)…
…and remember these deals were signed in January – meaning this is not mortgage related (some suggesting weather impact – Northeast sales down 44.7% MoM, MidWest -33.9% MoM, but the scale is immense).
Moral of the story: US home prices are too high for millions of households to afford.
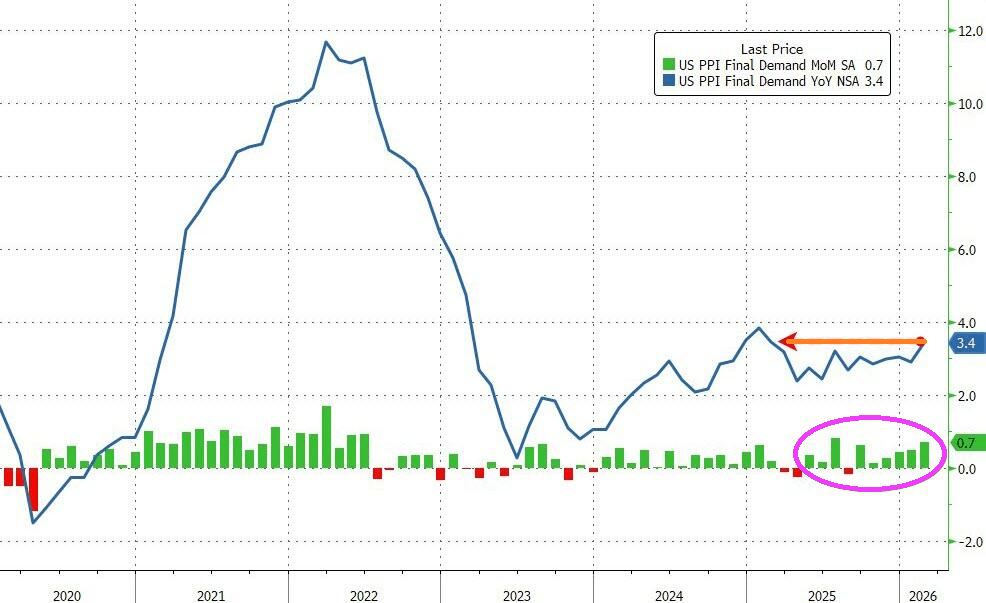
Producer prices were higher by 3.4% YoY (notably hitter than the 3.0% expected and up from the 2.9% prior). That is the hottest PPI since January 2025
Source: Bloomberg
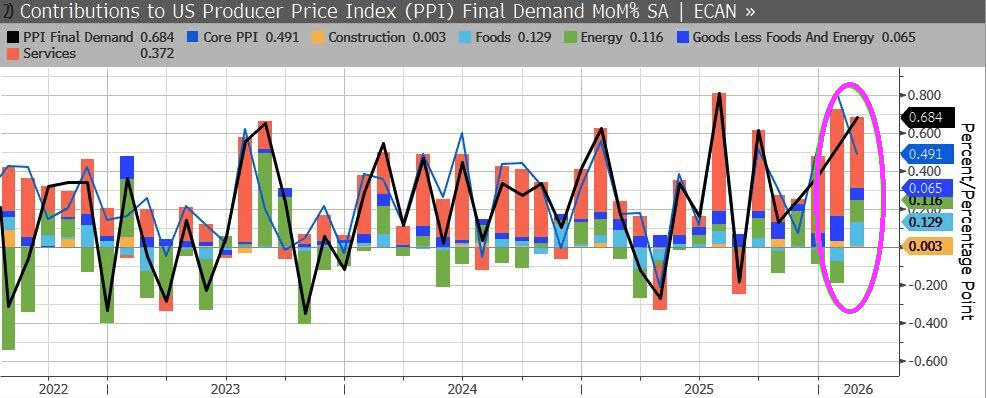
More than half of the February rise in prices for final demand can be attributed to a 0.5-percent advance in the index for final demand services. Prices for final demand goods increased 1.1 percent.
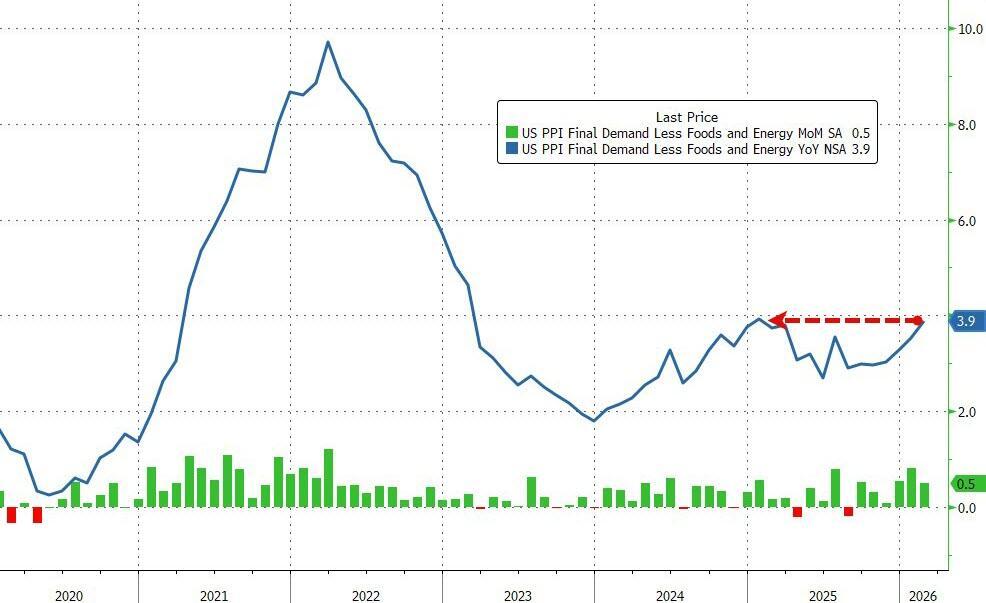
Core PPI (ex Food and Energy) also soared (+0.5% MoM) pushing core prices up by 3.9% YoY – the highest since Jan 2025.
So much for the “Trump has ruined the economy” mantra of politicians and celebrities.
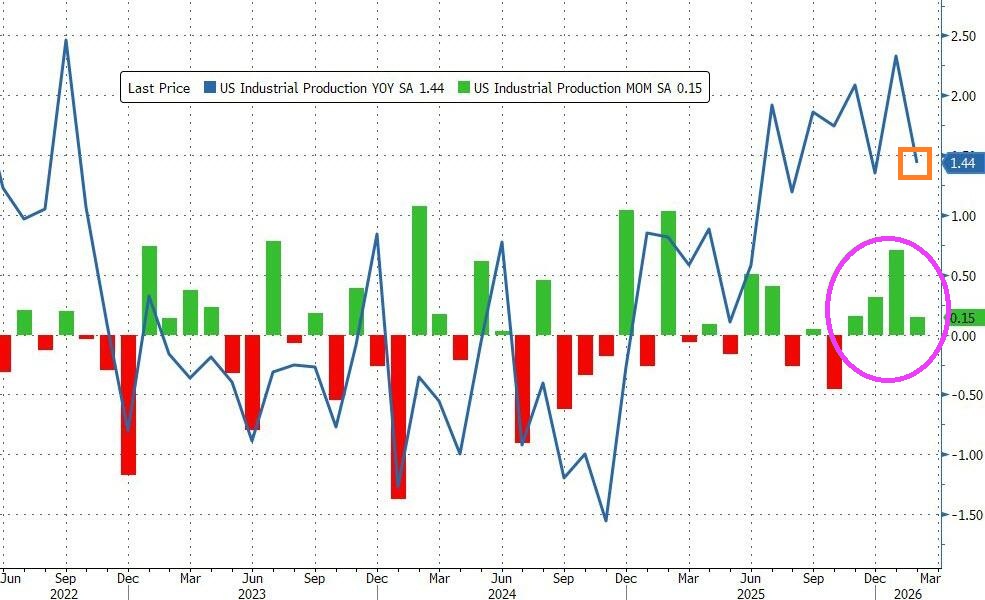
After a strong gain in January, US Industrial Production continued to expand in February, rising 0.2% MoM (better than expected +0.1%) – the fourth straight month of gains with Production up 1.44% YoY.
Source: Bloomberg
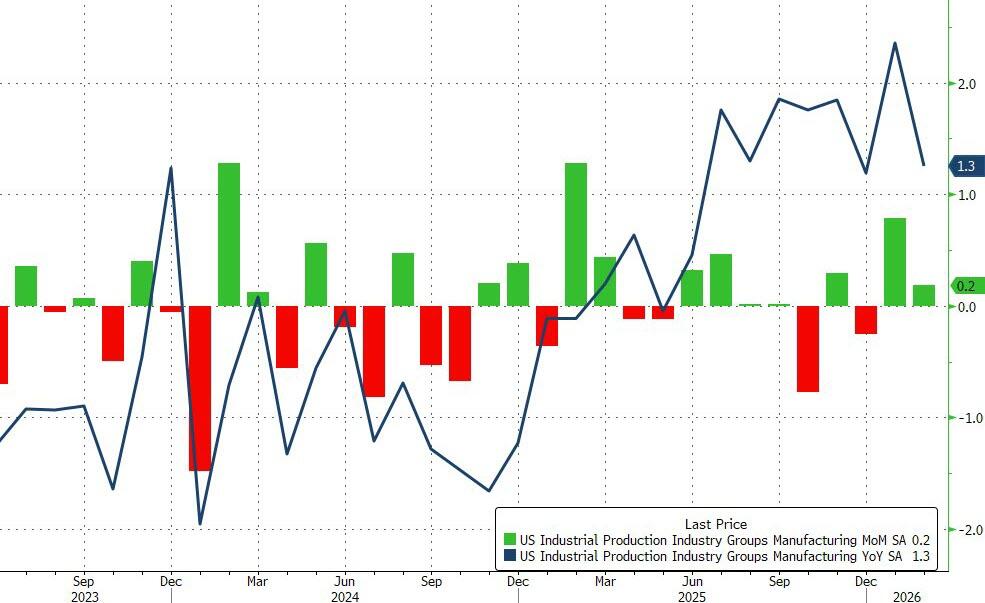
Manufacturing output also beat expectations, rising 0.2% MoM in February.
Durable manufacturing output edged up 0.1 percent, with mixed results across categories; the index for motor vehicles and parts posted the largest gain, and the index for machinery posted the largest loss.
Nondurable manufacturing output rose 0.2 percent, with gains in the production of chemicals, of plastic and rubber products, and of paper products outweighing declines in the output of petroleum and coal products and of food, beverage, and tobacco products. The output of other manufacturing (publishing and logging) rose 1.3 percent.
Mining output increased 0.8 percent in February, following a 0.9 percent increase in January. The output of utilities fell 0.6 percent in February, reflecting no change in the index for electric utilities and a 4.7 percent drop in the index for natural gas utilities.
Source: Bloomberg
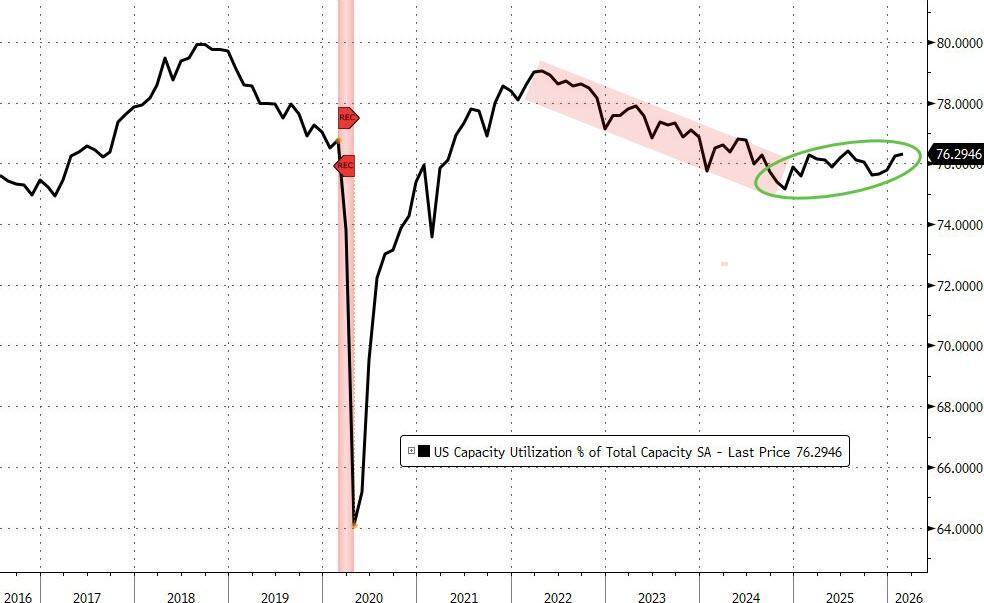
Capacity Utilization printed 76.3 (better than expected)…
…maintaining the positive trend since Trump’s second term began.









You must be logged in to post a comment.