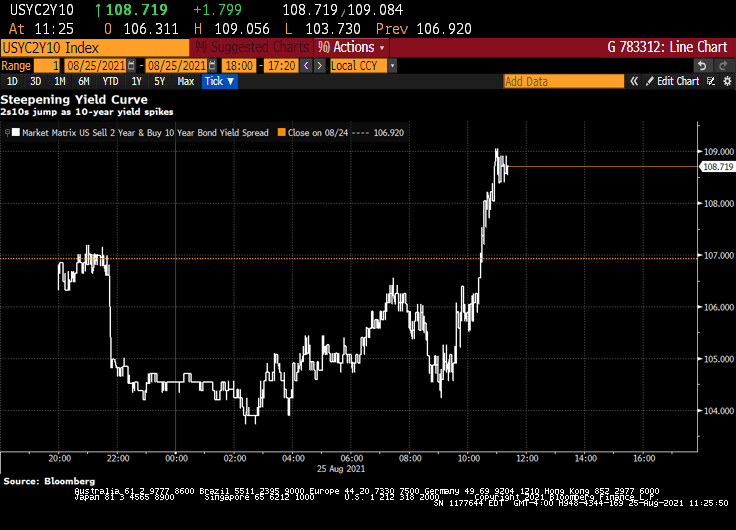
U.S. 10-year yields are spiking upwards in what was supposed to be a sleepy day before the Fed’s Jackson Hole conference. The 2s10s curve is the steepest in two weeks. Eurodollar yields too have risen sharply and are up 6-7 bps in the blue and gold packs.
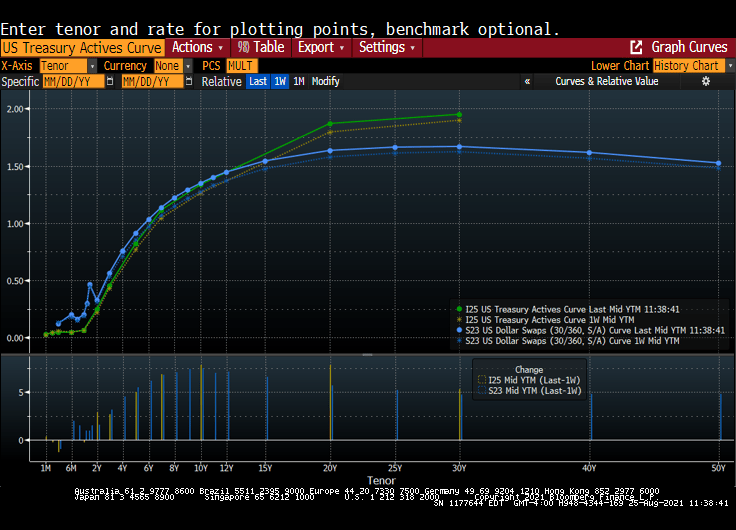
Over the last week, we have seen a steepening in the US Treasury Actives curve and the US Dollar Swaps curve.
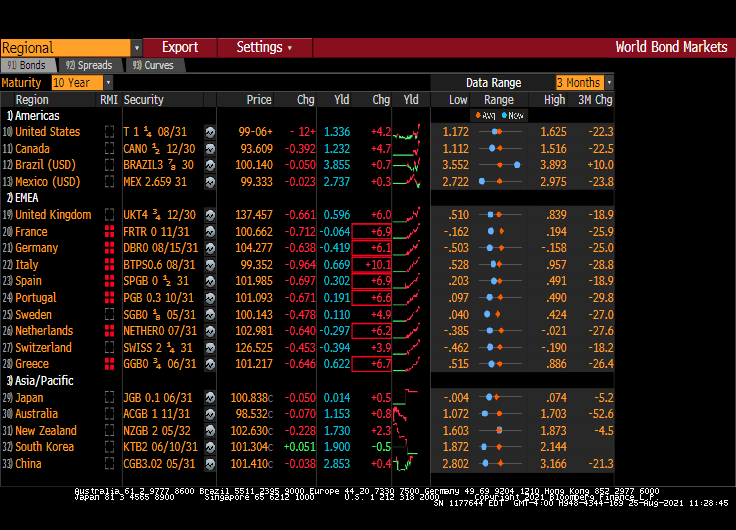
This may be linked to the range breach in German 10-years and Italian 10-years. In fact, France, Spain, Portugal, Netherlands and Greece has all seen 6 bps leaps in 10-year sovereign yields today.
Does this mean that Chairman Mao Powell is likely to announce the paring-back of Fed monetary stimulus at J-Hole?
Since President Nixon helped take the US off the gold standard, the US Dollar has become FIAT currency. That is, not backed any precious asset such as gold, silver, platinum, etc. What ever happened to the Bretton Woods system?
The Bretton Woods system was the first example of a fully negotiated monetary order intended to govern monetary relations among independent states. The chief features of the Bretton Woods system were an obligation for each country to adopt a monetary policy that maintained its external exchange rates within 1 percent by tying its currency to gold and the ability of the International Monetary Fund (IMF) to bridge temporary imbalances of payments. Also, there was a need to address the lack of cooperation among other countries and to prevent competitive devaluation of the currencies as well.
So much for Bretton Woods. We now live in a FIAT world where The Federal Reserve can print money almost without any limitation.
Enter cryptocurrcies such as Bitcoin and Ethereum.
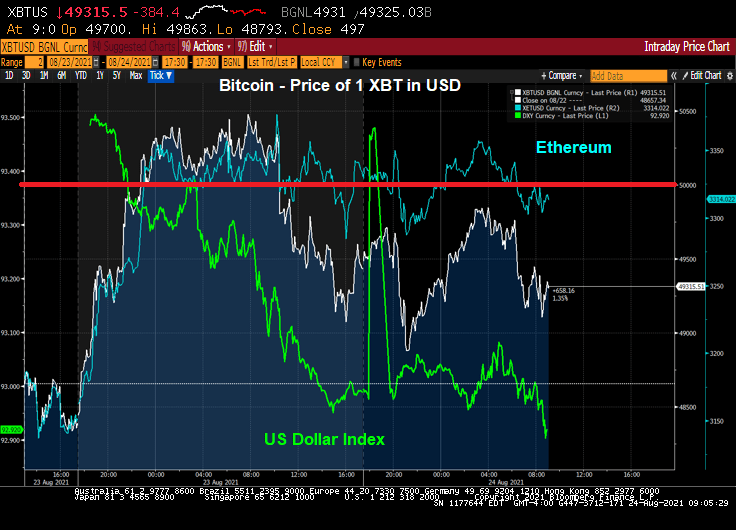
Bitcoin, the favorite of many, broke through the $50,000 barrier yesterday, only to level off below $50,000 this morning. Ethereum is level after rising yesterday. Meanwhile the US Dollar (the preferred FIAT model of The Federal Reserve) is falling.
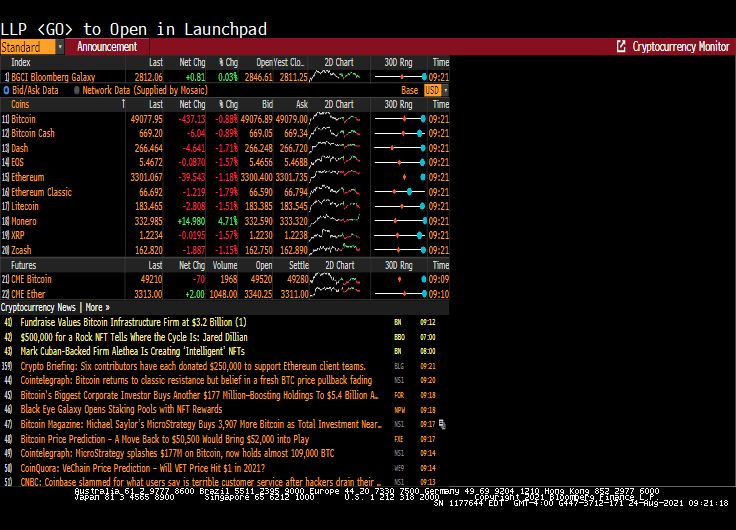
Here are some of the cryptos out there, but I only follow Bitcoin and Ethereum.
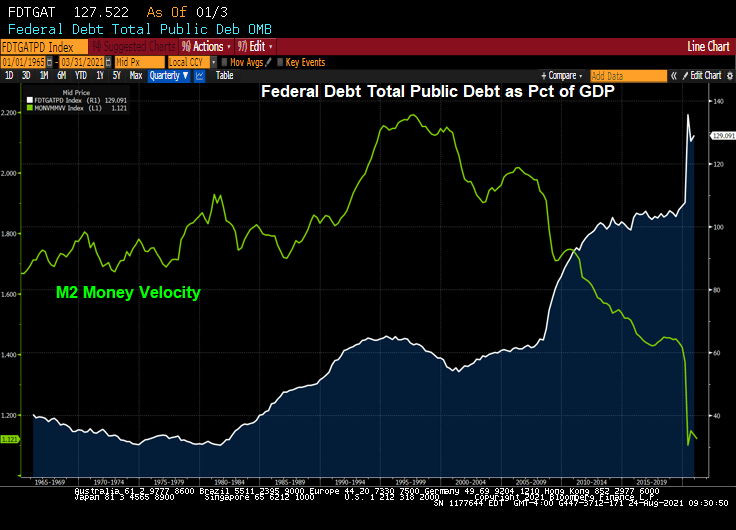
Since Nixon and dropping off the gold standard, we have seen US Federal debt (and spending) blow out of control with the decline in M2 Money Velocity to its lowest levels.
This should be the new emblem of the US Federal government AND The Federal Reserve.
The minutes of the July Fed meeting suggest officials may signal an impending start to asset purchase tapering at the September gathering — provided jobs numbers remain on track in the interim — and make an announcement in November.
Rising infections counts have not spurred an uptick in new jobless claims. High-frequency data show some customers are shying away from eating out, but the overall impact on restaurant reservations is limited. The bigger challenge for many companies is retaining and hiring enough workers to meet strong demand, evident in low layoff counts and persistent mention of labor shortages.
In other words, IFF Covid doesn’t cause further economic damage (or governments don’t shut down economies), then The Fed will consider a mild taper of their balance sheet.
But as of this morning, The Fed’s reverse repo facility keeps on rising along with The Fed’s balance sheet. At least M2 Money Supply growth has leveled off.
That should result in an increase in Treasury yields and mortgage rates, all things being equal. And assuming the Biden Administration and governors don’t panic and go into economic lockdown … again.
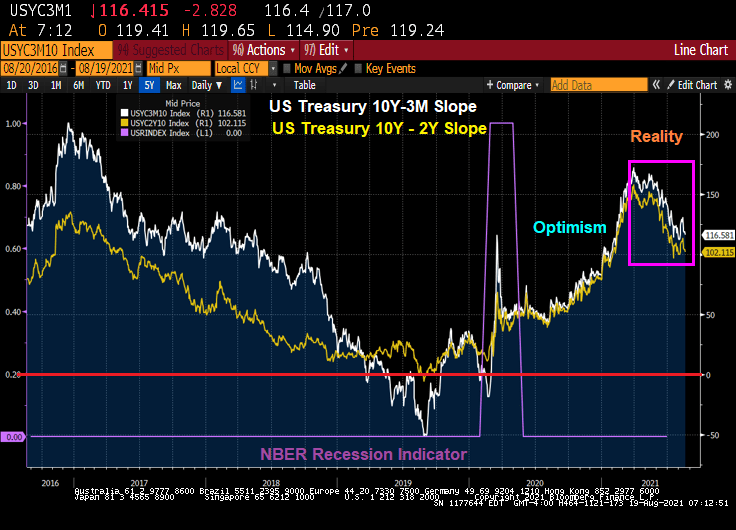
The US Treasury curves since the Covid recession of 2020 have shown optimism in recovery … then reality dawned.
Company spent $50.7 million on 100-ounce gold bars in August
Customers can now pay for software in gold or Bitcoin
Palantir Technologies Inc. said it’s preparing for another “black swan event” by stockpiling gold bars and inviting customers to pay for its data analysis software in gold.
The company spent $50.7 million this month on gold, part of an unusual investment strategy that also includes startups, blank-check companies and possibly Bitcoin. Palantir had previously said it would accept Bitcoin as a form of payment before adding precious metals more recently.
A spokeswoman for Palantir said no one has yet paid in either Bitcoin or gold. Accepting nontraditional currencies “reflects more of a worldview,” Shyam Sankar, the chief operating officer, said in an interview. “You have to be prepared for a future with more black swan events.”
The gold purchase was buried in a securities filing last week for its quarterly financial results and reported earlier this week by Barron’s. The acceptance of gold as a form of payment hasn’t been previously reported.
Palantir’s 100-ounce gold bars will be kept in a secure location in the northeastern U.S., according to the filing. “The company is able to take physical possession of the gold bars stored at the facility at any time with reasonable notice,” Palantir wrote.
Palantir, co-founded by the technology billionaire Peter Thiel and Chief Executive Officer Alex Karp, makes software used by governments and businesses. It fashions itself as a company of free thinkers. Palantir relocated to Denver last year and mocked its peers in Silicon Valley on the way out. In the interview, Shyam compared Palantir’s culture with an “artist colony,” rather than a tech company churning out software on an assembly line.
Governments have strongly embraced Palantir software to help them make sense of the coronavirus pandemic, the current so-called black swan, a random and unpredictable event.
The company has some $2.3 billion in cash and is exploring creative uses for that money. Palantir said in May that it was considering investing in Bitcoin. And it’s taking stakes in startups that are customers of Palantir software, an approach that helped buoy sales results in the second quarter.
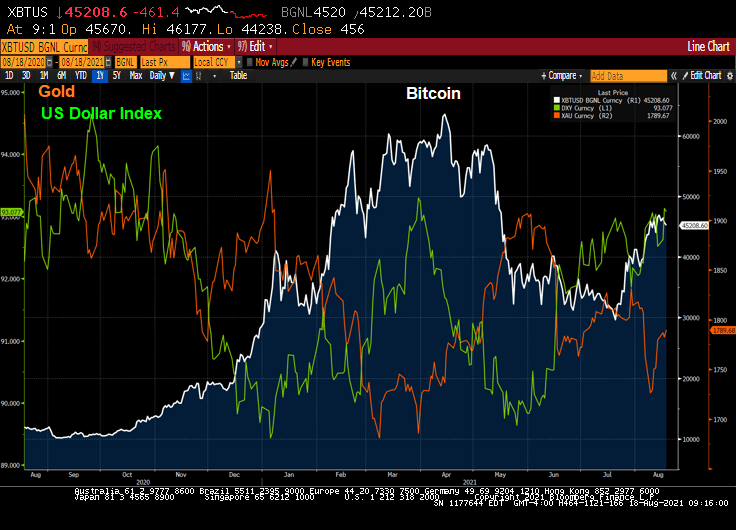
Here is a chart of the US Dollar, Bitcoin, and Gold over the past year.
There are a variety of measures of an asset bubble. And each one points to an unsustainable bubble in the stock market.
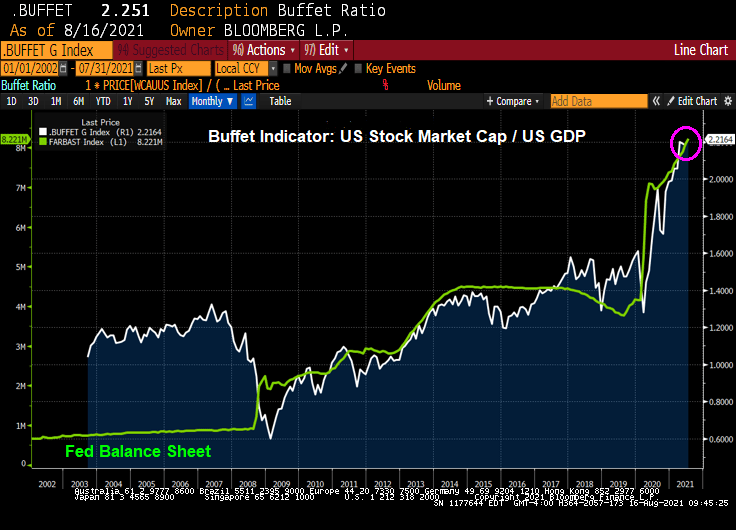
Let’s start with the Buffett Indicator. The ratio of Total Market Capitalization of all US stocks (WCAUUS ) to total nominal GDP of the United States (GDP CUR$ ).
There is also the GLOBAL Buffett ratio produced by Holger Zschäpitz. Global market cap now equal to 139% of global GDP, way above Buffett’s 100% bubble threshold.
Shiller’s Cyclically-adjusted Price-earnings ratio? Still climbing and resembles the Dot.com bubble of 2000.
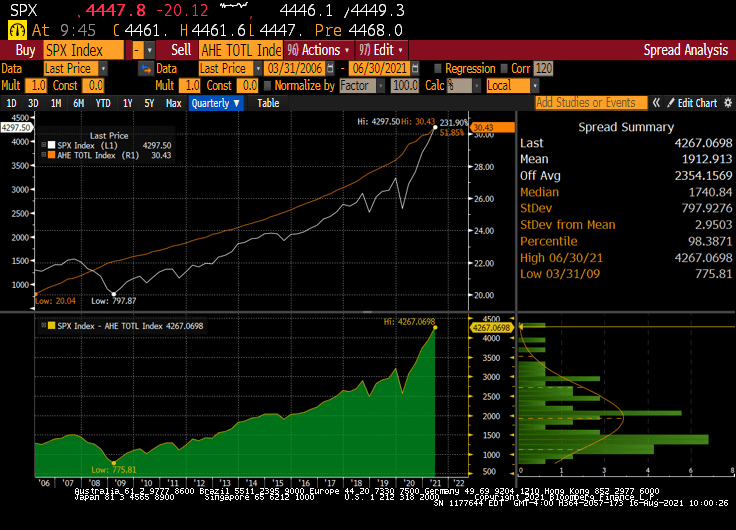
How about gold to Average Hourly Earnings (similar to the Bichler and Nitzan “Power” measure. The spread (bottom chart) sees the S&P 500 index soaring away from average hourly earnings.
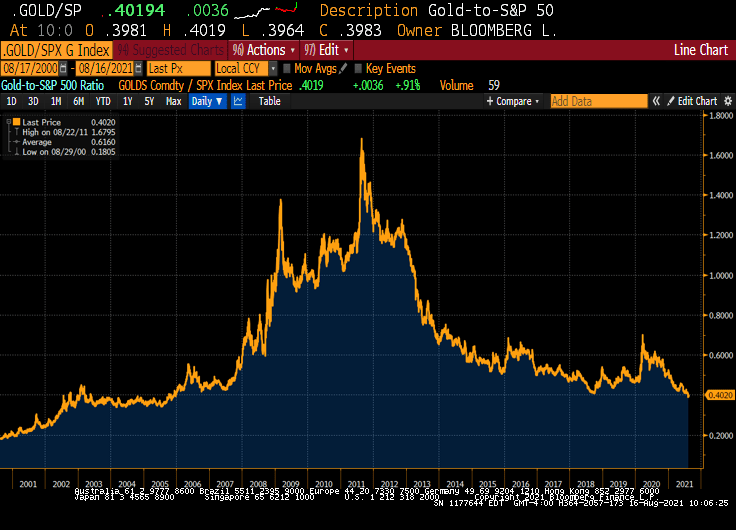
We also have the Gold to SPX ratio that is now back to pre-financial crisis levels.
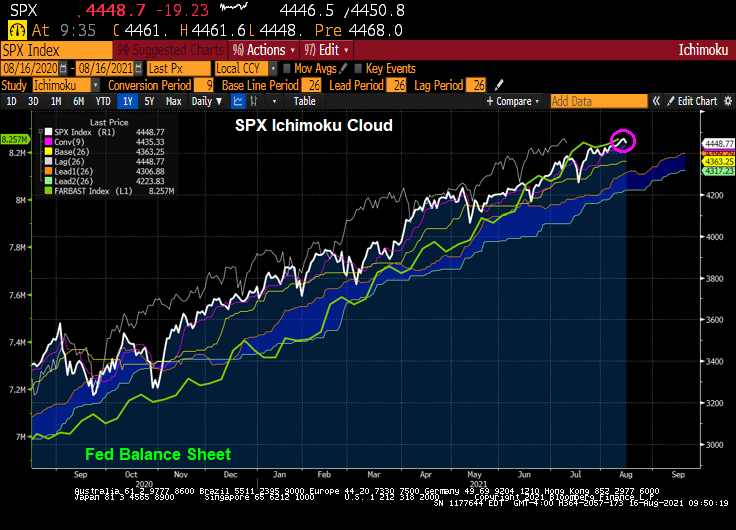
How about the Ichimoku cloud, where the SPX is currently ABOVE the cloud?
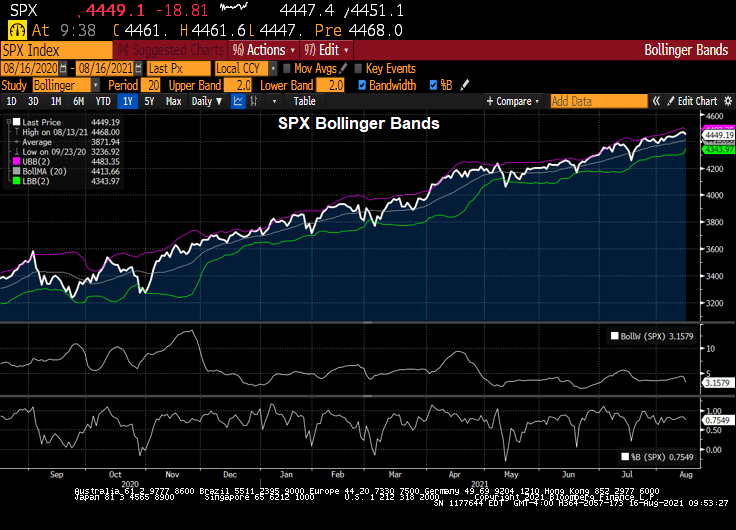
SPX and Bollinger Bands? The SPX index is close to the upper band.
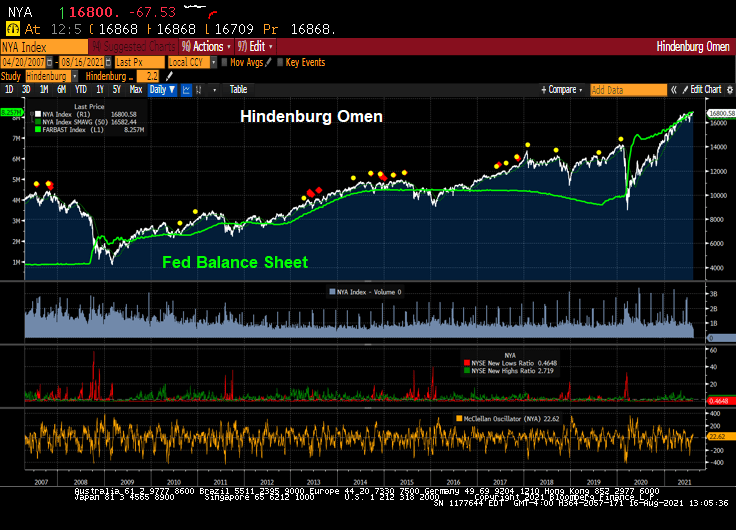
How about The Hindenburg Omen, a technical indicator that was designed to signal the increased probability of a stock market crash. It compares the percentage of new 52-week highs and new 52-week lows in stock prices to a predetermined reference percentage that is supposed to predict the increasing likelihood of a market crash.
So it looks like a have a bubble in the stock market.
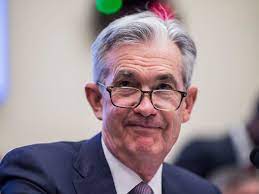
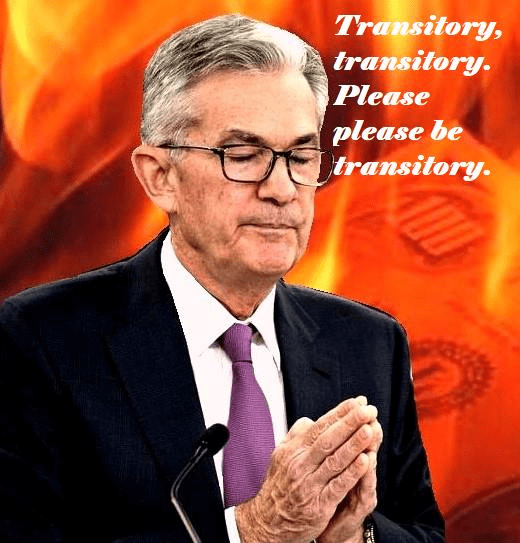
Fed Chair Jerome Powell sees the ghost of the Dot.com bubble.
The purchasing power of the US Dollar has been virtually erased since the creation of The Federal Reserve in 1913 when $1,000 in 1913 is now worth $36.36. And M2 Money Velocity (GDP/M2 Money) has crashed and burned to the lowest level in history.
Inflation? Home price growth YoY is the highest in modern US history. And CPI growth YoY is the highest since the Financial Crisis and July 2008.
Bear in mind that before the creation of The Federal Reserve System in 1913, there were numerous incidents of inflation and bank failures leading banks to want protection of a national banking system that controlled the currency. Well, the banks got what they wanted.
The Fed is predicted to ease its foot off the printing press in the latter half of 2022.
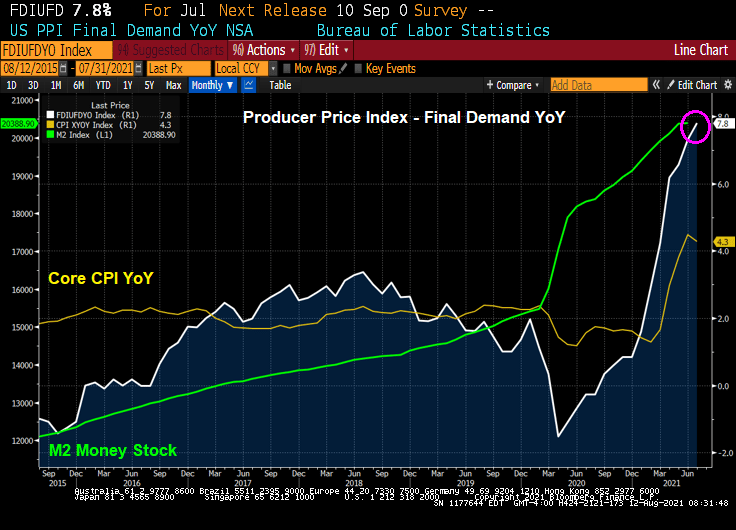
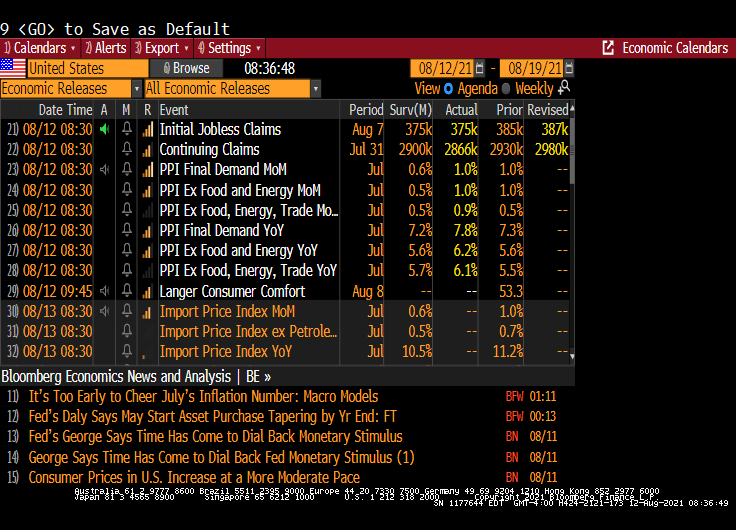
Well, economists were expecting a 7.2% YoY print of the Producer Price Index – Final Demand. But July’s print came in hot … at +7.8% YoY. Compare that with the Core Consumer Price Index YoY of +4.3%.
The month-over-month PPI Final Demand is showing a run rate of 12%! (1% in July x 12 months).














You must be logged in to post a comment.