Pop Goes The Weasel! S&P 500 Drops 2% On Chinese Property Developer Contagion (VIX Spikes)

Pop goes the weasel!

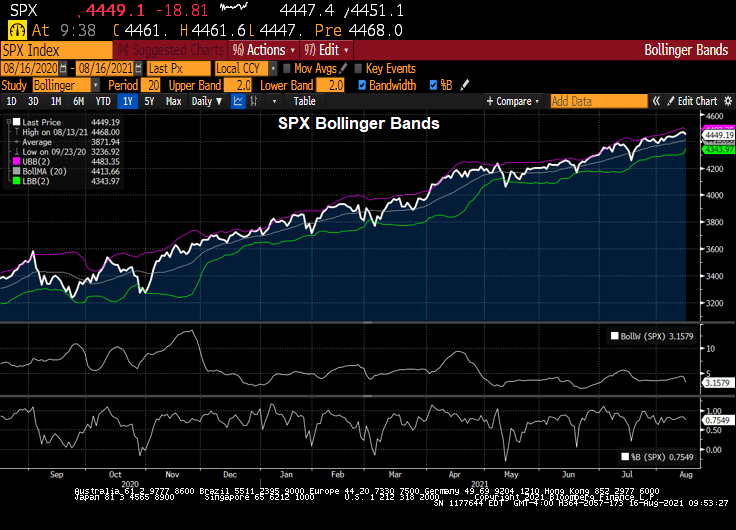
(Bloomberg) — The S&P 500 Index extended its decline past 2% Monday afternoon amid growing investor jitters about China’s real estate crackdown potentially sparking a financial contagion.  And the Hang Seng fell 3.30% overnight.

The benchmark gauge was down 2.1% as of 12:08 p.m. in New York. All of the 11 major industry groups declined, with the energy, financials and materials sectors leading the losses. The tech-heavy Nasdaq 100 index slumped 2.4%, while the blue-chip Dow Jones Industrial Average retreated 1.9%.

By 2:33pm, the Dow is down 2.55%, NASDAQ down 3.15%.


Volatility also soared, with the Cboe Volatility Index — often called Wall Street’s “fear index” — jumping as much as 29% to 26.75, the highest level in over four months.  


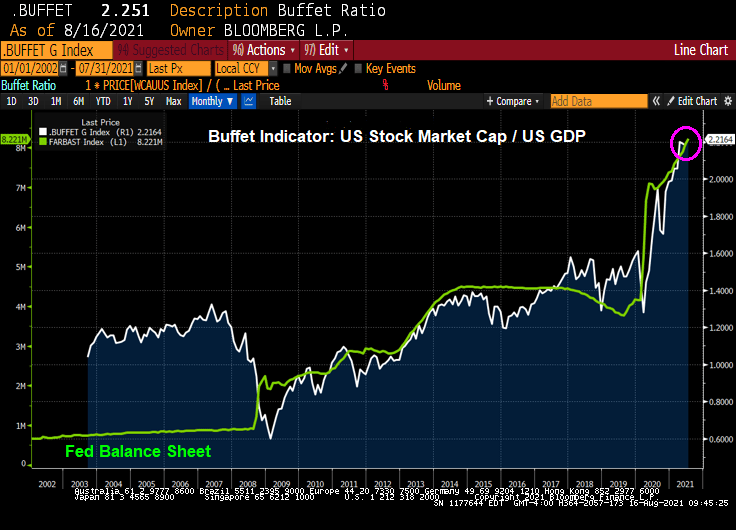
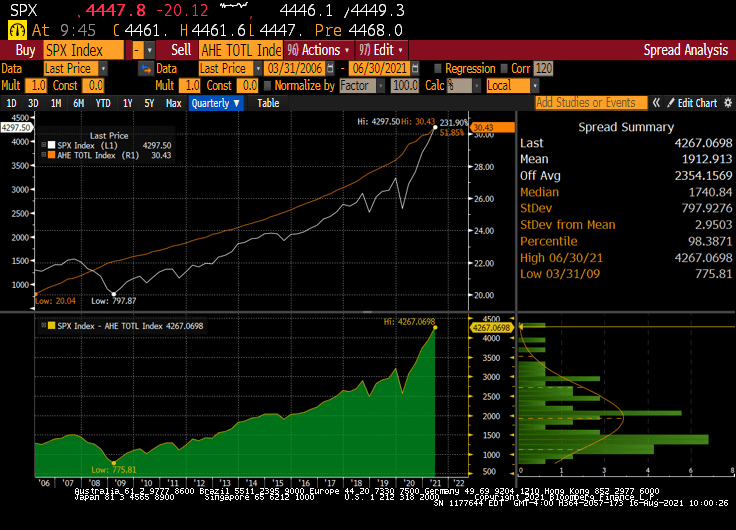
“While the Evergrande situation is front and center, the reality is, stock market valuations are overstretched and the market has enjoyed too long of a break from volatility and Monday’s stock market declines are not surprising,” said David Bahnsen, chief investment officer at the Bahnsen Group, a wealth management firm.

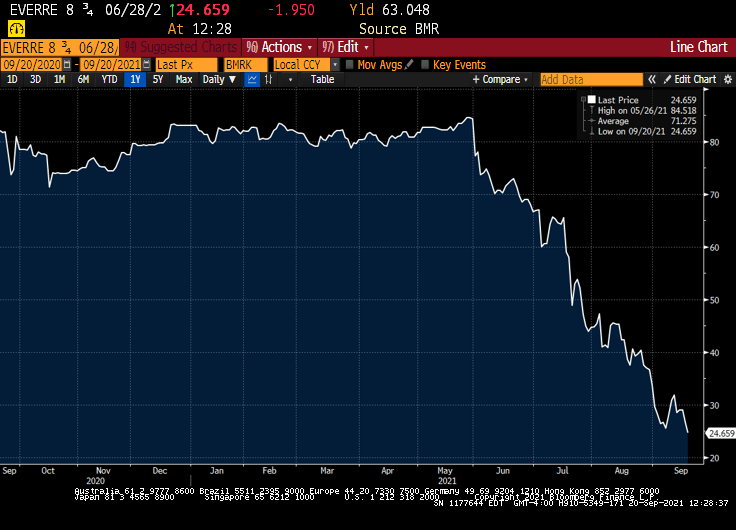
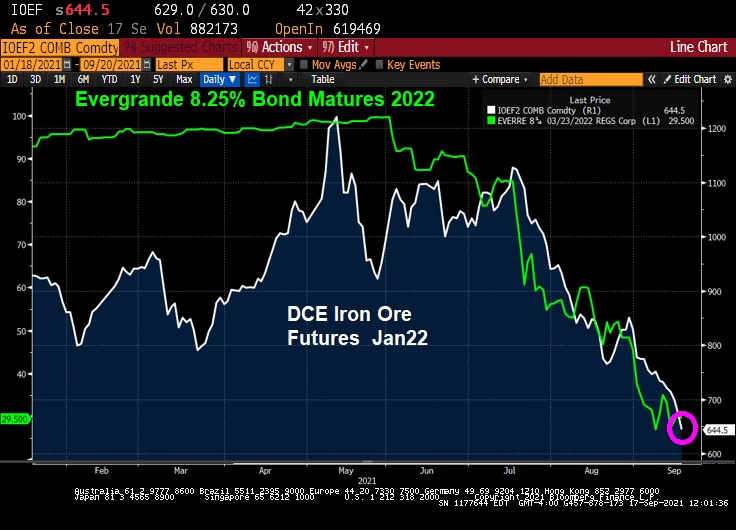
As Evergrande bonds continue to tank.

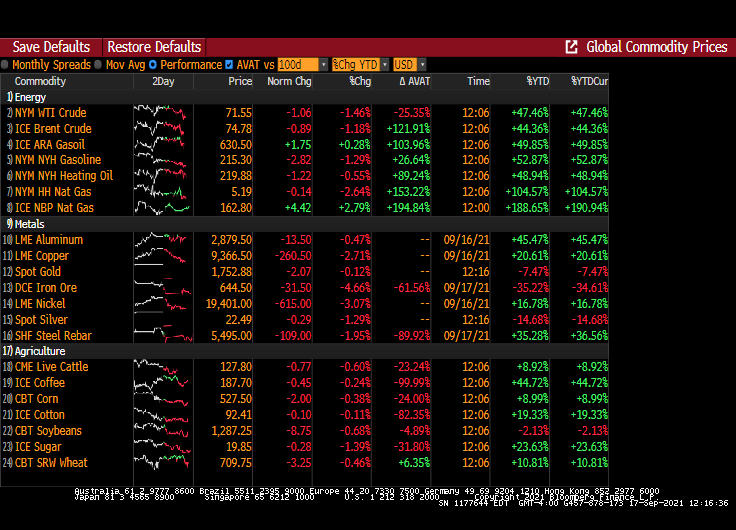
Meanwhile, most commodity prices are falling … except for UK Natural Gas Futures which are up 16.5%!

Pop goes the weasel!

Iron Ore Futures Stumble Amid China’s Evergrande Meltdown (US Propane Up 78% Since Biden Elected President)

Let’s get ready to stumble!

Iron Ore futures are down a whopping 4.66% today as China real estate developer Evergrande plunges into insolvency. And Evergrande’s bond that matures in 2022 sinks to $29.50.

Other commodities are also sinking. One of the only commodities that is increasing today is ICE NBP Natural Gas.

And that is a shame is your rely on propane for heating, since propane prices has risen 78% since the election of “Delaware Joe” Biden as President.

Thanks a lot, Joe and Congress!

August US Inflation At 5.3% YoY, Real Avg Hourly Earnings At -0.9% (Gasoline Up 42.7% YoY, Used Cars And Trucks Up 31.9% YoY, Home Prices Up 18.6% YoY)

US inflation remained about the same in August as it was in July. CPI YoY fell ever so slightly from 5.4% in July to 5.3% in August. Real hourly earnings remain negative.

The source of consumer inflation? Gasoline prices rose 42.7% YoY while used cars and trucks rose 31.9% YoY.

Shelter rose 2.8% YoY. That is odd since the Case-Shiller national price index is growing at a torrid 18.61% YoY pace and the Zillow Rent Index YoY has recovered to a sizzling 9.24% YoY pace.

The YoY heatmap of inflation.

However, with the exception of home prices and rent, we are seeing a slowing of used car, foodstuffs and regular gas prices over the summer.

Yikes! Time to trim The Fed’s asset purchases!!

Ironman! Commodities Point To Slowing Economy And Inflation (Atlanta Fed GDPNow Forecast For Q3 Drops To 3.7%)

What if inflation is actually transitory like The Federal Reserve has been saying? Or is The Fed really telling us about an impending economic slowdown after the Fed’s and Federal government stimulypto wears off?

Iron ore prices have slowed noticeably after peaking earlier this year. Lumber futures (random length) have crashed to pre-Covid levels.

On the other hand, food stuffs and raw industrials remain elevated, but the growth in price has stalled (see pink box).

The Atlanta Fed’s GDPNow model of GDP growth shows a slowing of Q3 GDP to 3.7%. A slowdown from above 7% for the blue chip consensus.

President Biden, aka The Kabul Klutz, is now recommending tax increases as a result of the terrible jobs report from Friday. Rather than focus on The Fed’s monetary stimulus not working for the labor market.

The problem with fiscal stimulus is that the debt lasts forever but the GDP effects are short-lived. And The Fed is a crazy train.

S&P 500 Bubble Views: Buffett Indicator, Shiller CAPE, Ichimoku, Bollinger, Gold To SPX, SPX Versus Average Hourly Earnings (All Roads Point To Bubble)

There are a variety of measures of an asset bubble. And each one points to an unsustainable bubble in the stock market.

Let’s start with the Buffett Indicator. The ratio of Total Market Capitalization of all US stocks (WCAUUS ) to total nominal GDP of the United States (GDP CUR$ ).

There is also the GLOBAL Buffett ratio produced by Holger Zschäpitz. Global market cap now equal to 139% of global GDP, way above Buffett’s 100% bubble threshold.

Shiller’s Cyclically-adjusted Price-earnings ratio? Still climbing and resembles the Dot.com bubble of 2000.

How about gold to Average Hourly Earnings (similar to the Bichler and Nitzan “Power” measure. The spread (bottom chart) sees the S&P 500 index soaring away from average hourly earnings.

We also have the Gold to SPX ratio that is now back to pre-financial crisis levels.

How about the Ichimoku cloud, where the SPX is currently ABOVE the cloud?

SPX and Bollinger Bands? The SPX index is close to the upper band.

How about The Hindenburg Omen, a technical indicator that was designed to signal the increased probability of a stock market crash. It compares the percentage of new 52-week highs and new 52-week lows in stock prices to a predetermined reference percentage that is supposed to predict the increasing likelihood of a market crash.

So it looks like a have a bubble in the stock market.

Fed Chair Jerome Powell sees the ghost of the Dot.com bubble.