The US Bureau of Labor Statistics released their Real Earnings Report for August yesterday. And is it pretty depressing for US workers.
Real average hourly earnings for all employees increased 0.4 percent from July to August, seasonally adjusted. This result stems from an increase of 0.6 percent in average hourly earnings combined with an increase of 0.3 percent in the Consumer Price Index for All Urban Consumers (CPI-U).
Real average weekly earnings increased 0.3 percent over the month due to the change in real average hourly earnings combined with no change in the average workweek.
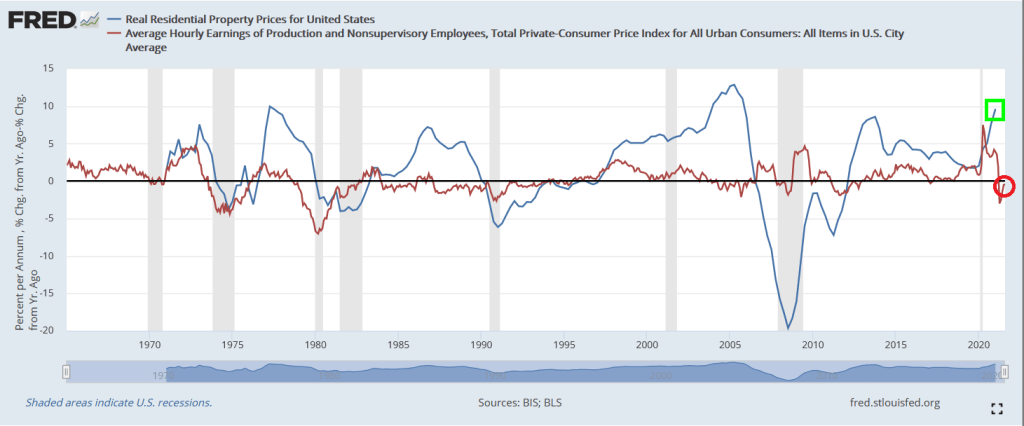
If we look at REAL US housing prices versus REAL average hourly earnings for production and nonsupervisory employees, we can see waves of imbalance between the two measures (also known as “bubbles”). Such as today.
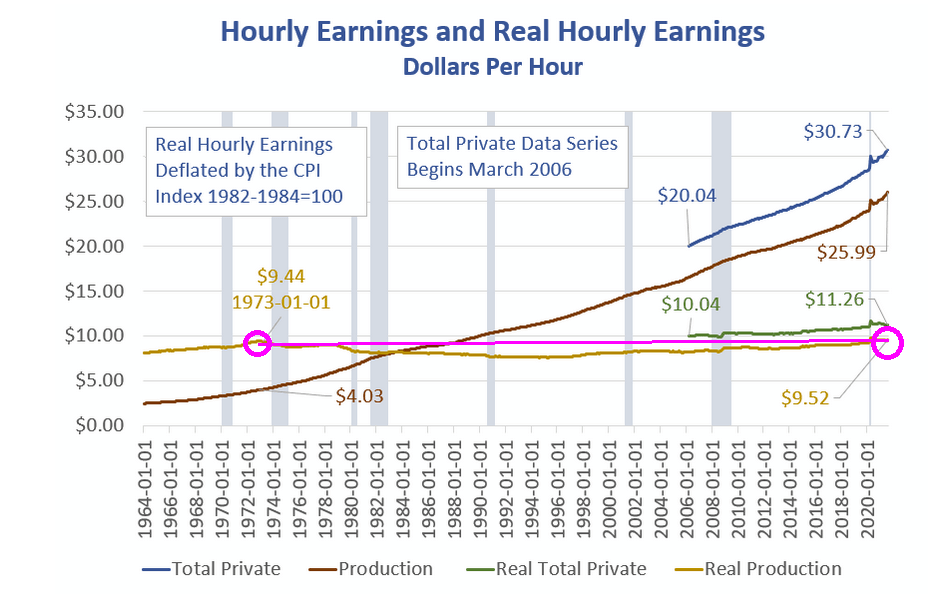
But the real horror chart is the following (courtesy of Mish). It shows that real hourly earnings have barely changed since January 1973.
Of course, labor outsourcing to lower labor cost countries is the chief culprit. Karsten Manufacturing, maker of Ping golf clubs, no longer makes their castings in Phoenix AZ thanks, in part, to EPA regulations. Ping clubheads are now made in Asia.
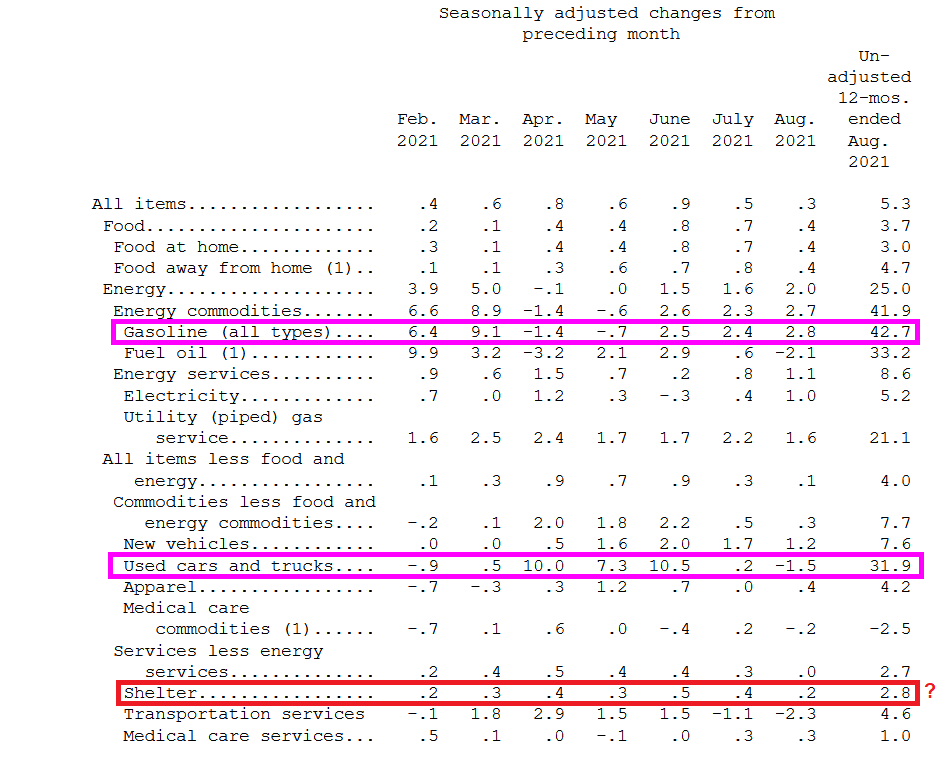
US inflation remained about the same in August as it was in July. CPI YoY fell ever so slightly from 5.4% in July to 5.3% in August. Real hourly earnings remain negative.
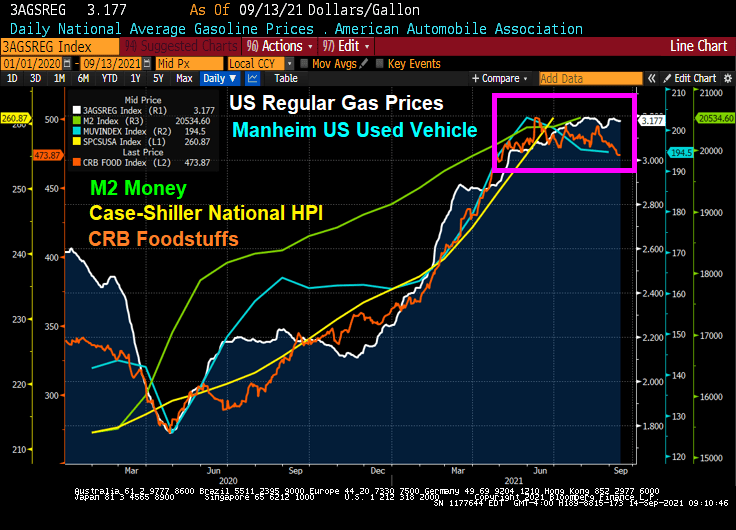
The source of consumer inflation? Gasoline prices rose 42.7% YoY while used cars and trucks rose 31.9% YoY.
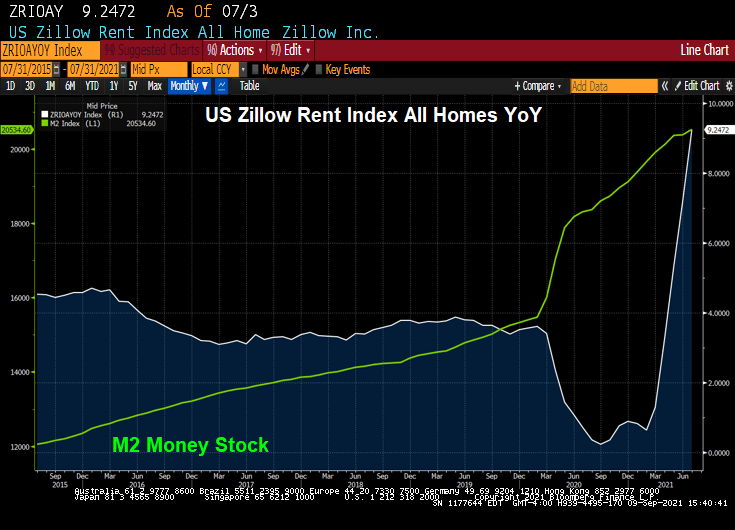
Shelter rose 2.8% YoY. That is odd since the Case-Shiller national price index is growing at a torrid 18.61% YoY pace and the Zillow Rent Index YoY has recovered to a sizzling 9.24% YoY pace.
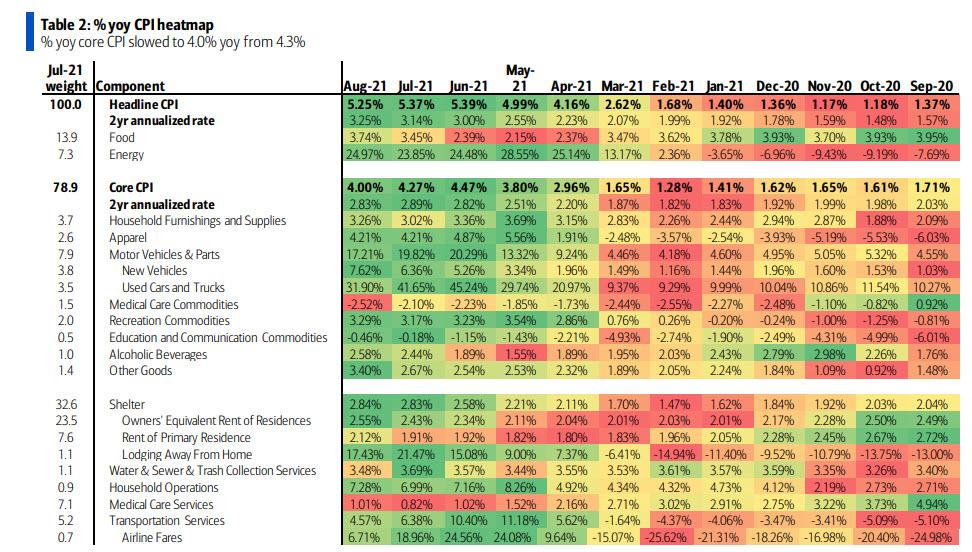
The YoY heatmap of inflation.
However, with the exception of home prices and rent, we are seeing a slowing of used car, foodstuffs and regular gas prices over the summer.
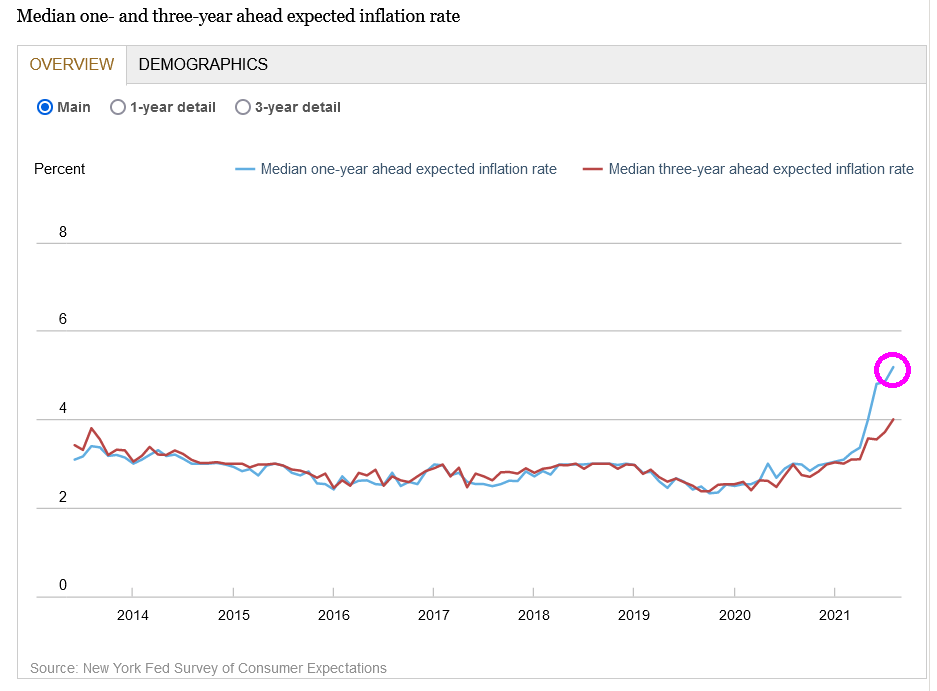
In its August Survey of Consumer Expectations, the bank said Monday that respondents see inflation a year from now at 5.2%, up from 4.9% the prior month. Three years from now, it is expected to be at 4%, up from 3.7% in July. Both readings mark record-high readings for data that goes back to 2013.
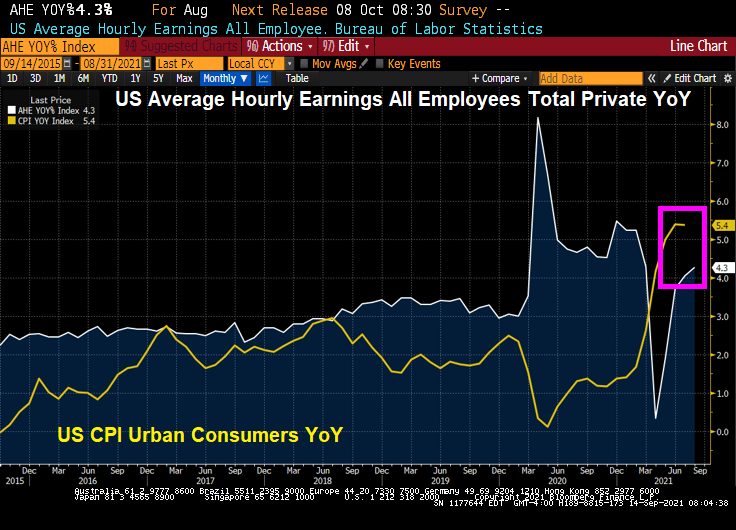
It is a shame that in that last reading that the CPI YoY exceeded Average Hourly Earnings YoY by a 5.4% to 4.3% margin.
Yes, inflation is hot, hot, hot and consumers are feeling it.
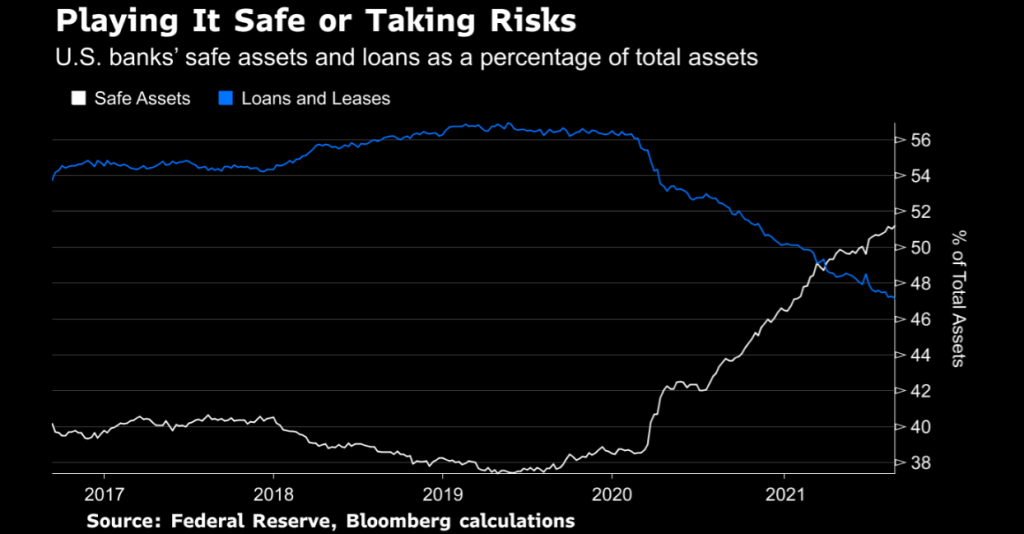
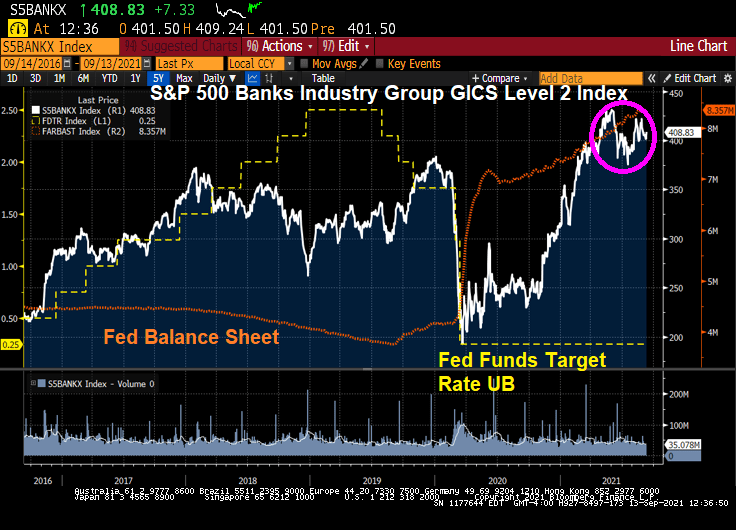
US bank loans and leases are slowing, yet The Federal Reserve has helped keep their stock values elevated thanks to the extraordinary monetary stimulus.
(Bloomberg) — U.S. banks’ loans and leases dropped to 47.15% of total assets in the week to Sept. 1 from 47.24% the week before, according to the Fed
Total assets increased to $22.19 trillion from $22.10 trillion
The share of safe assets — virtually riskless investments such as cash, Treasuries, and securities effectively guaranteed by the U.S. government — increased to 51.2% of total assets from 51.0%
Loans and leases as a percentage of deposits were unchanged at 59.7% Cash was the highest as a percentage of total assets since January 2015 Residential real-estate loans hit a historic low as a percentage of total assets at 10.0% Commercial real-estate loans were the lowest as a percentage of total assets since August 2015 Consumer loans were the lowest as a percentage of total assets since May Commercial and industrial loans were the lowest as a percentage of total assets since June 2012
Only in this deranged, hyper-stimulated market can bank stocks be soaring despite slowing loan and lease growth.
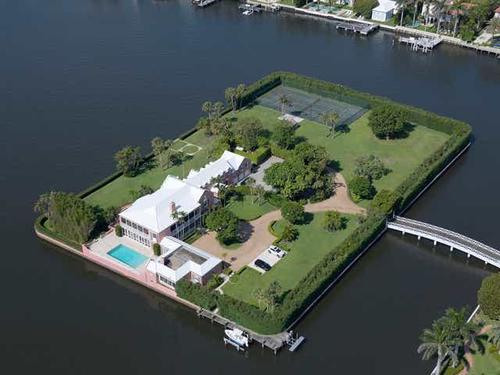
The South Florida housing market is sizzling with hot money from the North East, pushing up homes values sky high over the last year. One example of the mania is in Palm Beach, where a private island was bought in July and was relisted months later for a whopping 41% premium, according to WSJ.
One of Miami’s top real estate developers, Todd Michael Glaser, is taking advantage of the bubble, fueled by Wall Street bankers and other elites who have the economic mobility to leave the Northeast for the Sunshine State.
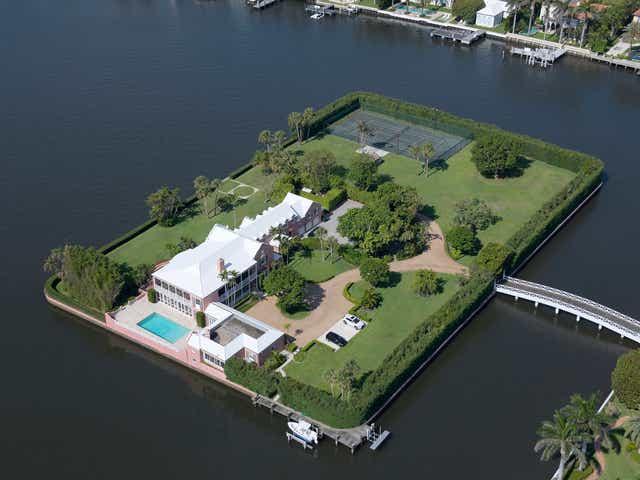
Glaser purchased 10 Tarpon Way, also known as 10 Tarpon Isle, for approximately $85 million in July and has since relisted the tiny 2.5-acre island for $120 million, or $35 million more than he paid a few months ago. The island was created by dredging crews in the 1930s and is only accessible by bridge. Glaser bought the island from private investor William M. Toll and his wife, Eileen, who paid $7.6 million for the property in 1998.
Tarpon Island
The real estate developer said potential buyers have two options: pay the $120 million now or wait ten months for a new renovation for $200 million.
Concept Drawing Of New Renovation
He said with all the hot money flowing into the Palm Beach area, “a $100 million house isn’t that crazy anymore, believe it or not,” adding that in the last 18 months, eight $100 million homes have been sold.
If a potential buyer wants to wait ten months and pay an additional $80 million. The developer will completely redesign the mansion by doubling it to 25,000 sqft, with 14 bedrooms, in addition to a hair salon, gym, and spa. A new pool, octagonal tennis pavilion, and a golf practice area will be installed on the outside.
Some ask how long will this speculation fever last as the Federal Reserve could embark on tapering its extensive bond-buying program later this year or early 2022.
One real estate expert believes the peak of the South Florida housing market could be nearing:
Dr. Ken Johnson, a real estate economist with Florida Atlantic University’s College of Business, told local news WPLG that a peak in the housing cycle could have already arrived, but he believes a crash is not in the mix because demand still outpaces supply.
It remains to be seen if some greater fool will pay the $120 million for the island mansion or $200 million tens months later after renovations.
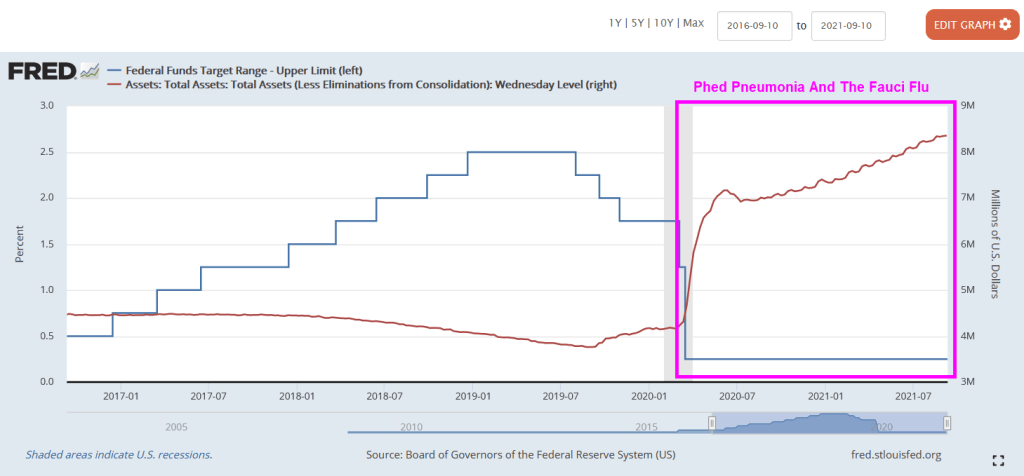
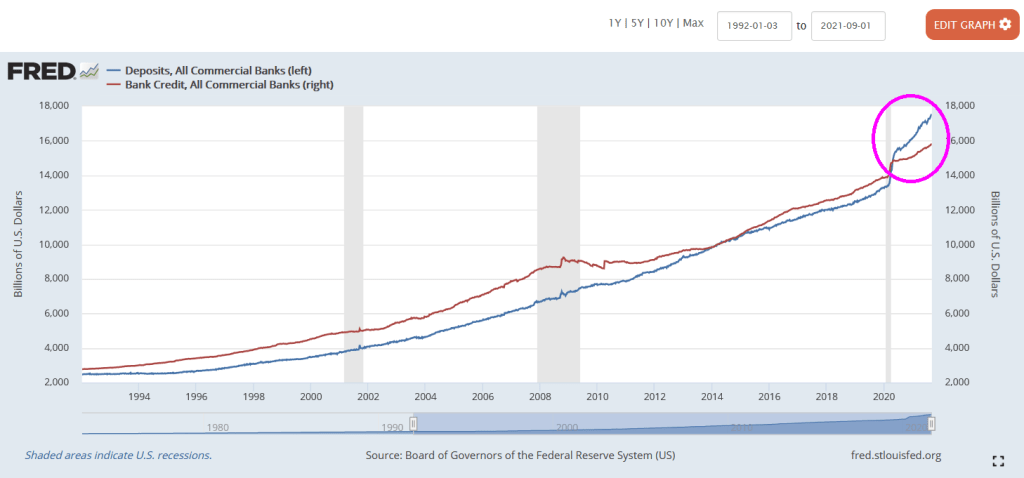
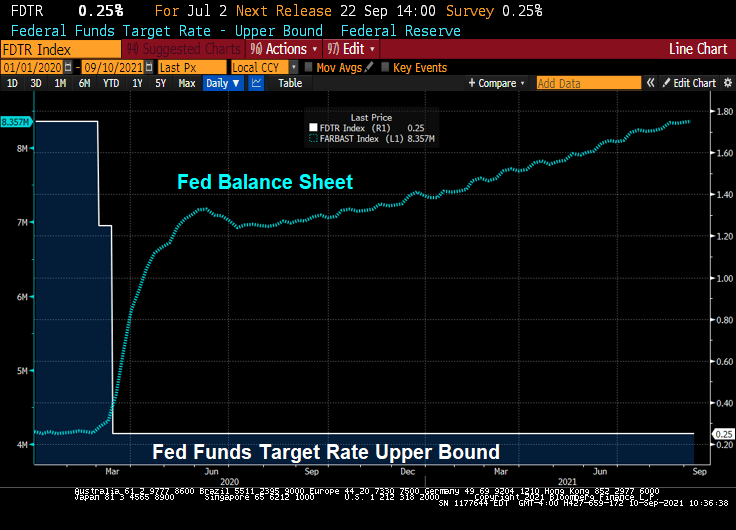
Since the Covid outbreak in early 2020, The Federal Reserve lowered their target rate and super-spiked their balance sheet. Helping to lower bank deposit rates to near zero.
But despite near zero bank deposit rates, we seeing bank deposits are larger than bank credit such as commercial and industrial loans, residential mortgages loans, car loans, etc. Normally, bank credit EXCEEDS bank deposits.
The problem? One of them is negative growth in commercial and industrial lending. It declined 13.5% YoY in August. Of course, The Federal government extended emergency business loans that were counted as C&I loans, hence the spike in C&I loan growth in May 2020. But now we are seeing a real slowdown in C&I lending.
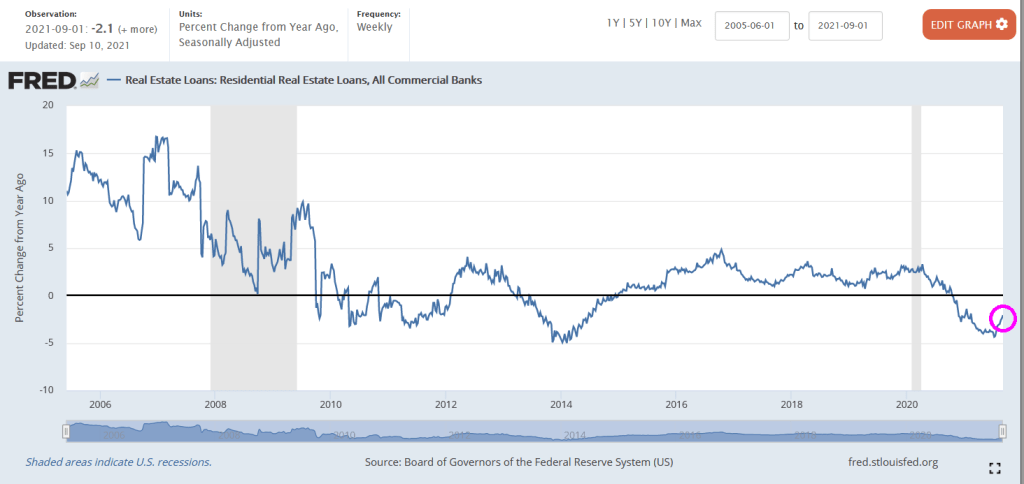
Residential lending is down 2.1% YoY as of September 10 (for August).
Commercial real estate lending? At least it is growing at a 2.9% YoY pace for August.
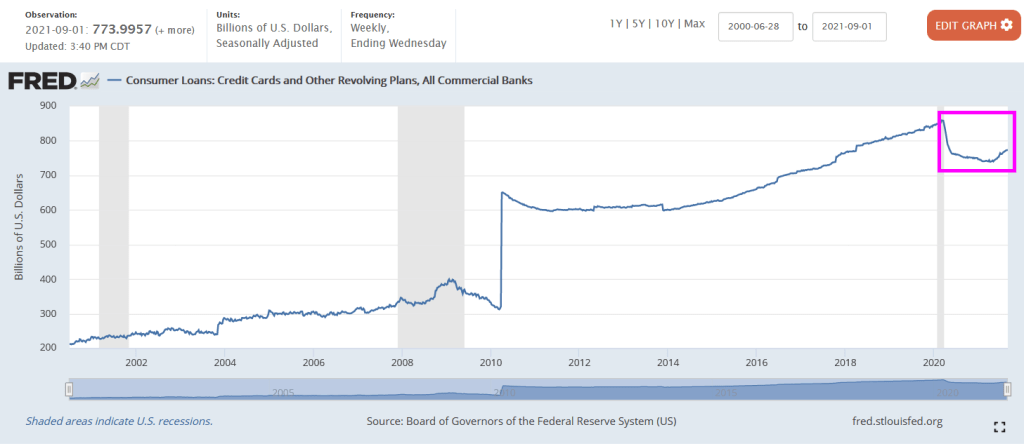
Credit cards and other revolving plans increase steadily since 2014 and then declined after the Fauci Flu struck. But credit cards and revolving credit has started to rise again.
The Fed’s massive overreaction to Covid caused a storm surge in C&I lending that has subsided. But other bank lending has slowed as well.
Lots of bank assets with nowhere to go.
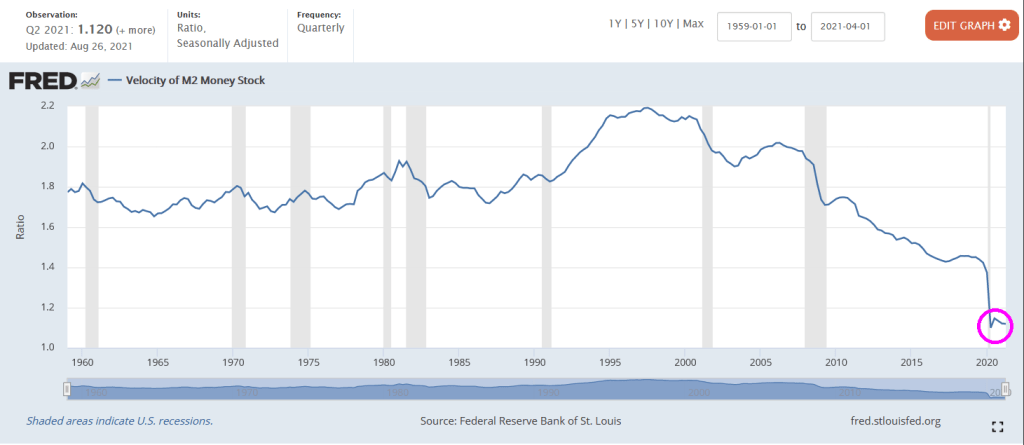
No wonder M2 Money Velocity (GDP/M2 Money) is at historic lows.
Remember, Federal Reserve Chair Jerome Powell is up for reappointment and President Biden must make a decision on his reappointment.
(Bloomberg) — Prices paid to U.S. producers increased in August by more than forecast as persistent supply chain disruptions squeeze production costs higher.
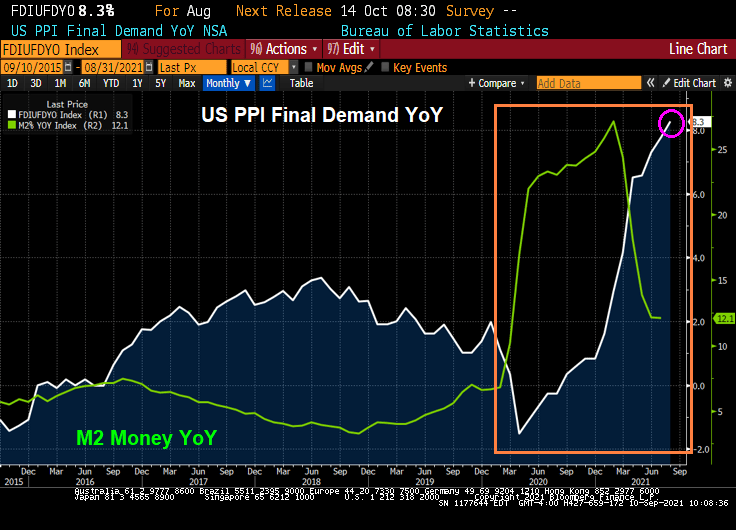
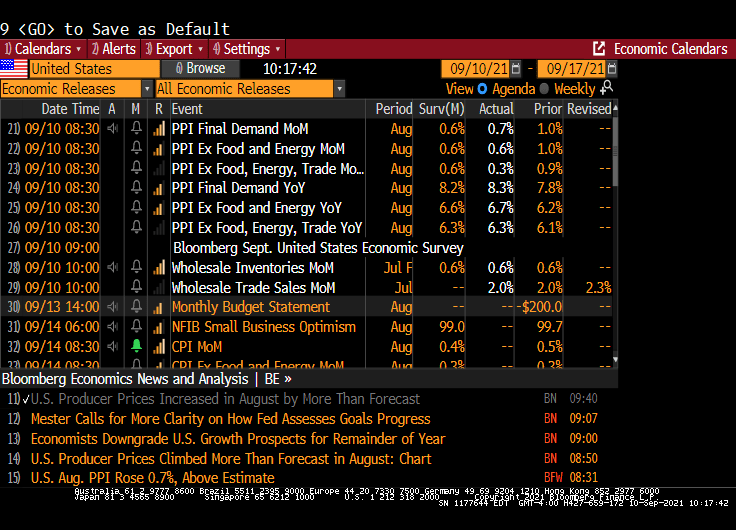
The producer price index for final demand increased 0.7% from the prior month and 8.3% from a year ago, a fresh series high, Labor Department data showed Friday. Excluding the volatile food and energy components, the so-called core PPI advanced 0.6%, and was up 6.7% from August of last year.
PPI Final Demand prices rose 8.3% YoY in August.
Given that there are shortages in the economy, why is The Federal Reserve pumping so much money into the system? It is like repeatedly flushing a clogged toilet hoping it will clear.
The correct way to clear a clogged economic toilet.
Not The Fed way of clearing clogged toilets. Pumping trillions of dollars into a clogged economic system.
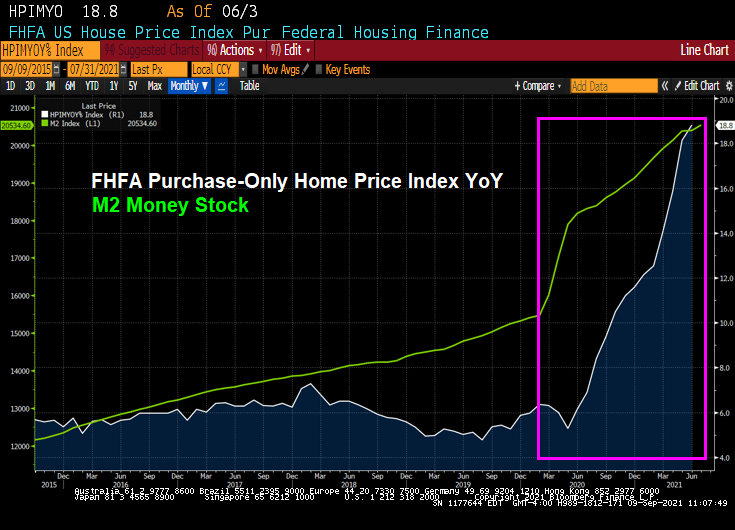
Not only after home prices screaming at near 20% YoY growth, but apartment rents are surging as well.
(Bloomberg) — Apartment rents were up in August from a year earlier in all the top 30 U.S. metro areas, the first time that’s happened since the start of the pandemic, according to a new report by Yardi.
The national average rent inmulti-family buildings rose 10.3% from a year earlier to $1,539 — the first double-digit rise in the dataset’s history — after a $25 increase in August, the real-estate firm said. Over the past 10 years, the average pace of growth has been 2%.
Zillow’s rent index of all homes is growing at 9.25% YoY.
Fed Chair Jerome “Inflation is Transitory” Powell.
Face it, the 30-year Treasury market is not as interesting as widely-traded as the 10-year Treasury market. But we did see some interesting revelations in today’s 30 year Treasury auction.
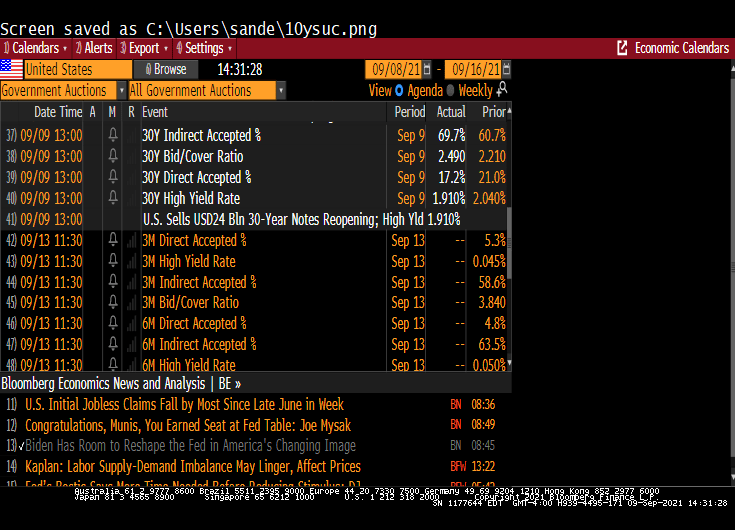
If yesterday’s 10Y auction was blockbuster, one of the strongest benchmark sales on record, then today’s $24 billion offering of 30Y paper – the last coupon auction of the week – was nothing short of spectacular.
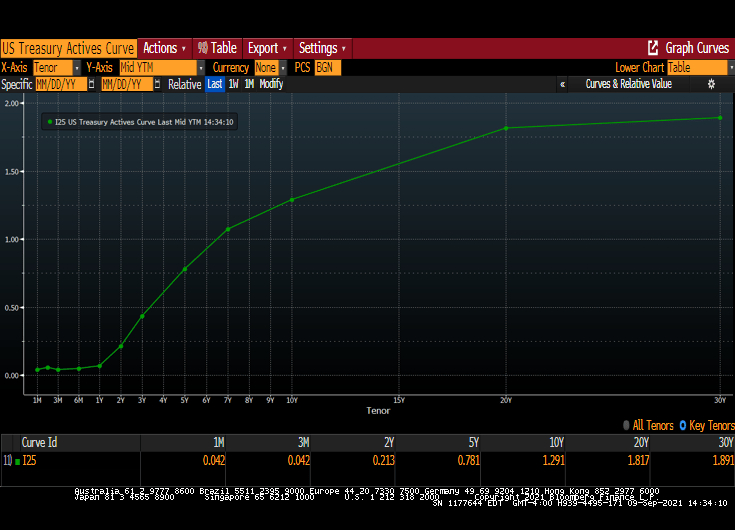
Printing at a high yield of just 1.910%, the auction not only stopped at the lowest yield since January’s 1.825%, but also stopped through the When Issued by a whopping 1.8bps, the most since April and ended 4 consecutive months of tails in the 30Y tenor.
The bid to cover of 2.486 was not only a big jump from last month’s 2.208 but also the highest since the 2.500% in July 2020, and far above the six-auction average of 2.276.
The bid-to-cover ratio is the dollar amount of bids received in a Treasury security auction versus the amount sold. The bid-to-cover ratio is an indicator of the demand for Treasury securities. A high ratio is an indication of strong demand.
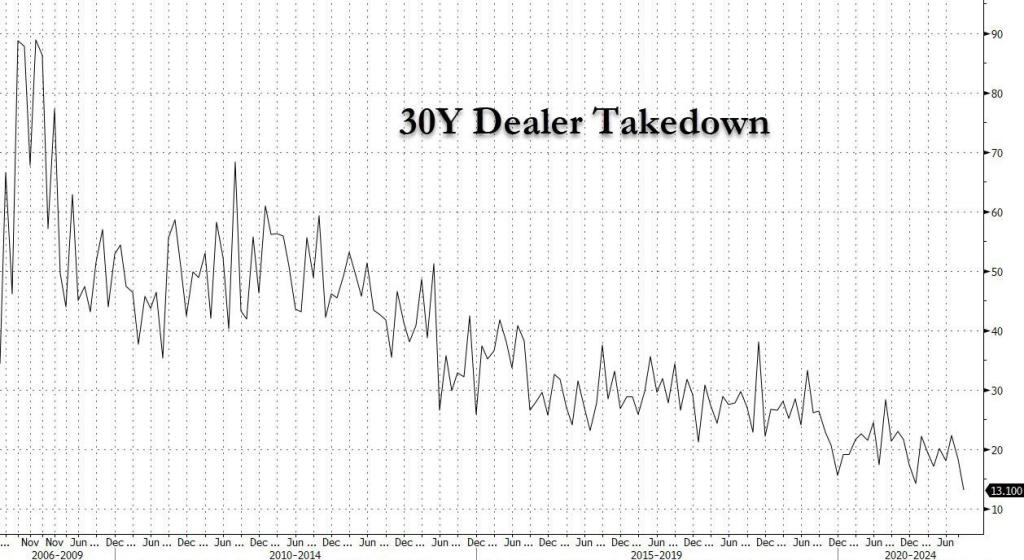
Primary dealers are responsible for absorbing any supply not bought by direct or indirect bidders. Indirect bidders, which include fund managers and foreign central banks. Dealer takedown of the 30Y Treasury is historically low.
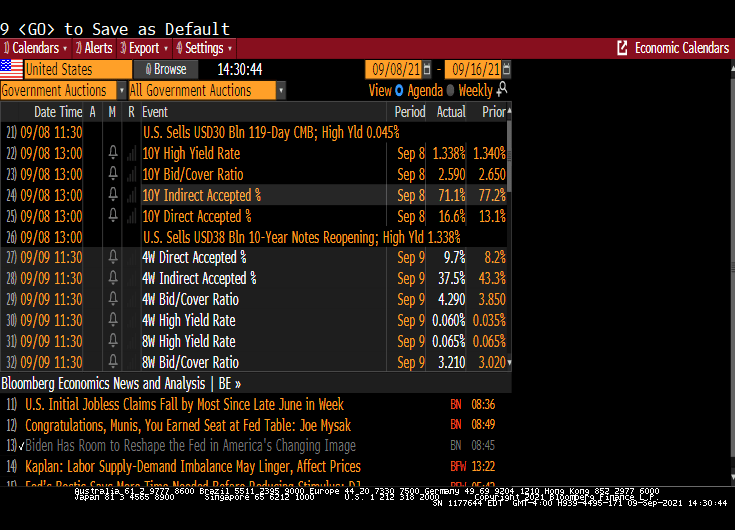
The 10-year auction was similar in that the high rate fell. But the bid-to-cover declined.
The US Treasury actives curve remains upward sloping, albeit at lower yields across the curve.
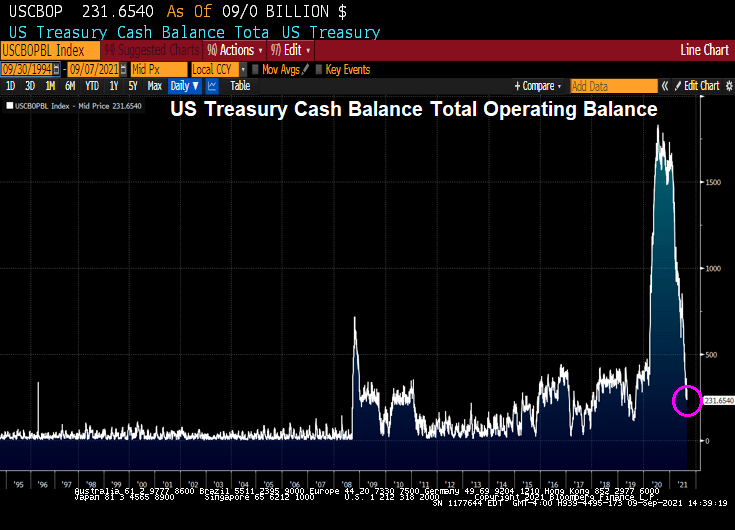
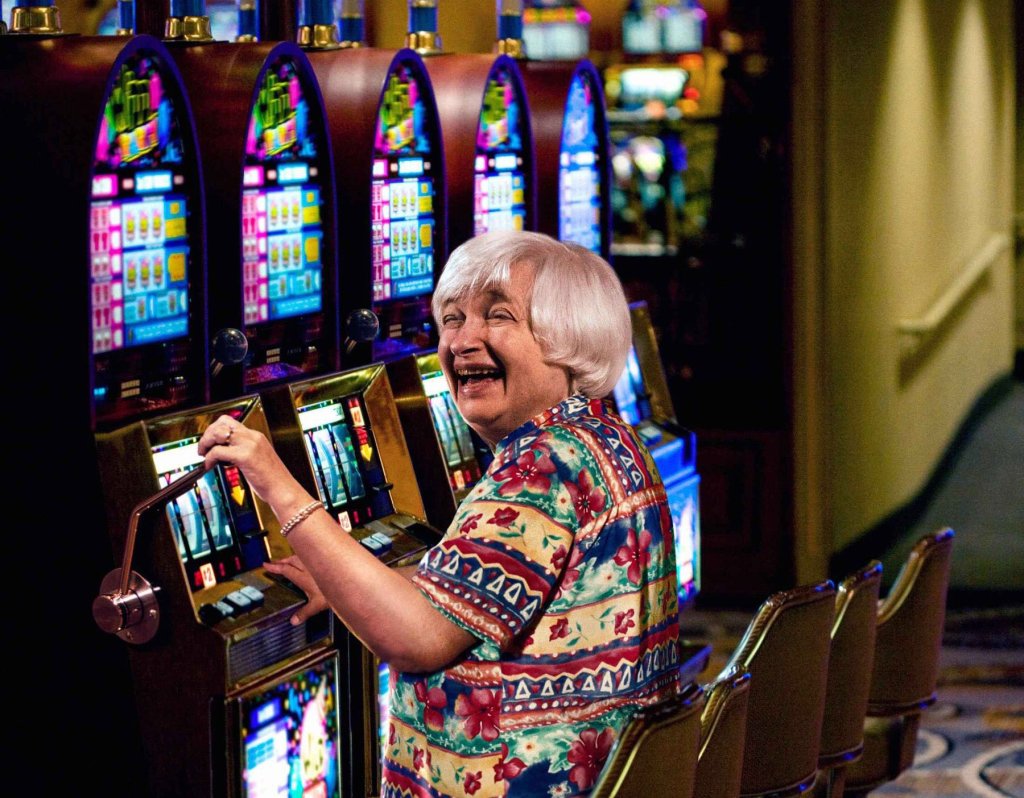
Meanwhile, Treasury Secretary Janet Yellin’ is fear-mongering about a possible US debt default. True, US Treasury cash balance has declined to $231 billion.
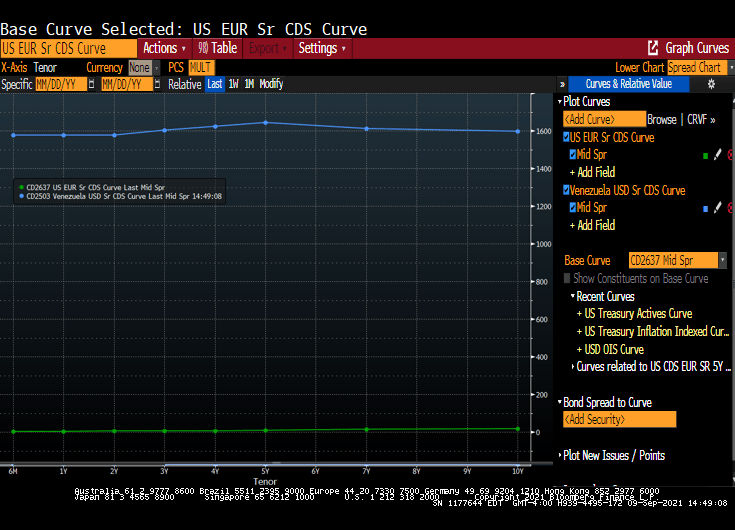
Will Congress pass a budget and fill the Treasury coffers will lots of money? Of course. Here is the US CDS curve compared to Venezuela’s CDS curve. The US curve is close to zero while Venezuela’s at near 1,600 across tenors.
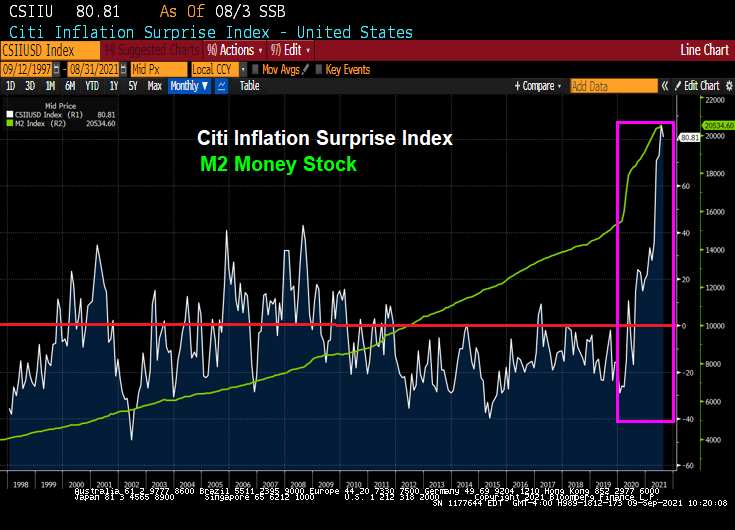
Covid struck in early 2020 and The Fed spiked the punchbowl with a massive surge in M2 Money. Like a storm surge.
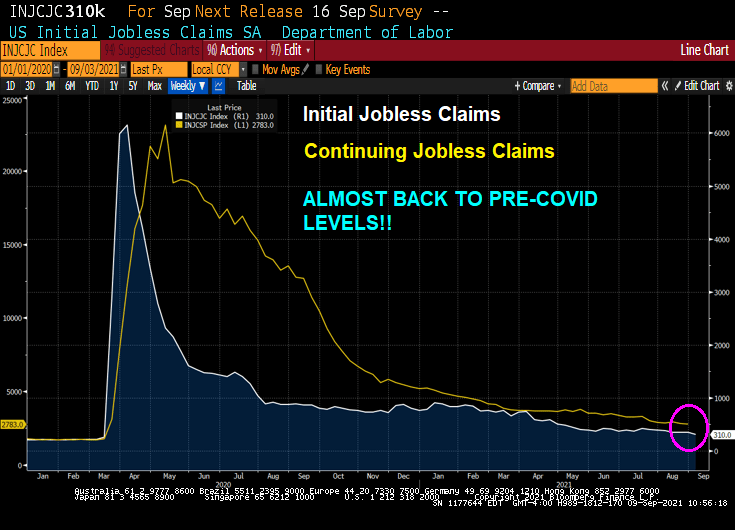
Today’s unemployment report showed initial jobless claims and continuing jobless claims ALMOST at pre-Covid levels.
So it appears that The Fed’s job is done (under the assumption that The Fed had anything to do with the recovery).
So did The Fed almost violently overreact to the Covid crisis? The Atlanta Fed’s Raphael Bostic says it is too early to withdraw while St Louis Fed’s James “Bully” Bullard says it is time to taper.
Really Raph? 18.8% price growth is not enough for you?















You must be logged in to post a comment.