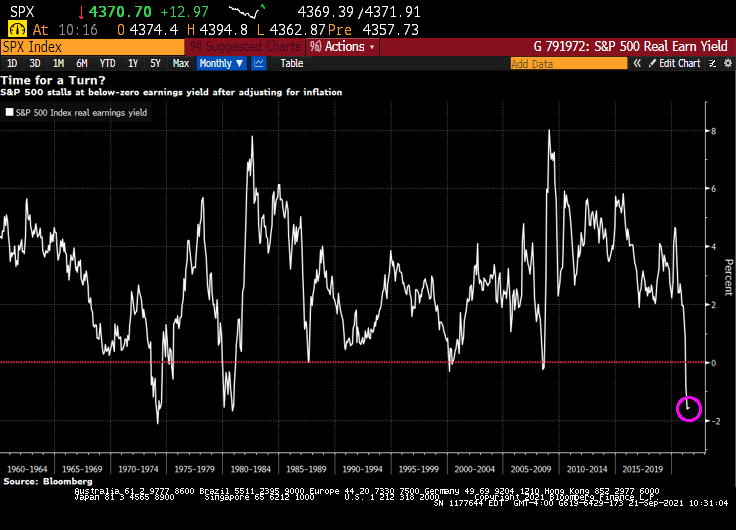
The stock market mildly rebounded from yesterday’s mild correction, but a glaring problem remains: S&P 500 real earning yields are negative.
With all the Federal government fiscal stimulus and Federal Reserve monetary stimulus, we are seeing inflation and that inflation is eating away at S&P 500 earnings yield.
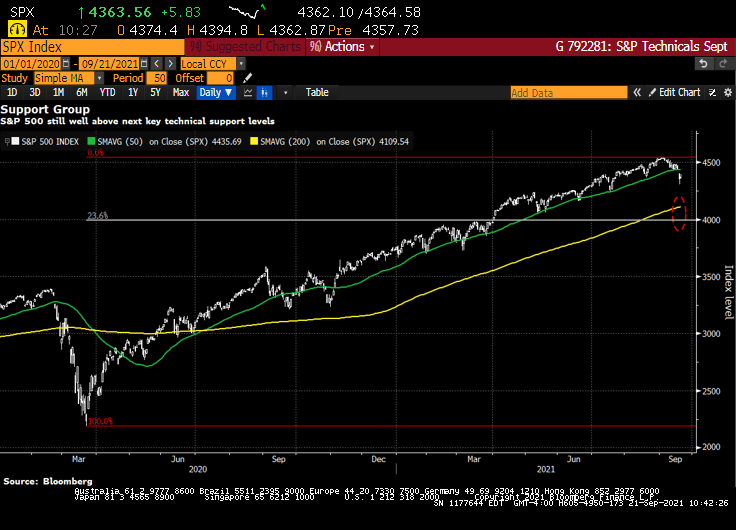
The S&P 500 is still well above key technical support levels.
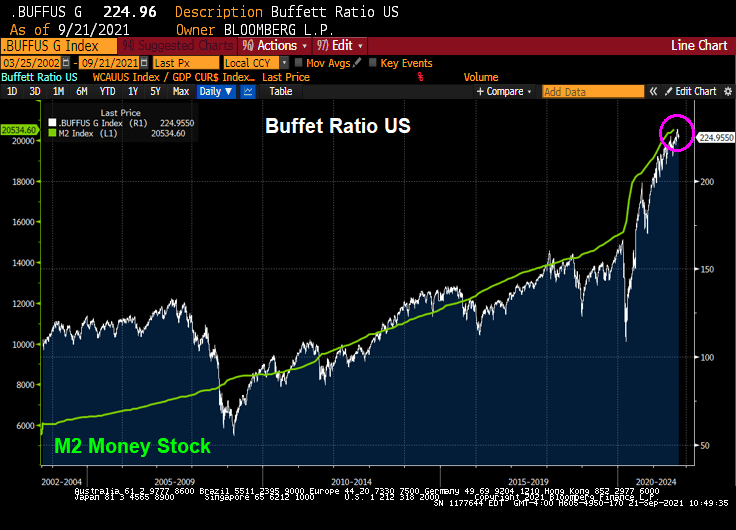
However, the Buffet ratio is raging along with Fed stimulus.
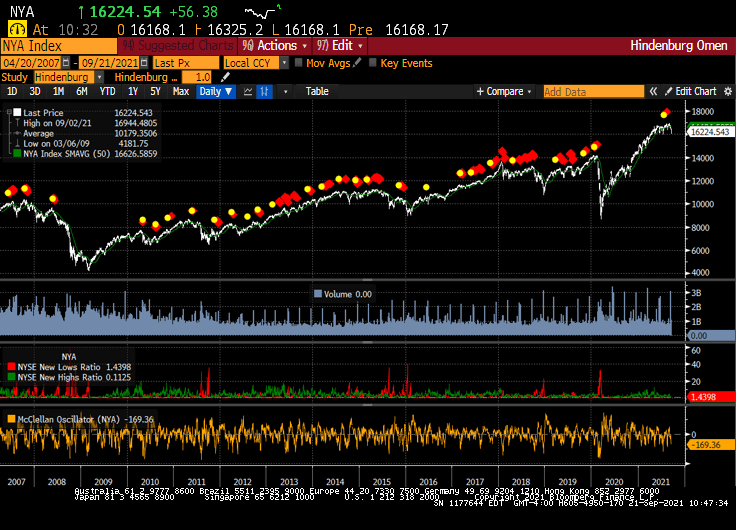
And the Hindenburg Omen is flashing RED!
The mystery of the Flying Fed is whether they will withdraw their massive monetary stimulus or not.
(Bloomberg) — The S&P 500 Index extended its decline past 2% Monday afternoon amid growing investor jitters about China’s real estate crackdown potentially sparking a financial contagion. And the Hang Seng fell 3.30% overnight.
The benchmark gauge was down 2.1% as of 12:08 p.m. in New York. All of the 11 major industry groups declined, with the energy, financials and materials sectors leading the losses. The tech-heavy Nasdaq 100 index slumped 2.4%, while the blue-chip Dow Jones Industrial Average retreated 1.9%.
By 2:33pm, the Dow is down 2.55%, NASDAQ down 3.15%.
Volatility also soared, with the Cboe Volatility Index — often called Wall Street’s “fear index” — jumping as much as 29% to 26.75, the highest level in over four months.
“While the Evergrande situation is front and center, the reality is, stock market valuations are overstretched and the market has enjoyed too long of a break from volatility and Monday’s stock market declines are not surprising,” said David Bahnsen, chief investment officer at the Bahnsen Group, a wealth management firm.
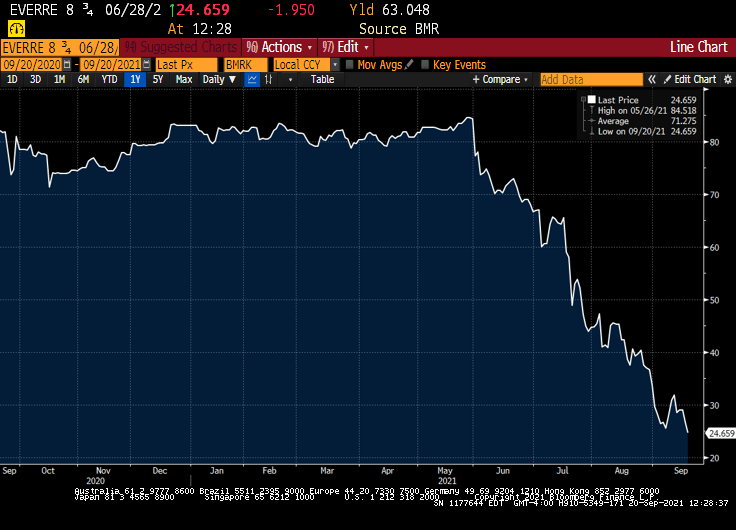
As Evergrande bonds continue to tank.
Meanwhile, most commodity prices are falling … except for UK Natural Gas Futures which are up 16.5%!
The next Federal Reserve Open Market Committee (FOMC) meeting is next week with an announcement on Wednesday, September 22nd.
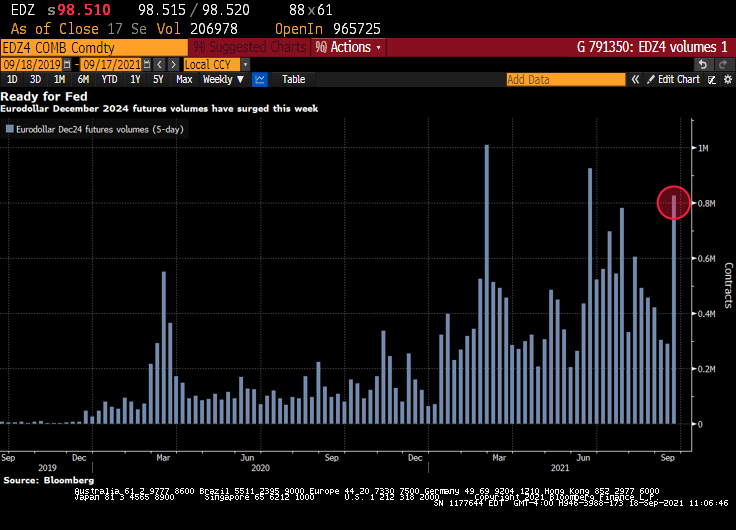
(Bloomberg) — Volume in the December 2024 eurodollar futures contract has surged Friday, approaching 200k, highest in the strip. Weekly volume exceeds 800k ahead of next week’s FOMC meeting. The December 2024 contract is a proxy for the Fed’s taper timeline, similar to the belly of the Treasuries curve (aka, the belly of the beast).
As of 2:30pm ET, nearly 197k Dec24 eurodollar contracts had traded, bringing weekly total to 816k, third most in its lifetime; notable flows on the day have included three block trades for 5k each:
The contract also appeared in curve trades including 9.3k Sep24/Dec24 3-month, 18.9k Dec23/Dec24 12-month and 24.8k Dec22/Dec24 24-month
The Dec22/Dec24 eurodollar spread has been in the spotlight since Morgan Stanley recommended the steepener in June as a way to exploit the disconnect between expectations for the pace and timing of Fed rate increases
As of today, we see a kink in the US Dollar Swaps curve at 21m.
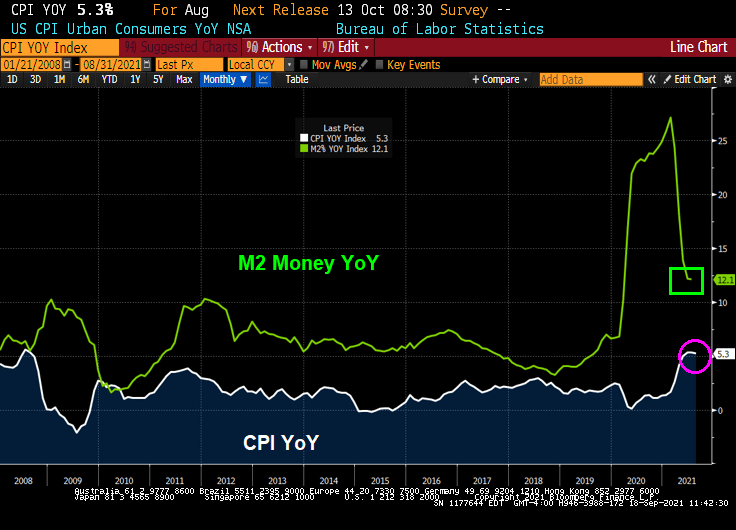
With inflation the highest since 2008, and M2 Money still growing at 12.1% YoY, it is time for The Fed to take it foot off the accelerator pedal.
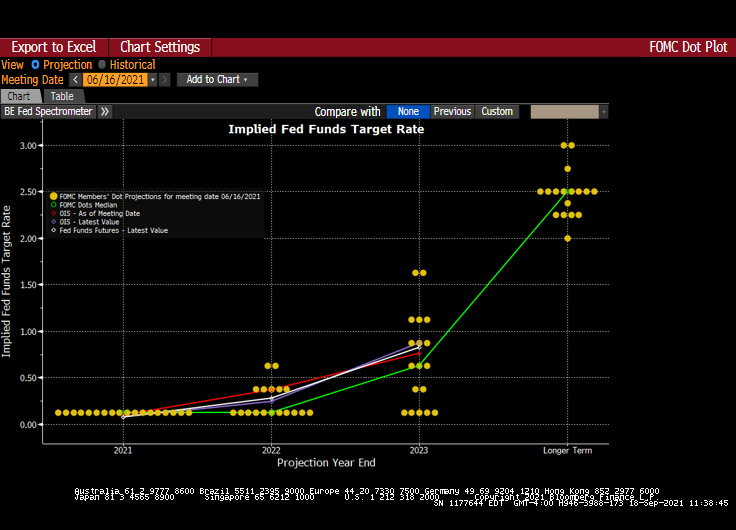
The Fed’s Dots Plot as of the last FOMC meeting indicates a willingness to let the Fed Funds Target rate start rising again after over a decade of rate suppression.
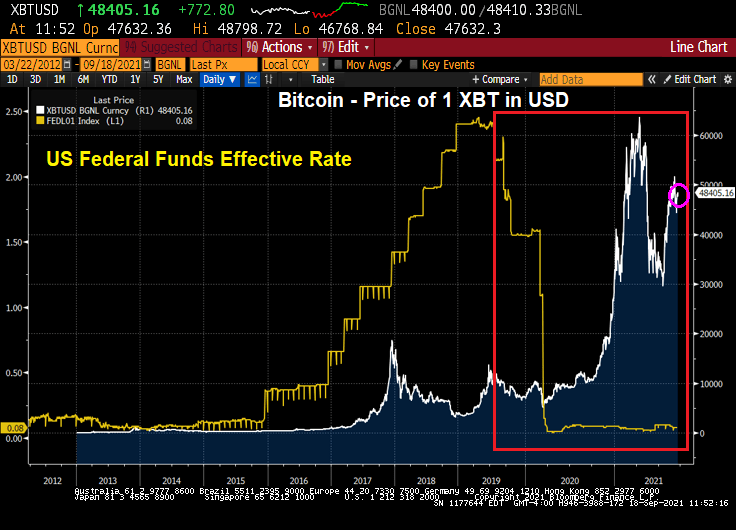
Given the fear of The Fed tapering (eventually), is it any wonders alternative investments such as Bitcoin have risen as The Fed cut rates?
This is the Steve Urkel economy where The Federal Reserve and Federal government screw everything up with their policies (or follicies) and say “Whoops! Did I do that?”
(Bloomberg) — U.S. consumer sentiment rose slightly in early September but remained close to a near-decade low, while buying conditions deteriorated to their worst since 1980 because of high prices.
The University of Michigan’s preliminary sentiment index edged up to 71 from 70.3 in August, data released Friday showed. The figure trailed the median estimate of 72 in a Bloomberg survey of economists.
Buying conditions for household durables, homes and motor vehicles all fell to the lowest in decades. The report said the declines were due to complaints about high prices. Consumers expect inflation to rise 4.7% over the coming year, matching the highest since 2008.
September’s UMich Buying Conditions for Houses fell to 60 … thanks to superheated house prices.
I can just picture Fed Chair Jerome Powell channeling Steve Urkel and saying “Whoops!! Did I do that?”
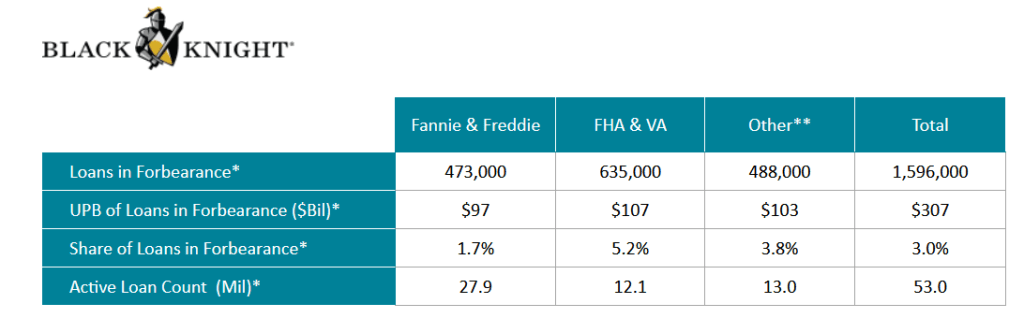
The Covid epidemic hit the single-family mortgage market hard in early 2020, leading mortgage lenders and servicers to offer FORBEARANCE to borrowers who were having trouble making their mortgage payments due to loss of hours or a loss of job.
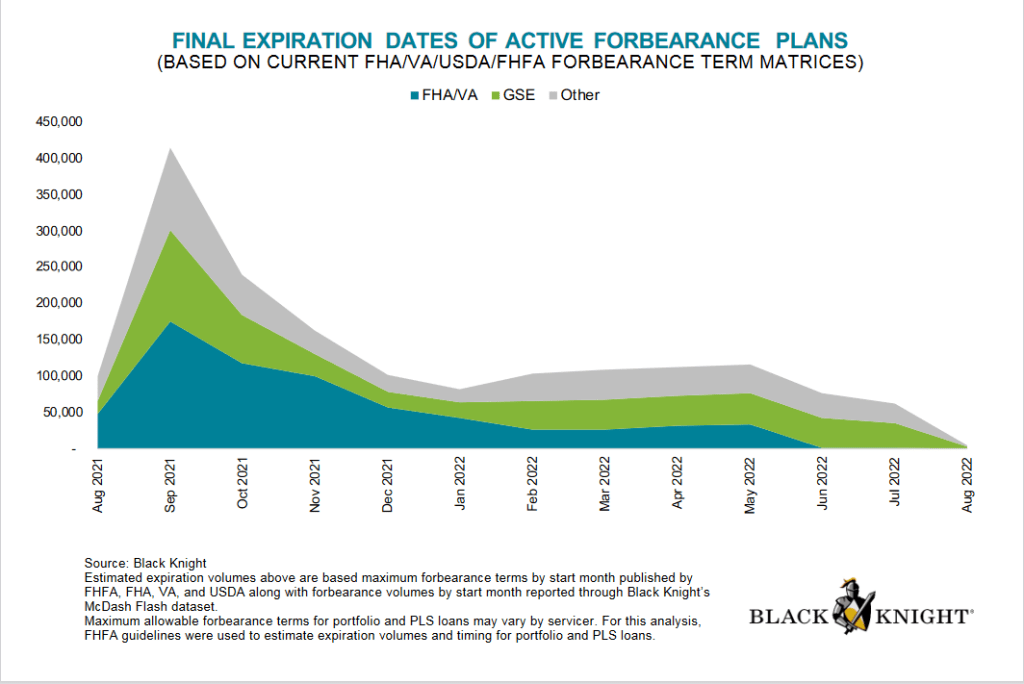
The good news? Active forbearance plans are much lower today than at their peak after the Covid epidemic struck in early 2020 with active forbearance plans peaking in May 2020.
Forbearance plans are due to expire in
What is forbearance, you ask? Forbearance is when a mortgage servicer or lender allows a borrower to temporarily pay their mortgage at a lower payment or pause paying your mortgage. The borrower will have to pay the payment reduction or the paused payments back later.
Despite forbearance, Fannie Mae still reported $7.2 billion in net income in Q2 2021. Notice the difference between single-family SDQ and the SDQ rate without forbearance. Freddie Mac reported $3.7 billion in Q2 2021 net income.
Here is a look at Fannie Mae’s net income over the past year and SDQ rates.
Under the existing seller/servicer eligibility requirements, the Agency SDQ Rate is defined as 100 multiplied by (the UPB of mortgage loans 90 days or more delinquent or in foreclosure for Fannie Mae, Freddie Mac, and Ginnie Mae/Total UPB of mortgage loans serviced for Fannie Mae, Freddie Mac, and Ginnie Mae). Beginning with the financial quarter ending Jun. 30, 2020, the Agency SDQ Rate will include an adjustment for mortgage loans in a COVID-19-related forbearance plan that are 90 days or more delinquent and were current at the inception of the COVID-19-related forbearance plan. The UPB of such mortgage loans shall be multiplied by .30 and added to the UPB for SDQ mortgage loans for the purposes of determining the numerator in the calculation of the Agency SDQ Rate.
The US Bureau of Labor Statistics released their Real Earnings Report for August yesterday. And is it pretty depressing for US workers.
Real average hourly earnings for all employees increased 0.4 percent from July to August, seasonally adjusted. This result stems from an increase of 0.6 percent in average hourly earnings combined with an increase of 0.3 percent in the Consumer Price Index for All Urban Consumers (CPI-U).
Real average weekly earnings increased 0.3 percent over the month due to the change in real average hourly earnings combined with no change in the average workweek.
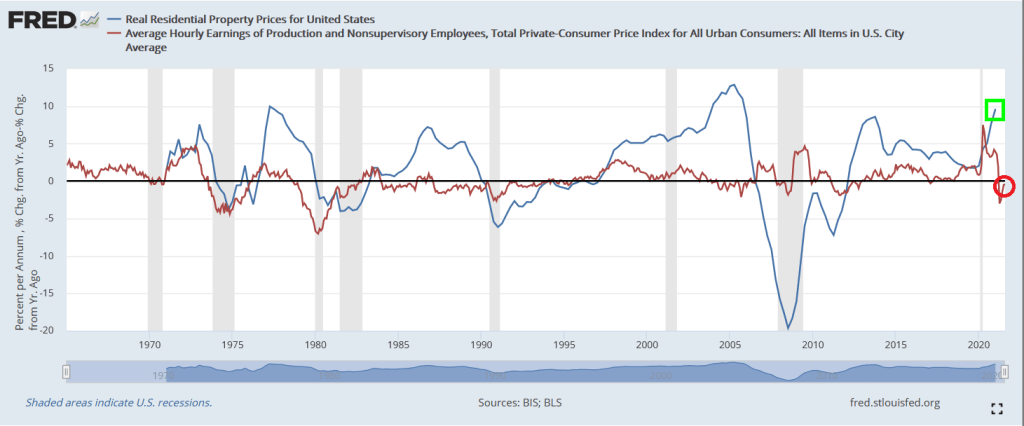
If we look at REAL US housing prices versus REAL average hourly earnings for production and nonsupervisory employees, we can see waves of imbalance between the two measures (also known as “bubbles”). Such as today.
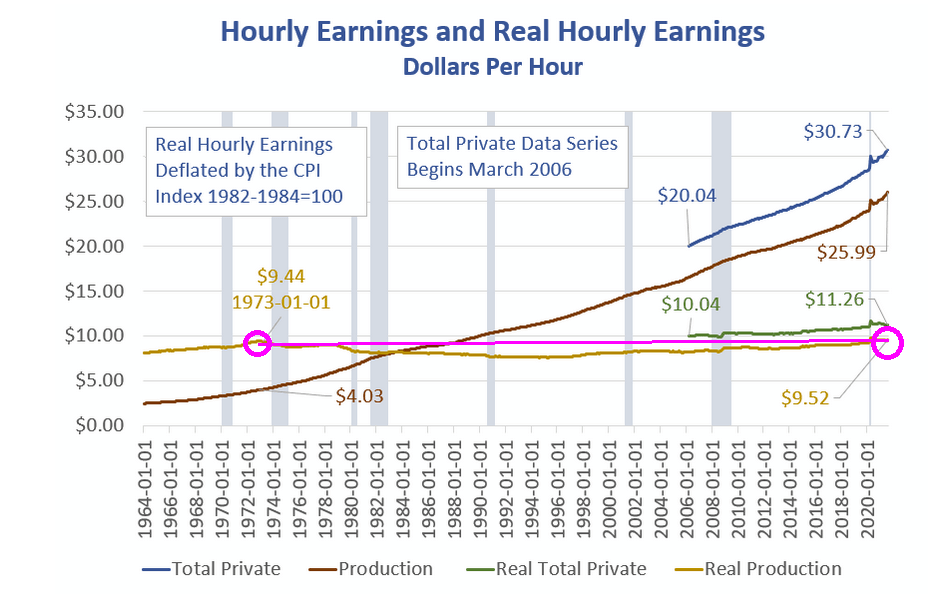
But the real horror chart is the following (courtesy of Mish). It shows that real hourly earnings have barely changed since January 1973.
Of course, labor outsourcing to lower labor cost countries is the chief culprit. Karsten Manufacturing, maker of Ping golf clubs, no longer makes their castings in Phoenix AZ thanks, in part, to EPA regulations. Ping clubheads are now made in Asia.
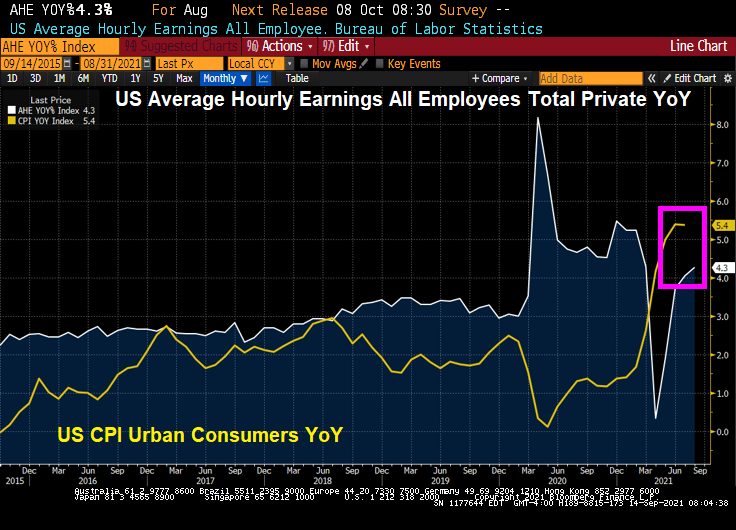
US inflation remained about the same in August as it was in July. CPI YoY fell ever so slightly from 5.4% in July to 5.3% in August. Real hourly earnings remain negative.
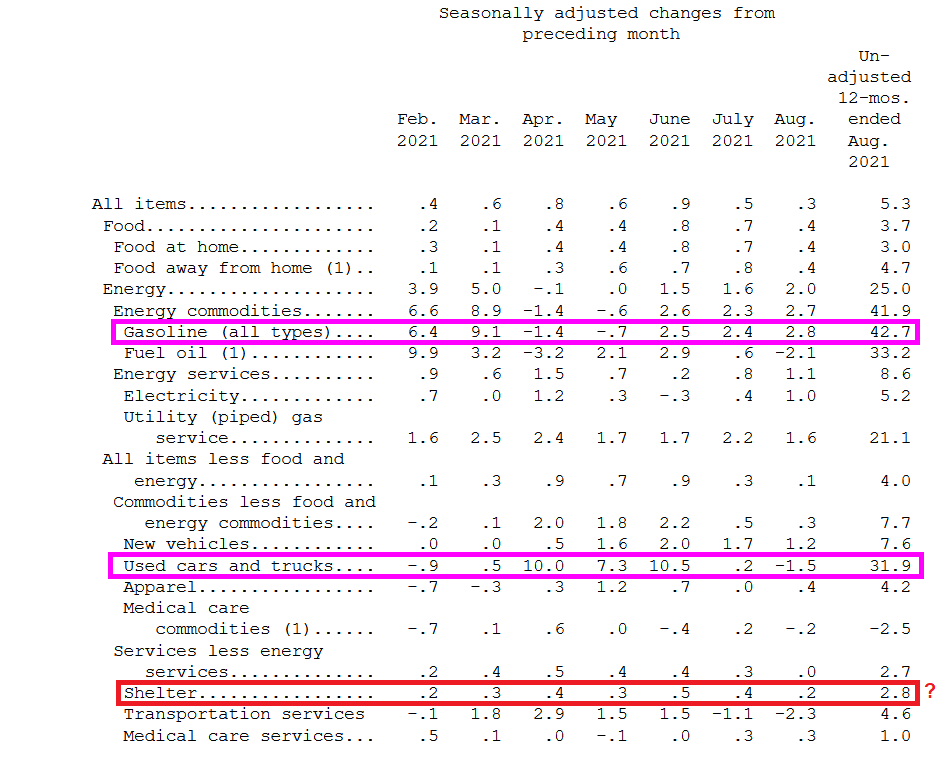
The source of consumer inflation? Gasoline prices rose 42.7% YoY while used cars and trucks rose 31.9% YoY.
Shelter rose 2.8% YoY. That is odd since the Case-Shiller national price index is growing at a torrid 18.61% YoY pace and the Zillow Rent Index YoY has recovered to a sizzling 9.24% YoY pace.
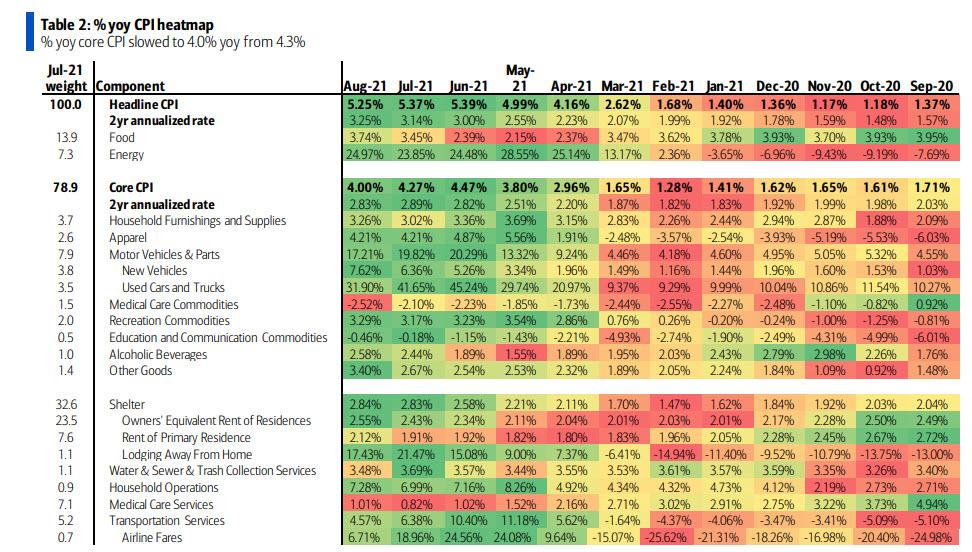
The YoY heatmap of inflation.
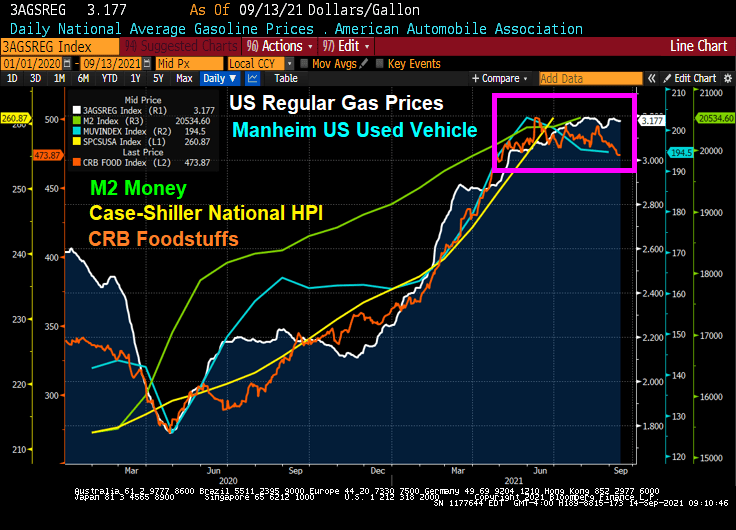
However, with the exception of home prices and rent, we are seeing a slowing of used car, foodstuffs and regular gas prices over the summer.
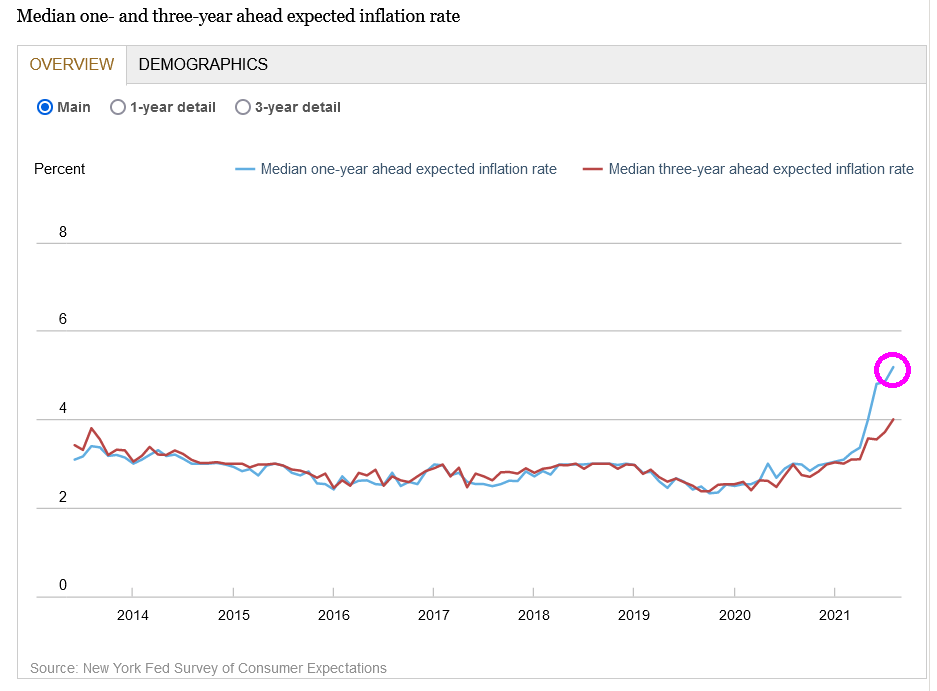
In its August Survey of Consumer Expectations, the bank said Monday that respondents see inflation a year from now at 5.2%, up from 4.9% the prior month. Three years from now, it is expected to be at 4%, up from 3.7% in July. Both readings mark record-high readings for data that goes back to 2013.
It is a shame that in that last reading that the CPI YoY exceeded Average Hourly Earnings YoY by a 5.4% to 4.3% margin.
Yes, inflation is hot, hot, hot and consumers are feeling it.
The South Florida housing market is sizzling with hot money from the North East, pushing up homes values sky high over the last year. One example of the mania is in Palm Beach, where a private island was bought in July and was relisted months later for a whopping 41% premium, according to WSJ.
One of Miami’s top real estate developers, Todd Michael Glaser, is taking advantage of the bubble, fueled by Wall Street bankers and other elites who have the economic mobility to leave the Northeast for the Sunshine State.
Glaser purchased 10 Tarpon Way, also known as 10 Tarpon Isle, for approximately $85 million in July and has since relisted the tiny 2.5-acre island for $120 million, or $35 million more than he paid a few months ago. The island was created by dredging crews in the 1930s and is only accessible by bridge. Glaser bought the island from private investor William M. Toll and his wife, Eileen, who paid $7.6 million for the property in 1998.
Tarpon Island
The real estate developer said potential buyers have two options: pay the $120 million now or wait ten months for a new renovation for $200 million.
Concept Drawing Of New Renovation
He said with all the hot money flowing into the Palm Beach area, “a $100 million house isn’t that crazy anymore, believe it or not,” adding that in the last 18 months, eight $100 million homes have been sold.
If a potential buyer wants to wait ten months and pay an additional $80 million. The developer will completely redesign the mansion by doubling it to 25,000 sqft, with 14 bedrooms, in addition to a hair salon, gym, and spa. A new pool, octagonal tennis pavilion, and a golf practice area will be installed on the outside.
Some ask how long will this speculation fever last as the Federal Reserve could embark on tapering its extensive bond-buying program later this year or early 2022.
One real estate expert believes the peak of the South Florida housing market could be nearing:
Dr. Ken Johnson, a real estate economist with Florida Atlantic University’s College of Business, told local news WPLG that a peak in the housing cycle could have already arrived, but he believes a crash is not in the mix because demand still outpaces supply.
It remains to be seen if some greater fool will pay the $120 million for the island mansion or $200 million tens months later after renovations.
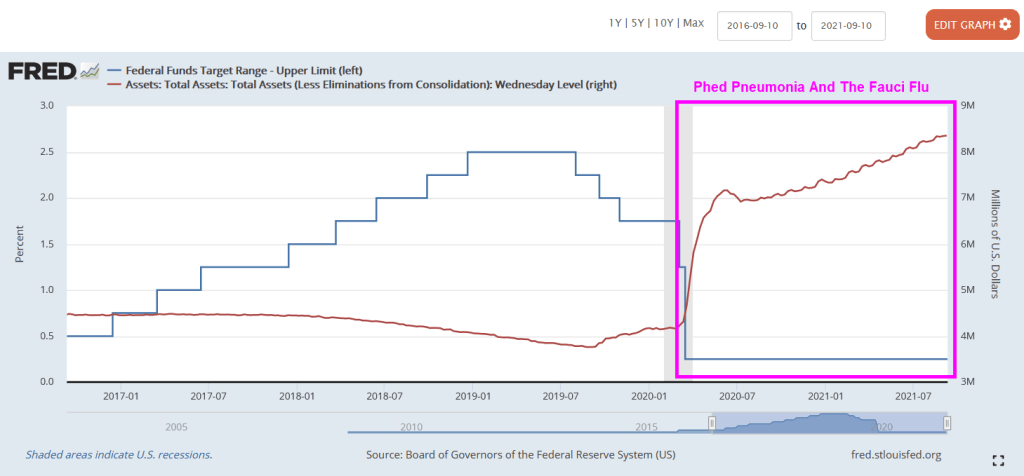
Since the Covid outbreak in early 2020, The Federal Reserve lowered their target rate and super-spiked their balance sheet. Helping to lower bank deposit rates to near zero.
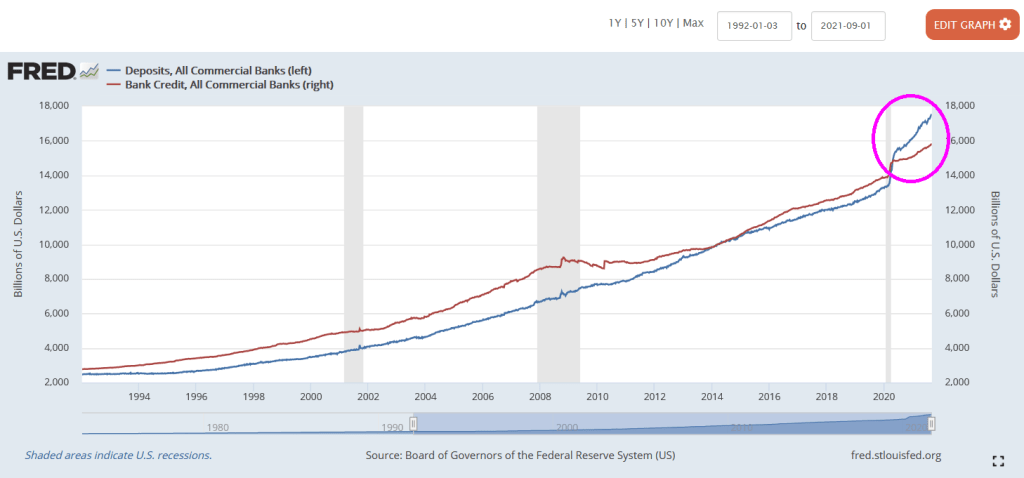
But despite near zero bank deposit rates, we seeing bank deposits are larger than bank credit such as commercial and industrial loans, residential mortgages loans, car loans, etc. Normally, bank credit EXCEEDS bank deposits.
The problem? One of them is negative growth in commercial and industrial lending. It declined 13.5% YoY in August. Of course, The Federal government extended emergency business loans that were counted as C&I loans, hence the spike in C&I loan growth in May 2020. But now we are seeing a real slowdown in C&I lending.
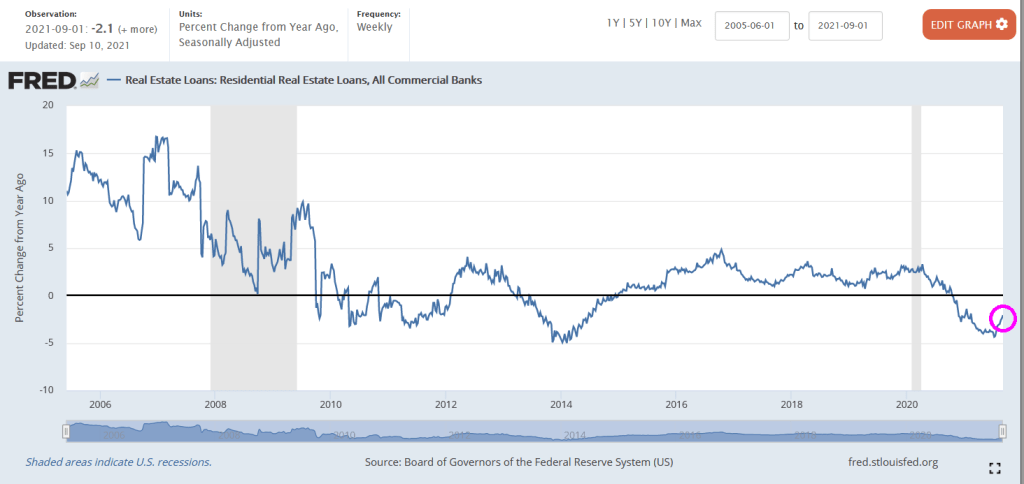
Residential lending is down 2.1% YoY as of September 10 (for August).
Commercial real estate lending? At least it is growing at a 2.9% YoY pace for August.
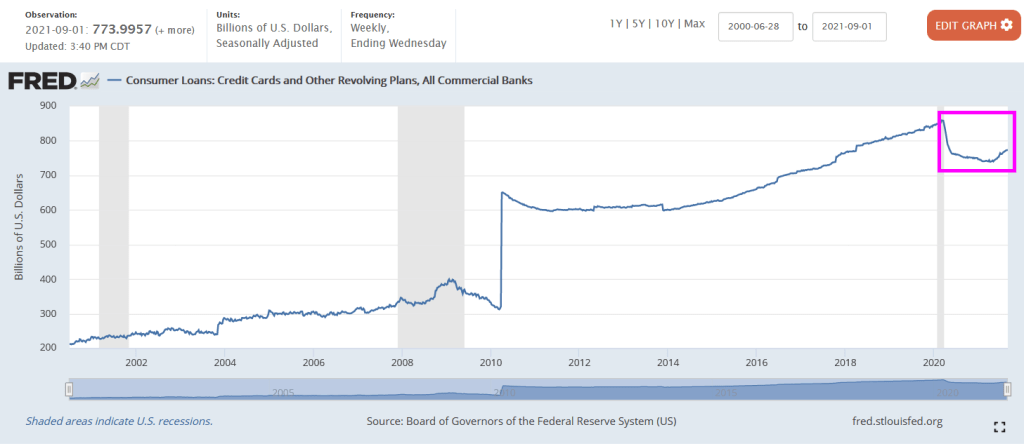
Credit cards and other revolving plans increase steadily since 2014 and then declined after the Fauci Flu struck. But credit cards and revolving credit has started to rise again.
The Fed’s massive overreaction to Covid caused a storm surge in C&I lending that has subsided. But other bank lending has slowed as well.
Lots of bank assets with nowhere to go.
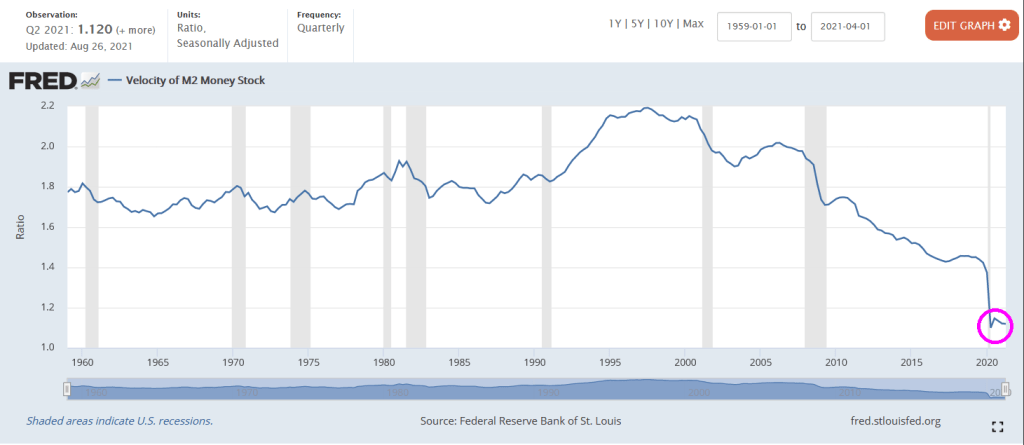
No wonder M2 Money Velocity (GDP/M2 Money) is at historic lows.
Remember, Federal Reserve Chair Jerome Powell is up for reappointment and President Biden must make a decision on his reappointment.

























You must be logged in to post a comment.