Shutdown!
Mortgage applications decreased 12.7 percent from one week earlier, according to data from the Mortgage Bankers Association’s (MBA) Weekly Mortgage Applications Survey for the week ending September 26, 2025.
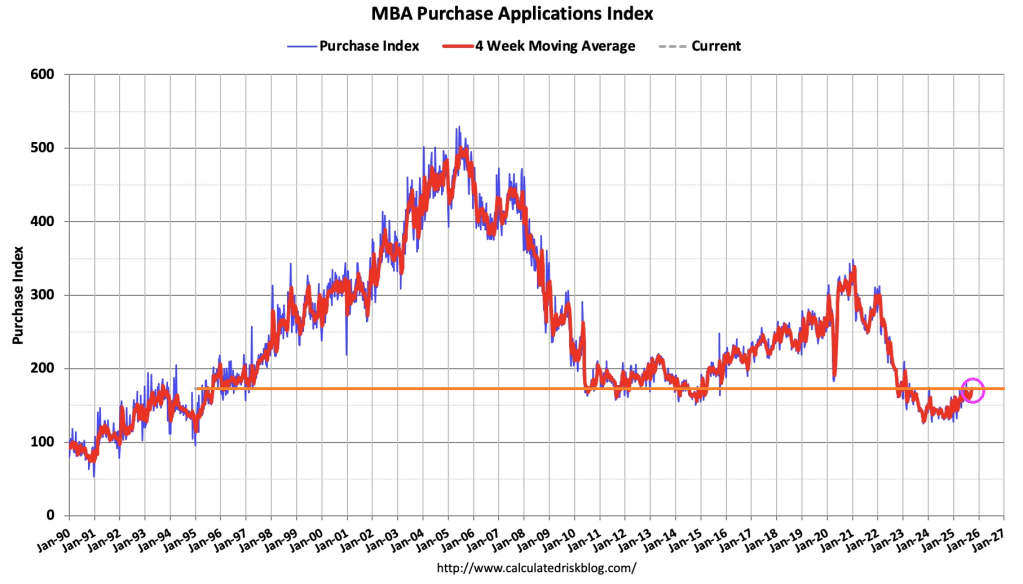
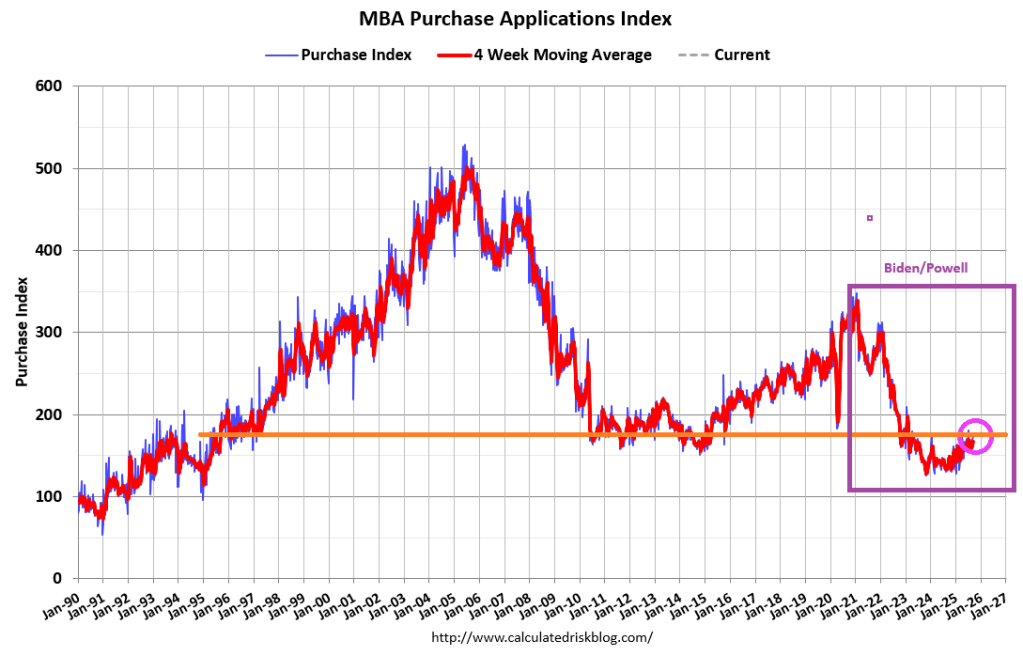
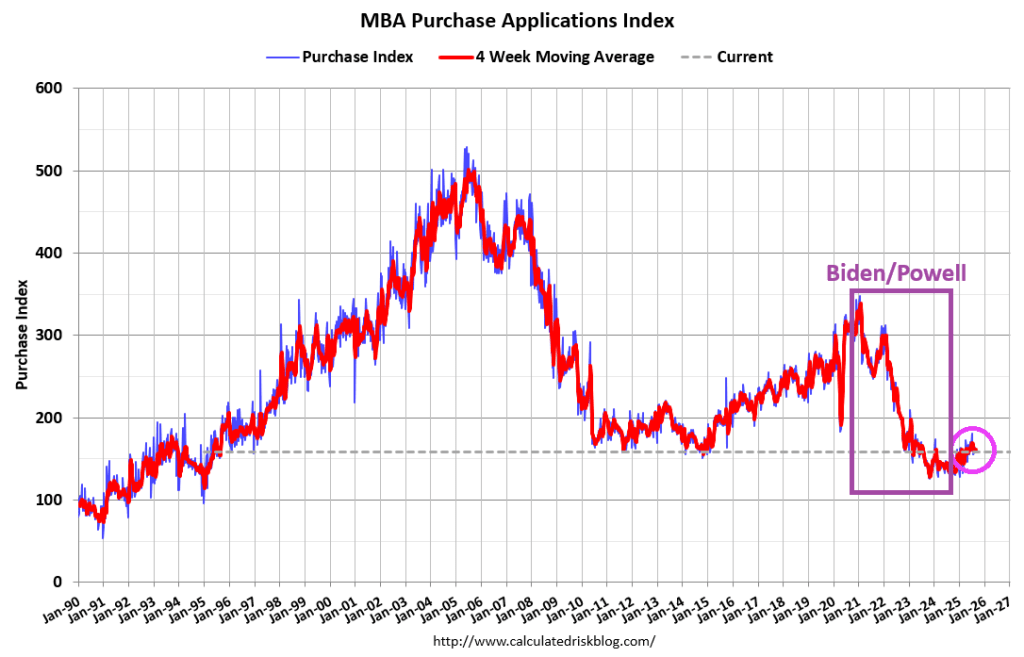
The Market Composite Index, a measure of mortgage loan application volume, decreased 12.7 percent on a seasonally adjusted basis from one week earlier. On an unadjusted basis, the Index decreased 13 percent compared with the previous week. The seasonally adjusted Purchase Index decreased 1 percent from one week earlier. The unadjusted Purchase Index decreased 2 percent compared with the previous week and was 16 percent higher than the same week one year ago.
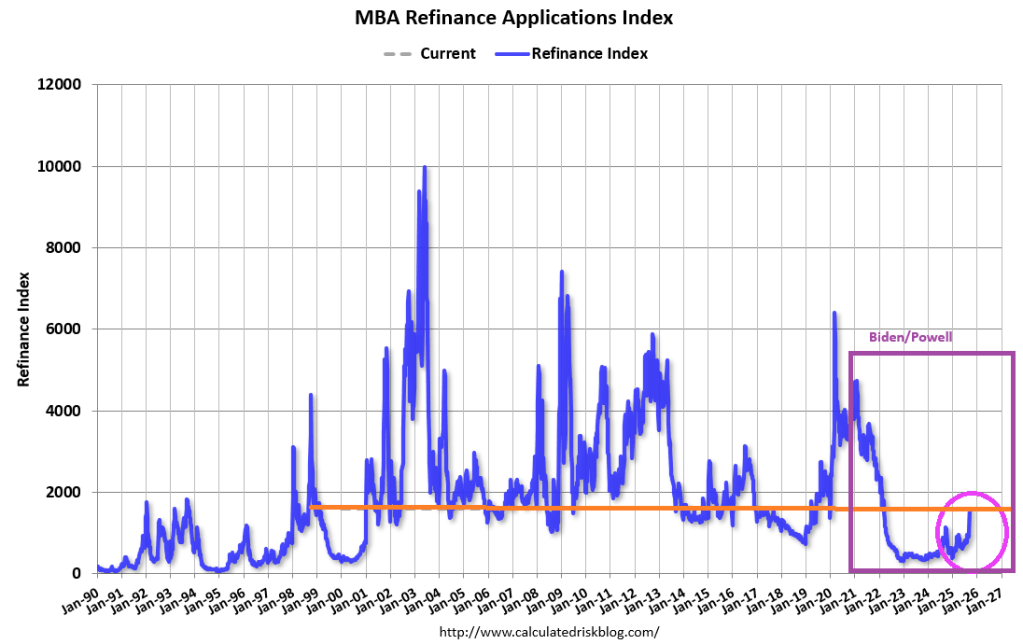
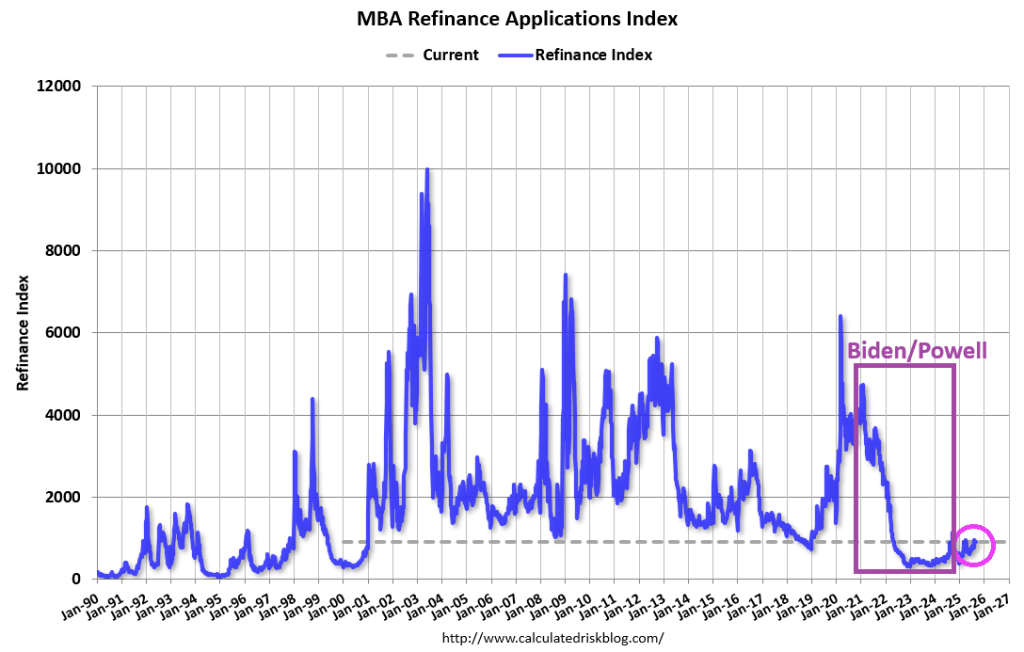
The Refinance Index decreased 21 percent from the previous week and was 16 percent higher than the same week one year ago.
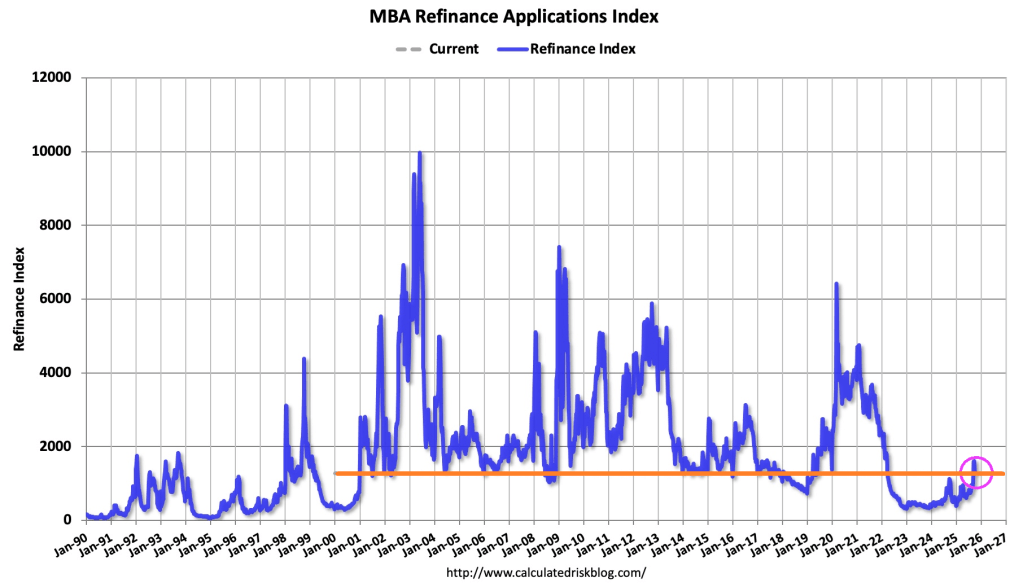
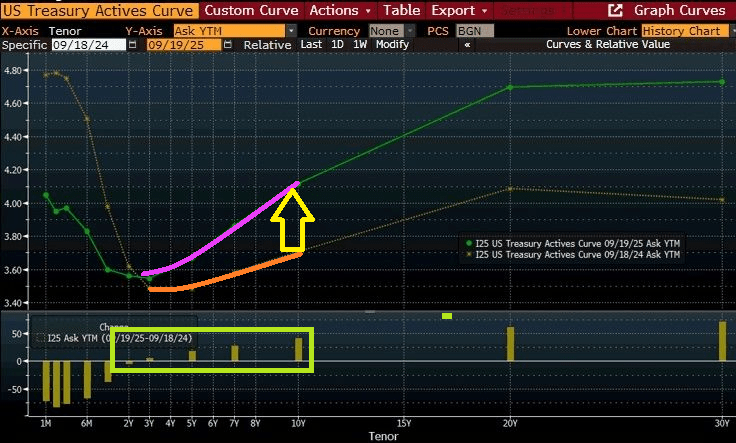
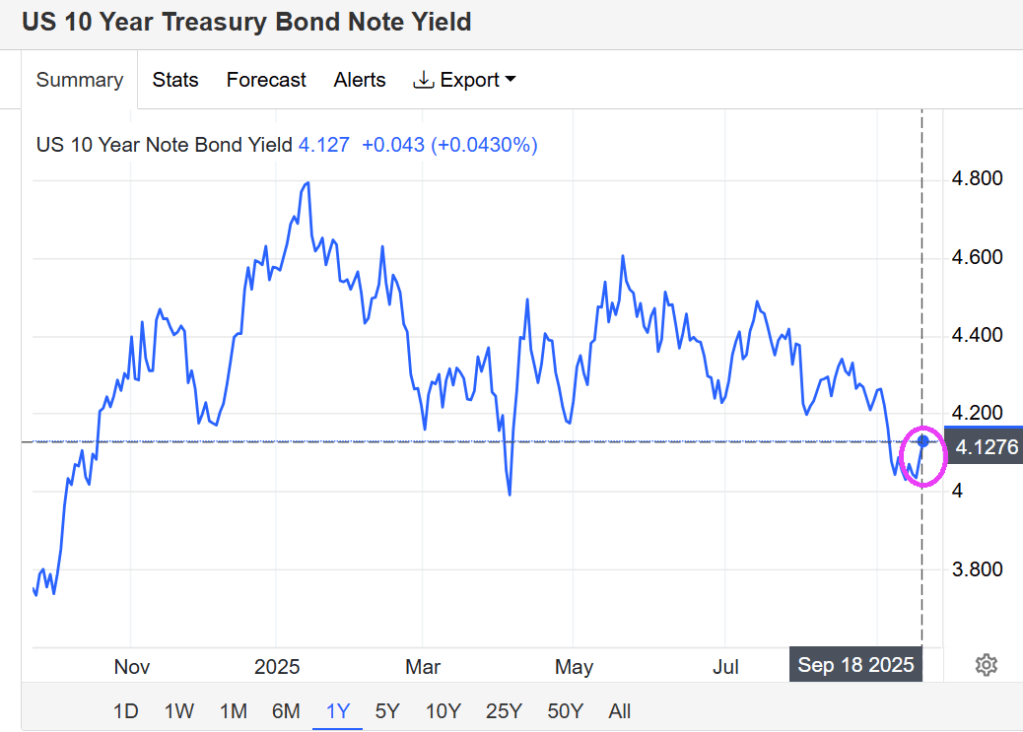
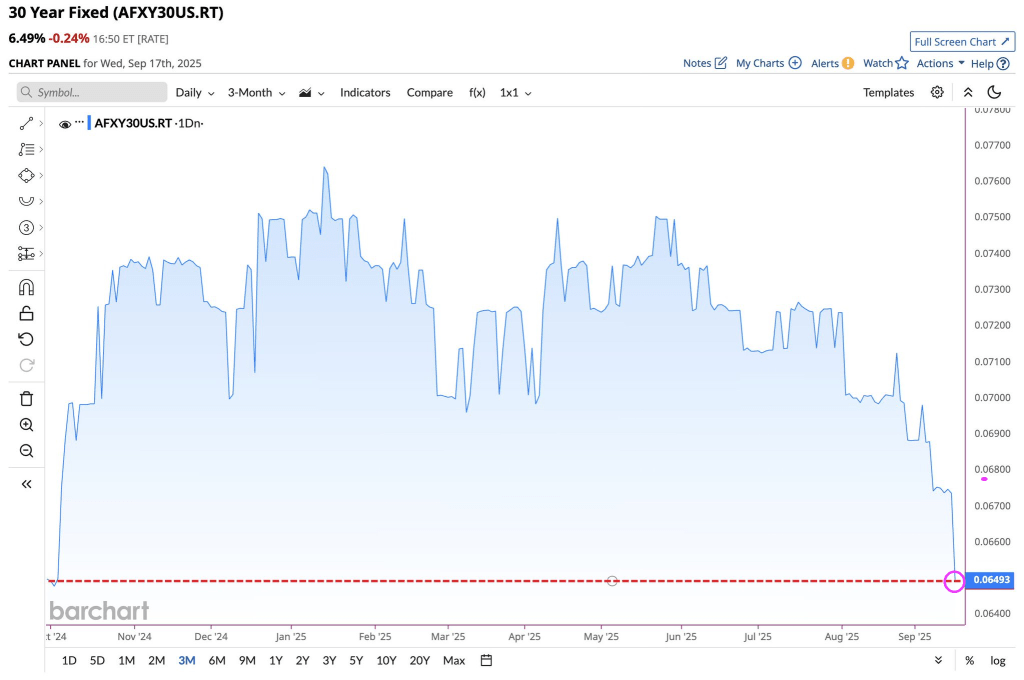
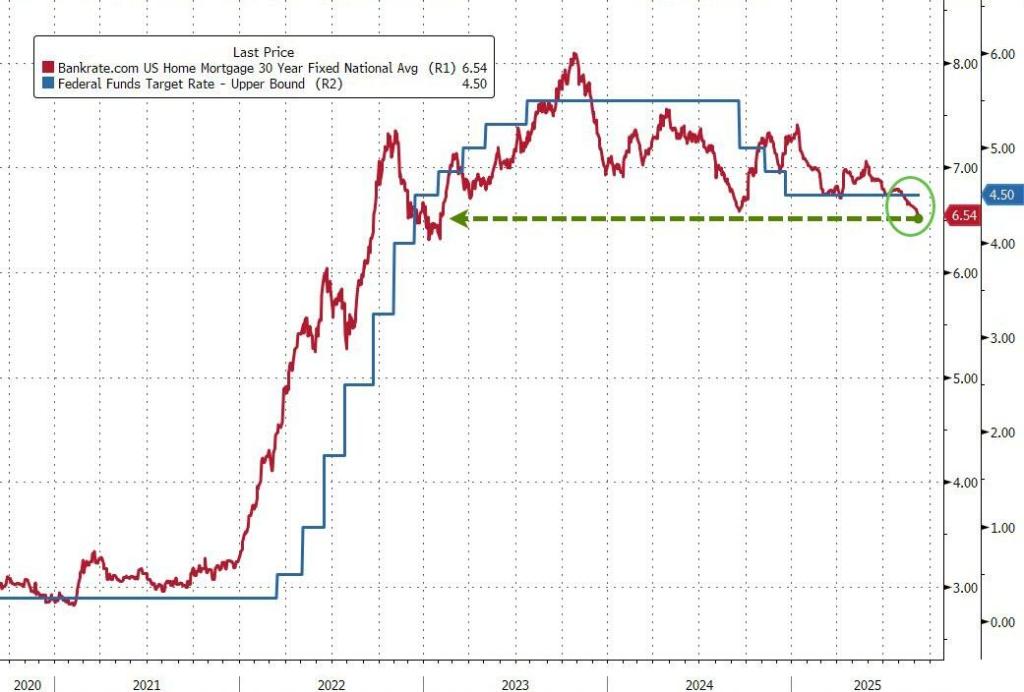
Mortgage rates increased to its highest level in three weeks as Treasury yields pushed higher on recent, stronger than expected economic data. After the burst in refinancing activity over the past month, this reversal in mortgage rates led to a sizeable drop in refinance applications, consistent with the view that refinance opportunities this year will be short-lived.
Yes, the Federal government has shut down.


You must be logged in to post a comment.