Can You Spot The Fed’s Policy Errors? The Fed And Fannie/Freddie’s Demise After 3 Fed Policy Errors (We Are Now In PE5!)

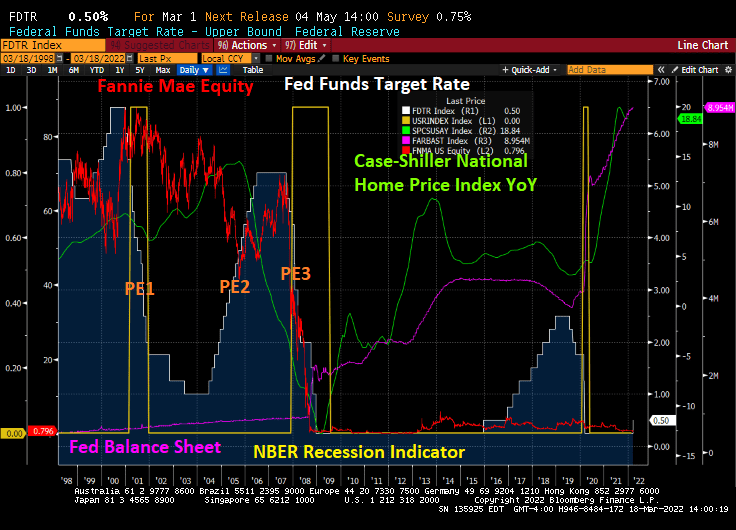
The Federal Reserve is not mentioned in the movies “The Big Short” or “Margin Call”, but The Fed’s policy errors played a big role in the demise of Fannie Mae’s and Freddie Mac’s equity prices.

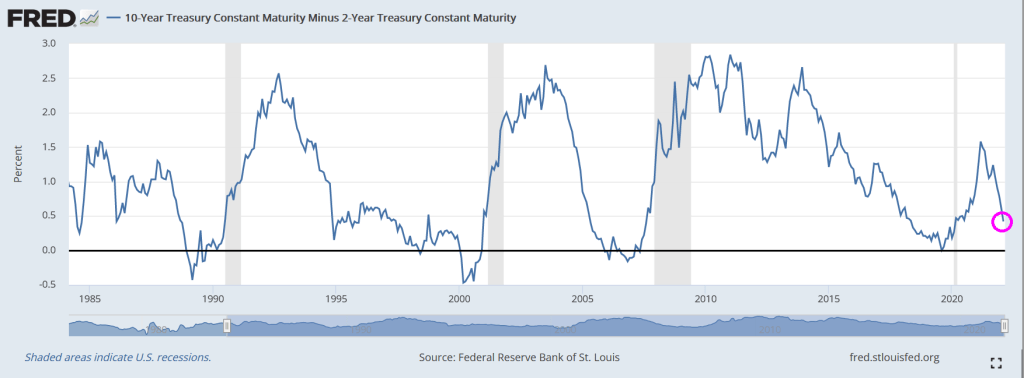
Here is a chart of The Fed’s many policies errors. Let’s start with The Fed lowering rates too fast around the 2001 recession. They pushed their target rate from 6.5% in December 2000 down to 1.75% after one year and then down to 1% (PE1). As home price growth accelerated, The Fed engaged in their second policy error — raising rates too fast resulting in a dramatic cooling of home price growth. Then came Policy Error 3: the dropping of The Fed Funds Target rate from 5.25% in September 2007 to an eventual 0.25% in December 2008.

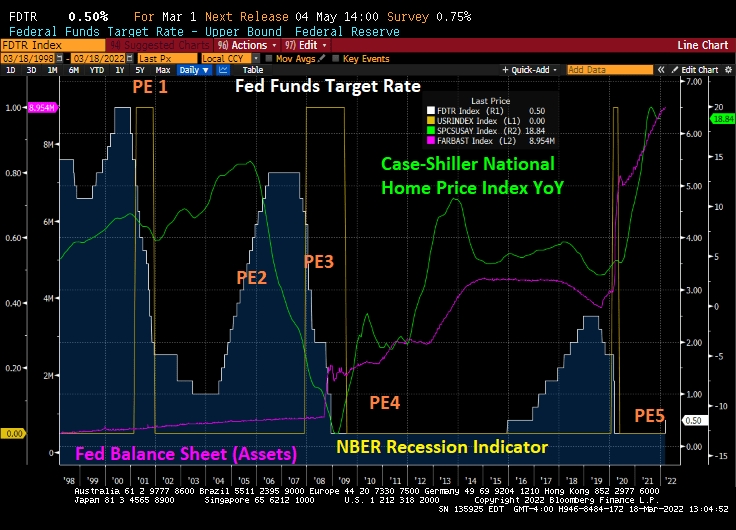
With the election of President Obama, The Fed engaged in Policy Error 4: keeping The Fed Funds Target rate too low for too long, combined with their massive asset purchase programs (QE).

Finally, The Fed (under Yellen) finally raised The Fed’s target rate ONCE under Obama, but started raising rates once Trump was elected. The Fed also slowed their QE under Trump which as called “Fed policy NORMALIZATION.” Then COVID struck and The Fed engaged in Policy Error 5: keeping rates too low for too long … again while massively expanding their balance sheet.

Fannie Mae and Freddie Mac, the DC mortgage giants were done in by The Fed’s whipsaw Policy Error machine.

Now we are embarking on PE 5: Powell and The Fed Gang not raising rates but signalling that they will. Like the play “Waiting for Godot.”

Slowing! Mortgage Purchase Applications Down 2% From Previous Week, Down 8% From Same Week Last Year (Bankrate’s 30Y Mortgage Rate Rises To 4.46%)

Mortgage applications decreased 1.2 percent from one week earlier, according to data from the Mortgage Bankers Association’s (MBA) Weekly Mortgage Applications Survey for the week ending March 11, 2022.

The seasonally adjusted Purchase Index increased 1 percent from one week earlier. The unadjusted Purchase Index increased 2 percent compared with the previous week and was 8 percent lower than the same week one year ago.

The Refinance Index decreased 3 percent from the previous week and was 49 percent lower than the same week one year ago.

Bankrate’s 30-year mortgage rate has surged to 4.46%.

Here is a photo of alligators in Great Falls, Virginia, up-river from Washington DC. They are likely congregating for the Fed Open Market Committee (FOMC) announcement today.

MBA Mortgage Purchase Applications Rise 11%, Refi Applications Rise 9% From Previous Week, But Refi Apps Still Down 50% From Same Week Last Year (10Y-2Y Treasury Curve Continues To Flatten)

The mayhem caused by the Russian invasion of Ukraine is helping drive down interest rates … for the time being … and this is helping push down mortgage rates and increase mortgage applications.

Mortgage applications increased 8.5 percent from one week earlier, according to data from the Mortgage Bankers Association’s (MBA) Weekly Mortgage Applications Survey for the week ending March 4, 2022.

The seasonally adjusted Purchase Index increased 9 percent from one week earlier. The unadjusted Purchase Index increased 11 percent compared with the previous week and was 7 percent lower than the same week one year ago.

The Refinance Index increased 9 percent from the previous week and was 50 percent lower than the same week one year ago. Diane Olick at CNBC has the hilarious headline “Brief drop in mortgage rates sparks mini refinance boom.” The slight rise in refi applications from the previous week is more of a firecracker going off than a boom given that refi apps are still down 50% from the same week last year.

Bear in mind that the US Treasury 10-year yield is up since the MBA’s reporting week ended on March 4, 2022. So, look for Olick’s mini-refi boom to end as quickly as it started.

Here is the rest of the MBA story.

The MBA Mortgage Purchase applications index typically peaks in mid-to-late April, so we still have another month (seasonality) until purchase applications begin declining again.

The US Treasury 10Y-2Y curve continues to flatten and is the worst curve recovery in modern history.

The general rise in US mortgage rates is more closely tied to expectations of Fed rate increases than Fed Agency MBS holdings.

Not, Not, Not! Mortgage Purchase Applications Declined 9% YoY For Week Ending February 25, 2022 (Refi Applications Drop 56% YoY)

While Corelogic’s January home price index was hot, hot, hot (UP 19.1% YoY), today’s mortgage applications index for the week ending February 25, 2022 was not, not, not.

Mortgage applications decreased 0.71 percent from one week earlier, according to data from the Mortgage Bankers Association’s (MBA) Weekly Mortgage Applications Survey for the week ending February 25, 2022.

 The seasonally adjusted Purchase Index decreased 1.76 percent from one week earlier. The unadjusted Purchase Index increased 1.16 percent compared with the previous week and was 9 percent lower than the same week one year ago.

The Refinance Index increased 1 percent from the previous week and was 56 percent lower than the same week one year ago.

Yes, the mortgage industry is going through some difficult times. But not as difficult as trying to understand Biden’s State of the Union address: “Putin may circle Kyiv with tanks, but he’ll never gain the hearts and souls of the Iranian people.” Huh?

And then Biden’s closing remark was “Go get ’em!” What? Go get whom? The Russians? Inflation? Trump supporters?? I feel like Biden thought the SOTU was the annual Army-Navy football game.

Weekend Update: US Q1 GDP Falls To 0.6%, Treasury 10Y-2Y Curve Flattens and Commodity Prices UP 52% Under Biden (Ports Still Clogged)

Russia is still attacking Ukraine and I am still seeing stories about actor/comedian Bob Saget’s cause of death. So now for something completely different.

After last week’s Personal Consumption Expenditures, GDP and new home sales reports, the Atlanta Fed’s GDPNow real GDP estimate for Q1 shriveled to 0.6%.

The US Treasury yield curve? It is flattening rapidly as it typically does prior to a recession.

Commodities? Commodity prices are UP 52% under Biden. And that includes prices dropping slightly from 2/24 to 2/25.

And then there is average port delays in US ports. Hey, I thought Mayor Pete the port Czar was supposed to unclog the ports!

Hopefully this coming week will be better! Particularly for the Ukrainian people.

Elmer Fed? US PCE Price Growth Hits 5.2%, Highest Since Mid-1983 (Taylor Rule Suggests Target Rate of 13.35%)

And this doesn’t include the inflation in prices caused by the Russian invasion of Ukraine. Yet.

US Personal Consumption Expenditures (PCE) price index rose by 5.2% in January, the fastest rate since mid-1983.

With CPI inflation at 7.5% YoY, the Taylor Rule suggests a Fed Funds target rate of 13.35%, higher than the current rate of 0.25%. Overstimulated much??

Let’s see if The Fed actually goes hunting inflation.

Let’s see if inflation makes The Fed dance!

Slowing! US Pending Home Sales Declined -9.07% YoY In January As Mortgage Rates Rise (UMich Buying Conditions for Houses Falls To 71)

Well, at least markets recovered yesterday (Dow up 500 points this AM) from the Russian invasion of Ukraine. But now on to other news.

US pending home sales fell -9.07% YoY as mortgage interest rates began rising.

The University of Michigan Buying Conditions for housing fell to 71 as mortgage rates increase.

Alarm! Mortgage Purchase Applications DOWN 13.1% WoW, Mortgage Refinancing Applications DOWN 16% WoW (Thanks Federal Reserve!)

Alarm!

It is not surprising that applications for a residential mortgage have crashed and burned after The Federal Reserve’s announced intentions to raise their target rate and trim the ballast in the economic tanks. But dang!

Mortgage applications decreased 13.1 percent from one week earlier, according to data from the Mortgage Bankers Association’s (MBA) Weekly Mortgage Applications Survey for the week ending February 18, 2022.

The seasonally adjusted Purchase Index decreased 10 percent from one week earlier. The unadjusted Purchase Index decreased 6 percent compared with the previous week and was 6 percent lower than the same week one year ago.

The Refinance Index decreased 16 percent from the previous week and was 56.4 percent lower than the same week one year ago.

While the average loan size did not increase this week, it remained close to the survey’s record high.

What The Fed giveth, The Fed can taketh away. Let’s see if Thurston Powell The Great Magician can raise rates and NOT crash the housing and mortgage markets.

My Kuroda! Japan’s Inflation “Miracle” (0.5% Inflation) Despite $5 Trillion BOJ Balance Sheet And -0.10 Policy Rate

My Kuroda!

Forbes has an interesting article on the Japanese “miracle” entitled “The $5 Trillion Inflation Time Bomb No One’s Talking About.”

It’s taken nine years and the Bank of Japan supersizing its balance sheet to the $5 trillion mark, but Asia’s second-biggest economy finally has some inflation.

Officials in Tokyo are realizing the hard way, though, that it’s best to be careful what you wish for as bond yields spike.

Granted, the gains in consumer prices Japan is reporting are negligible compared to those in the U.S. and China. And inflation is still a good distance from the BOJ’s 2% target. Still, the 0.5% rise in consumer prices in January year-on-year is already unnerving the bond market. It followed a 0.8% jump in December and marks the fifth straight month of increases.

The worry is that Japan’s inflation is the “bad” kind. Haruhiko Kuroda was hired as BOJ governor in March 2013 to end deflation. Kuroda unleashed tidal waves of liquidity. That drove the yen down 30%, generated record corporate profits and sent Nikkei 225 Average stocks to 31-year highs.

Despite a staggering balance sheet with a -0.10 bps policy rate, Japan has only 0.5% inflation.

And Japan’s yield curve is negative at 3 year tenor and less.

How is it that Japan has virtually no inflation with negative rates but the USA has 7.5% inflation with a 0.25% target rate? Could it be the USA undertook massive fiscal spending related to COVID and reduced energy sources in an effort to go “green” that led to 7.5% inflation??

My Kuroda!

Good governments don’t go on wild, wasteful spending sprees and shut off energy sources like the Biden Administration and Congress.

Case-Shiller National Home Price Index Still HOT In December +18.84% YoY As Active Inventories Die (Phoenix AZ Fastest Growing At 32.5% YoY While Washington DC Is Slowest Growing At 10.5% YoY)

The S&P CoreLogic Case-Shiller National home price index remained HOT in December, growing at a 18.84% pace. M2 Money YoY is still smoking at 13.11%.

All 20 metro areas in the Case-Shiller 20 index grew at 10% or higher YoY with my former home city Phoenix leading the way at 32.5% YoY house price growth. Washington DC, aka Mordor on The Potomac, was in last place at 10.5% YoY.

In terms of active inventory of housing, only Phoenix and Columbus Ohio are showing positive growth in active inventory YoY. But even Phoenix and Columbus saw a decline MoM (or month-over-month).

Including Existing Home Sales Active listings in the first chart, we see The Federal Reserve continuing to pump money at at 13.11% clip while active inventory is at an all-time low.

This is nuts.