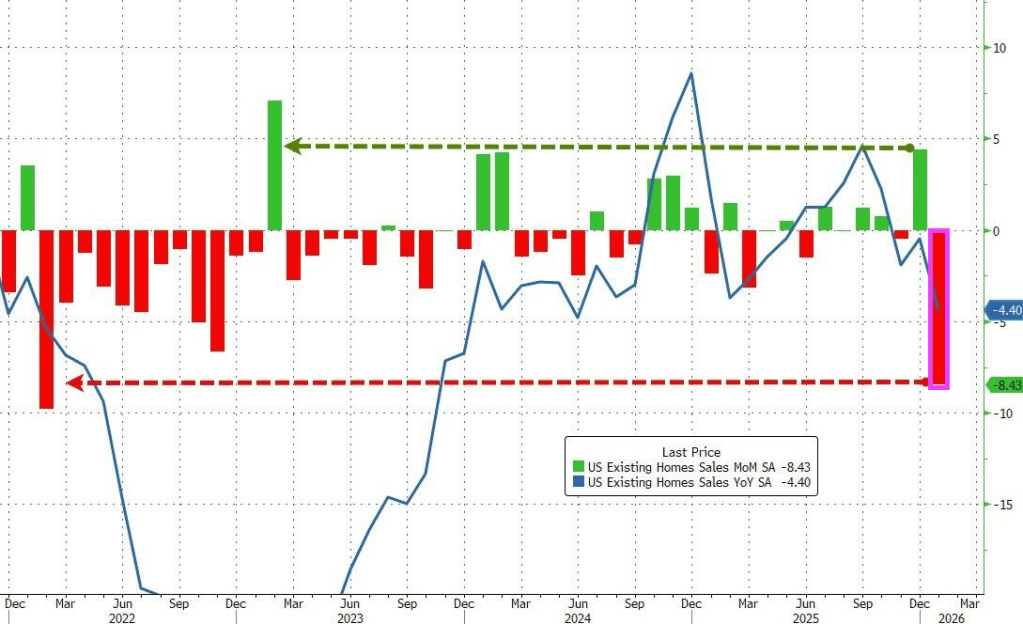
The analysts were correct on the direction but wrong on the scale as existing home sales plunged 8.4% MoM in January from a downwardly revised +4.4% MoM in December. That is the biggest MoM drop since February 2022.
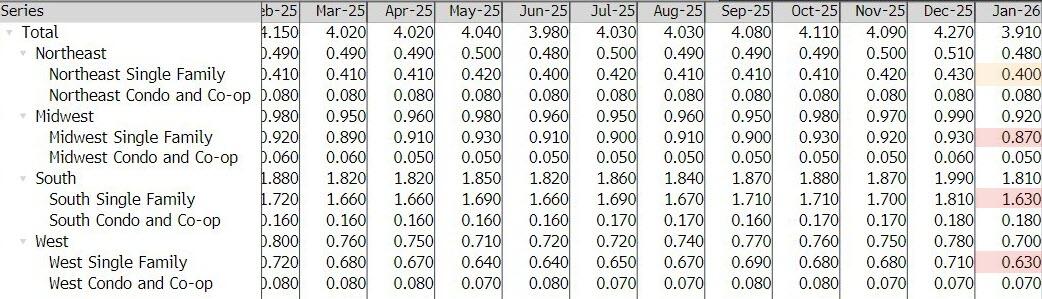
While some suggested this could be impacted by the Winter Storms, this is based on contracts signed in November/December… and the biggest decline was in The West (which had zero weather impact)
Nevertheless, realtors gonna realtor:
“The below-normal temperatures and above-normal precipitation this January make it harder than usual to assess the underlying driver of the decrease and determine if this month’s numbers are an aberration,” NAR Chief Economist Lawrence Yun said in a statement.
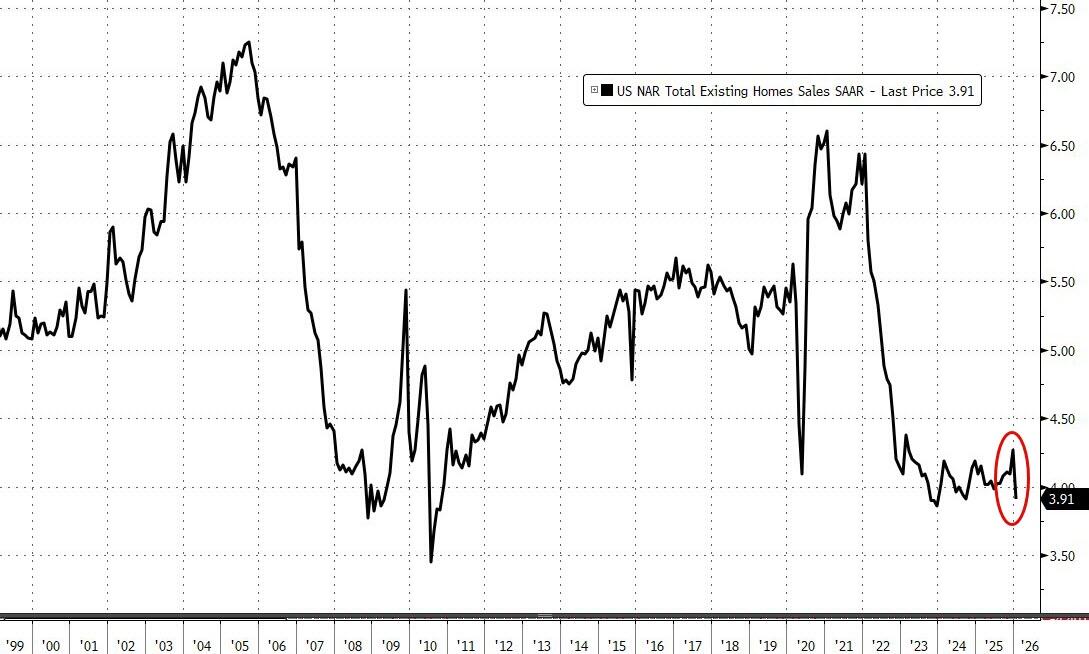
That MoM plunge pulled the total SAAR down near 15 year lows…
Without an extended period of improved affordability, the recovery in the housing market is likely to be prolonged.
The NAR report showed the median selling price rose 0.9% from a year earlier to $396,800 last month.
First-time buyers represented 31% of buyers of existing homes in January, up slightly from 29% in the prior month and higher than a year ago.
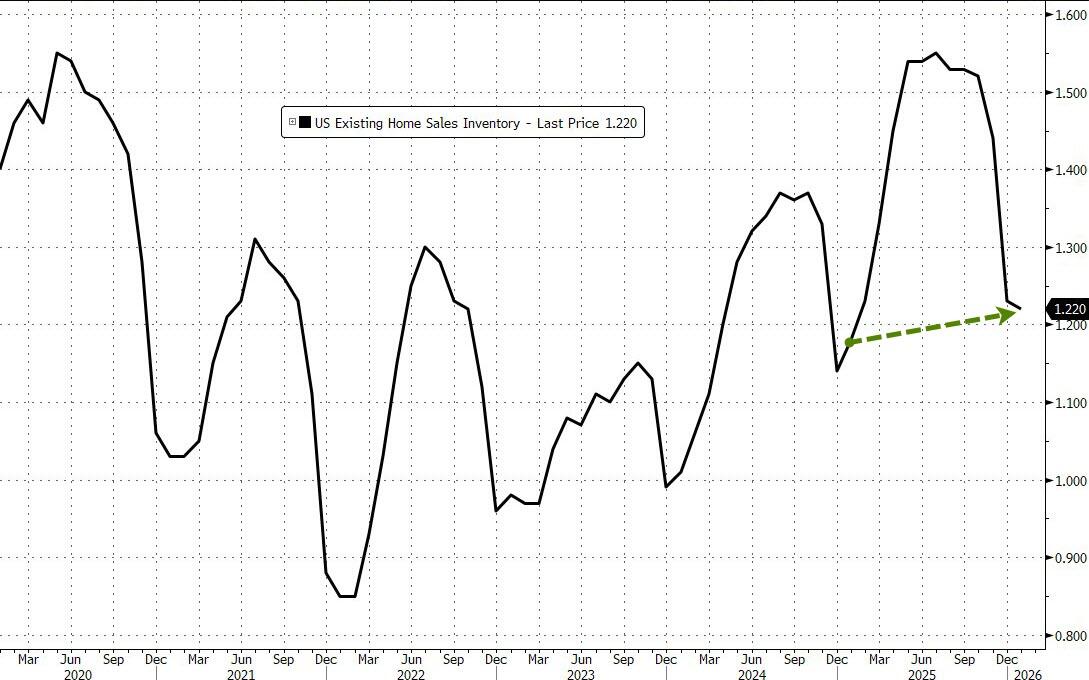
The inventory of previously owned homes increased 3.4% in January from a year ago to 1.22 million.
A pickup in supply through 2025 has helped to tame price growth, though Yun said on a call with reporters that listings need to increase much more to help improve sales.
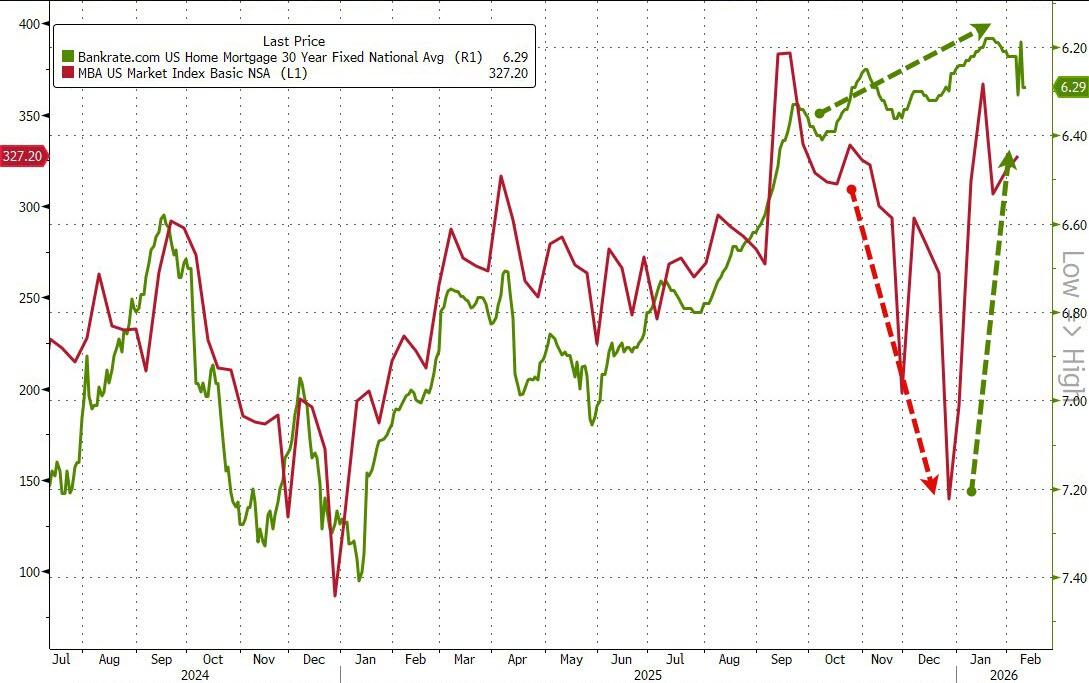
On the bright side, it appears mortgage applications are rebounding as the year started with lower rates…
Source: Bloomberg
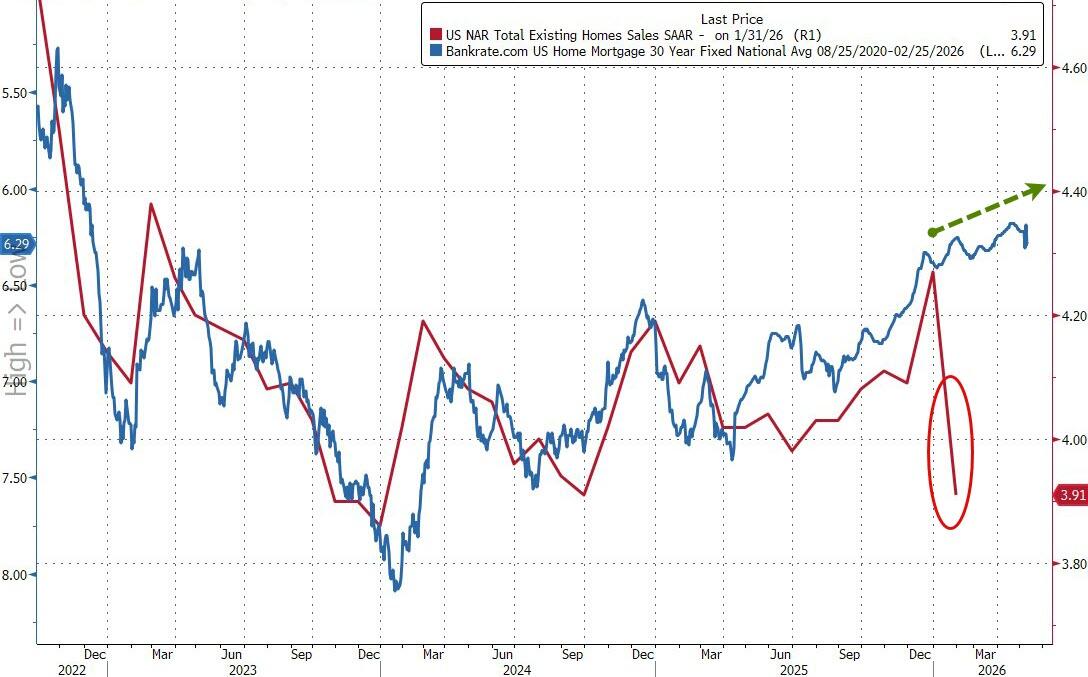
Arguably, existing home sales have much further to go to the upside as the lagged mortgage rate has continued to decline… so what triggered this collapse?
Source: Bloomberg
Finally, circling back to where we started, NAR expects home sales to rise a stunning 14% this year, higher than most other forecasts but a figure that NAR Chief Economist Lawrence Yun said he feels “confident” in. That assumes more inventory will come on the market, mortgage rates will hover around 6% and the Fed will cut interest rates another two times, compared to policymakers’ median projection for one.
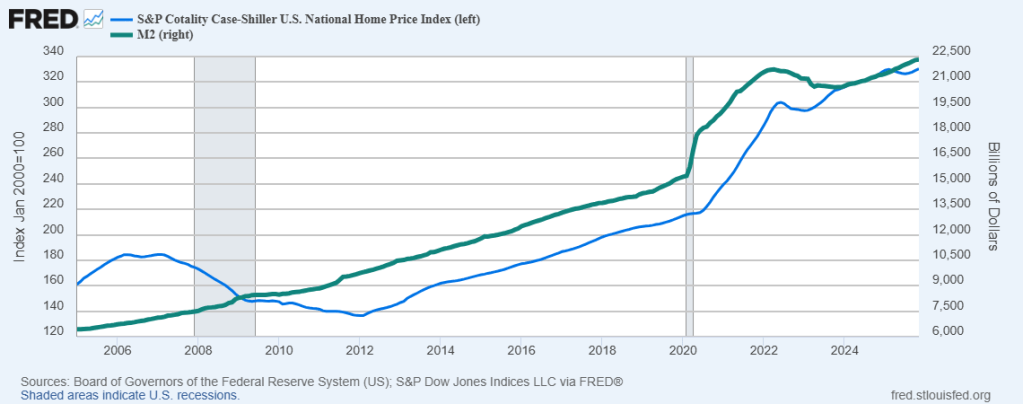
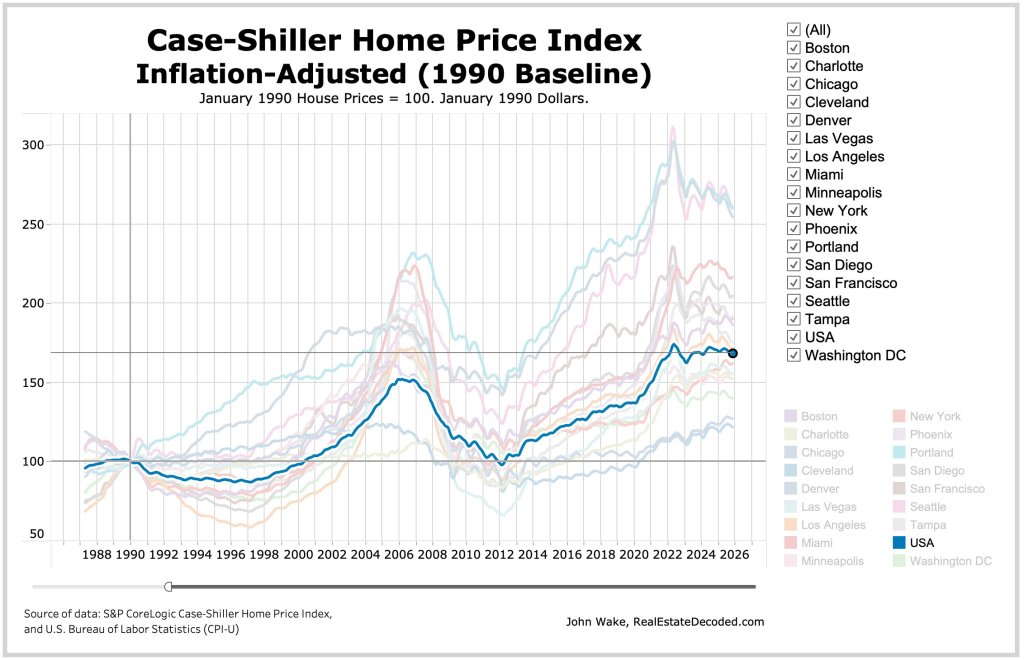
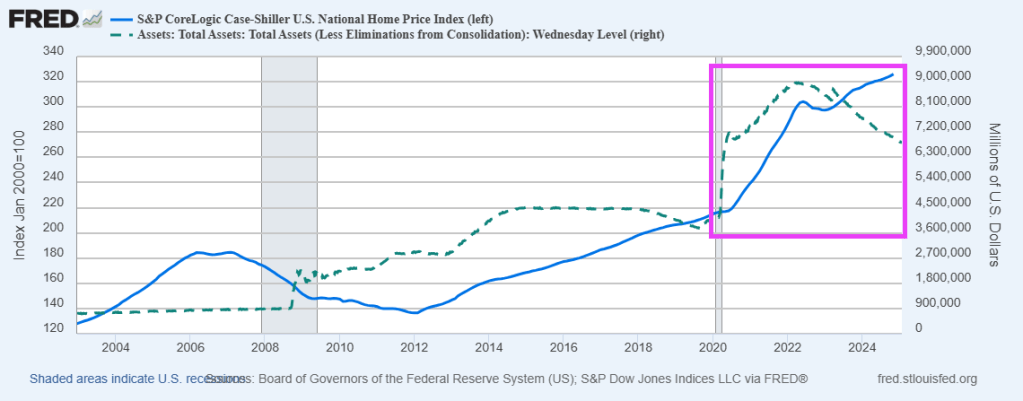
Keep on printing money. It seems that home price growth requires The Fed to keep printing money.
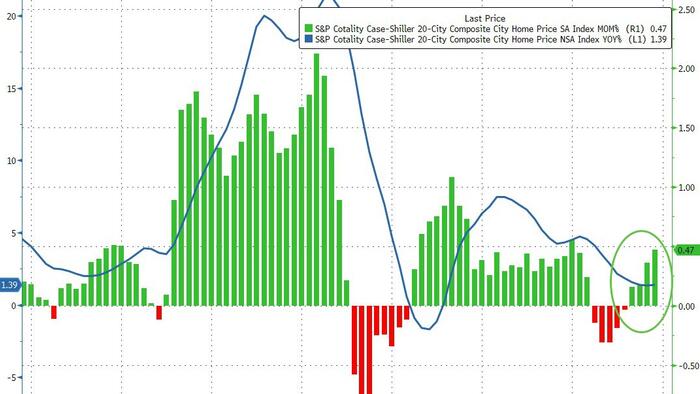
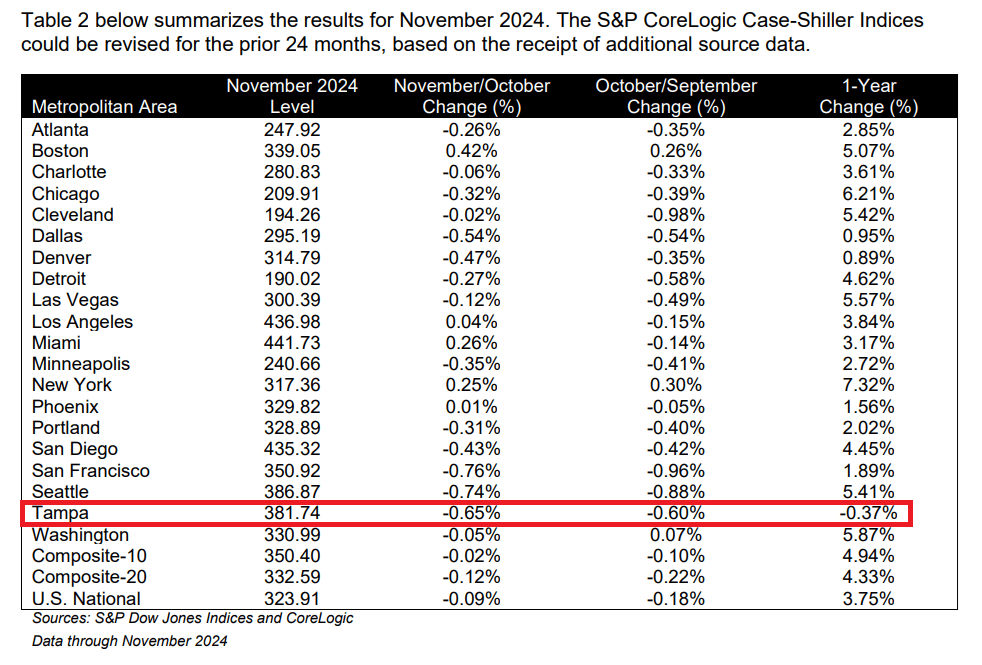
S&P/Case-Shiller released the monthly Home Price Indices for November (“November” is a 3-month average of September, October and November closing prices). September closing prices include some contracts signed in July, so there is a significant lag to this data. Here is a graph of the month-over-month (MoM) change in the Case-Shiller National Index Seasonally Adjusted (SA).
The S&P Cotality Case-Shiller U.S. National Home Price NSA Index posted a 1.4% annual gain for November, in line with the previous month.
Real home values declined as consumer inflation (2.7%) outpaced the National Index gain (1.4%) by 1.3 percentage points.
Regional divergence persisted: Midwestern and Northeastern markets led by Chicago (+5.7%) and New York (+5.0%) posted gains, while Sun Belt cities including Tampa (–3.9%), Phoenix (–1.4%), Dallas (–1.4%), and Miami (–1.0%) saw declines. … “Regional patterns continue to illustrate a stark divergence. Chicago leads all cities for a second consecutive month with a 5.7% year-over-year price increase, followed by New York at 5.0% and Cleveland at 3.4%. These historically steady Midwestern and Northeastern markets have maintained respectable gains even as overall conditions cool. By contrast, Tampa home prices are 3.9% lower than a year ago – the steepest decline among the 20 cities, extending that market’s 13-month streak of annual drops. Other Sun Belt boomtowns remain under pressure as well: Phoenix (-1.4%), Dallas (-1.4%), and Miami (-1.0%) each continue to see year-over-year declines, a dramatic turnaround from their pandemic-era strength.
“Monthly price changes were mixed but leaned negative in November, underscoring persistent softness. On a non-seasonally adjusted basis, 15 of the 20 major metro areas saw prices decline from October (versus 16 declines in the previous month). Only a handful of markets – including Los Angeles, San Diego, Miami, New York, and Phoenix – eked out slight gains before seasonal adjustment. After accounting for typical seasonal slowing, the National Index inched up just 0.4% for the month, indicating that price momentum remains muted. … The S&P Cotality Case-Shiller U.S. National Home Price NSA Index, covering all nine U.S. census divisions, reported a 1.4% annual gain for November. The 10-City Composite showed an annual increase of 2.0%, up from a 1.9% increase in the previous month. The 20-City Composite posted a year-over-year increase of 1.4%, up from a 1.3% increase in the previous month. … The pre-seasonally adjusted U.S. National Index saw a drop of 0.1% and the 20-City Composite Index fell 0.03%, while the 10-City Composite Index increased 0.1%.
After seasonal adjustment, the U.S. National Index reported a monthly increase of 0.4%, and both the 10-City Composite and 20-City Composite Indices posted month-over-month gains of 0.5%.
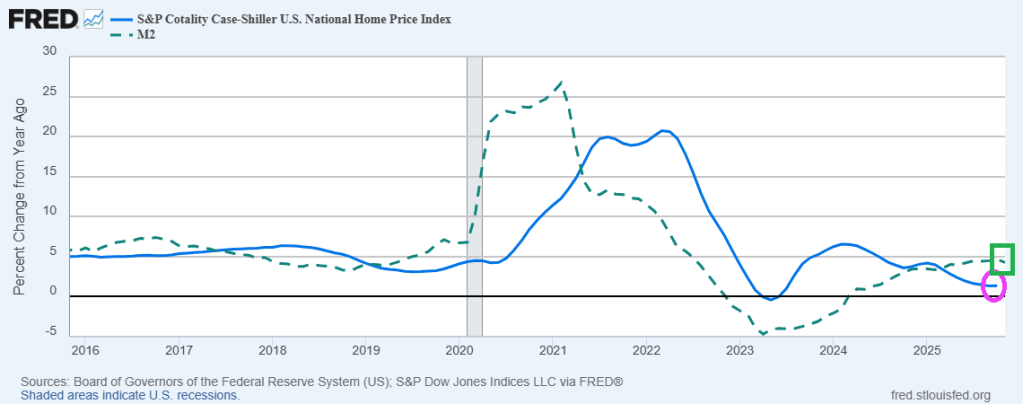
While its not the 2009, we do have a house price bubble that is deflating as The Fed slows M2 Money growth. However, we are witnessing rising foreclosure rates.
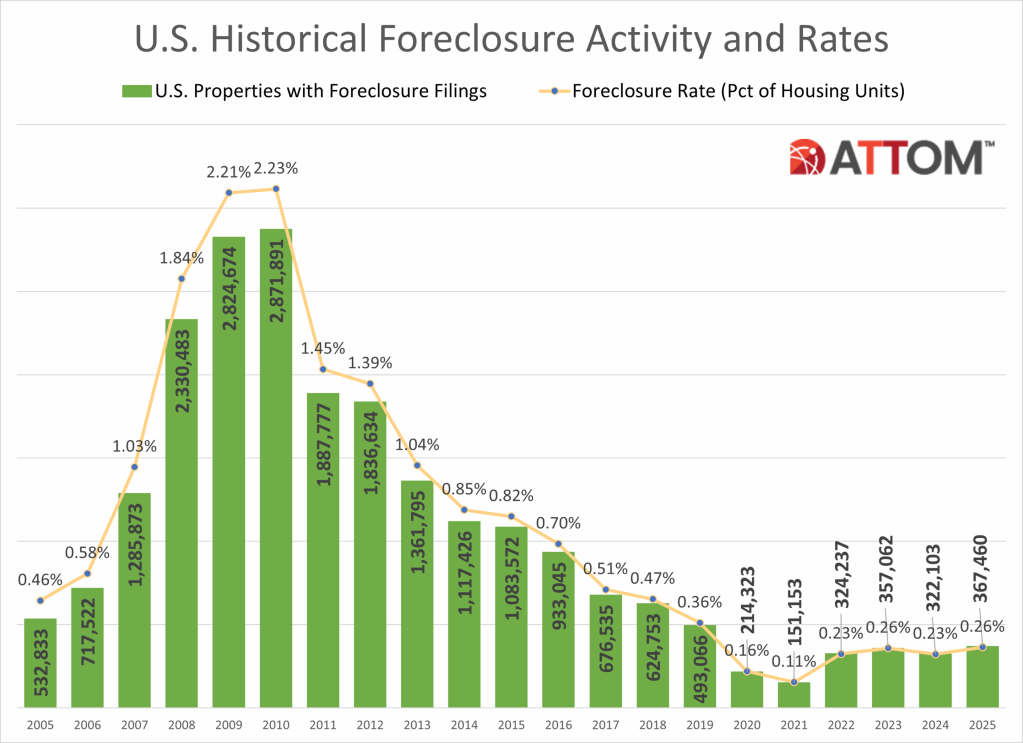
Lenders started the foreclosure process on 289,441 U.S. properties in 2025, up 14 percent from 2024, up 213 percent from the pandemic-era low in 2021, but down 14 percent form 2019 and down 86 percent from a peak of 2,139,005 in 2009.
States that saw the greatest number of foreclosure starts in 2025 included Texas (37,215 foreclosure starts); Florida (34,336 foreclosure starts); California (29,777 foreclosure starts); Illinois (15,010 foreclosure starts); and New York (13,664 foreclosure starts).
Those metropolitan statistical areas with a population greater than 1 million that saw the greatest number of foreclosure starts in 2025 included New York, NY (14,189 foreclosure starts); Chicago, IL (13,312 foreclosure starts); Houston, TX (13,009 foreclosure starts); Miami, FL (8,936 foreclosure starts); and Los Angeles, CA (8,503 foreclosure starts).
Bank repossessions increase year over year
Lenders repossessed 46,439 properties through foreclosures (REO) in 2025, up 27 percent from 2024 but down 68 percent from 143,955 in 2019, the last full year before pandemic-related declines, and down 96 percent from a peak of 1,050,500 in 2010.
States that saw the greatest number of REOs in 2025 included Texas (5,147 REOs); California (4,030 REOs); Pennsylvania (2,975 REOs); Florida (2,869 REOs); and Illinois (2,768 REOs).
Those metropolitan statistical areas with a population greater than 1 million that saw the greatest number of REOs in 2025 included Chicago, IL (2,033 REOs); New York, NY (1,462 REOs); Houston, TX (1,381 REOs); Detroit, MI (1,105 REOs); and Philadelphia, PA (1,100 REOs).
Florida, Delaware, and South Carolina record the worst foreclosure rates in 2025
States with the worst foreclosure rates in 2025 were Florida (1 in every 230 housing units with a foreclosure filing); Delaware (1 in every 240 housing units); South Carolina (1 in every 242 housing units); Illinois (1 in every 248 housing units); and Nevada (1 in every 248 housing units).
Rounding out the top 10 states with the worst foreclosure rates in 2025, were New Jersey (1 in every 273 housing units); Indiana (1 in every 302 housing units); Ohio (1 in every 307 housing units); Texas (1 in every 319 housing units); and Maryland (1 in every 326 housing units).
Lakeland, Columbia, and Cleveland post the worst metro foreclosure rates in 2025
Among 225 metropolitan statistical areas with a population of at least 200,000, those with the worst foreclosure rates in 2025 were Lakeland, FL (1 in every 145 housing units with a foreclosure filing); Columbia, SC (1 in every 165 housing units); Cleveland, OH (1 in every 187 housing units); Cape Coral, FL (1 in every 189 housing units); and Atlantic City, NJ (1 in every 192 housing units).
Metro areas with a population greater than 1 million, including Cleveland that had the worst foreclosure rates in 2025 were: Jacksonville, FL (1 in every 200 housing units); Las Vegas, NV (1 in every 210 housing units); Chicago, IL (1 in every 214 housing units); and Orlando, FL (1 in every 217 housing units).
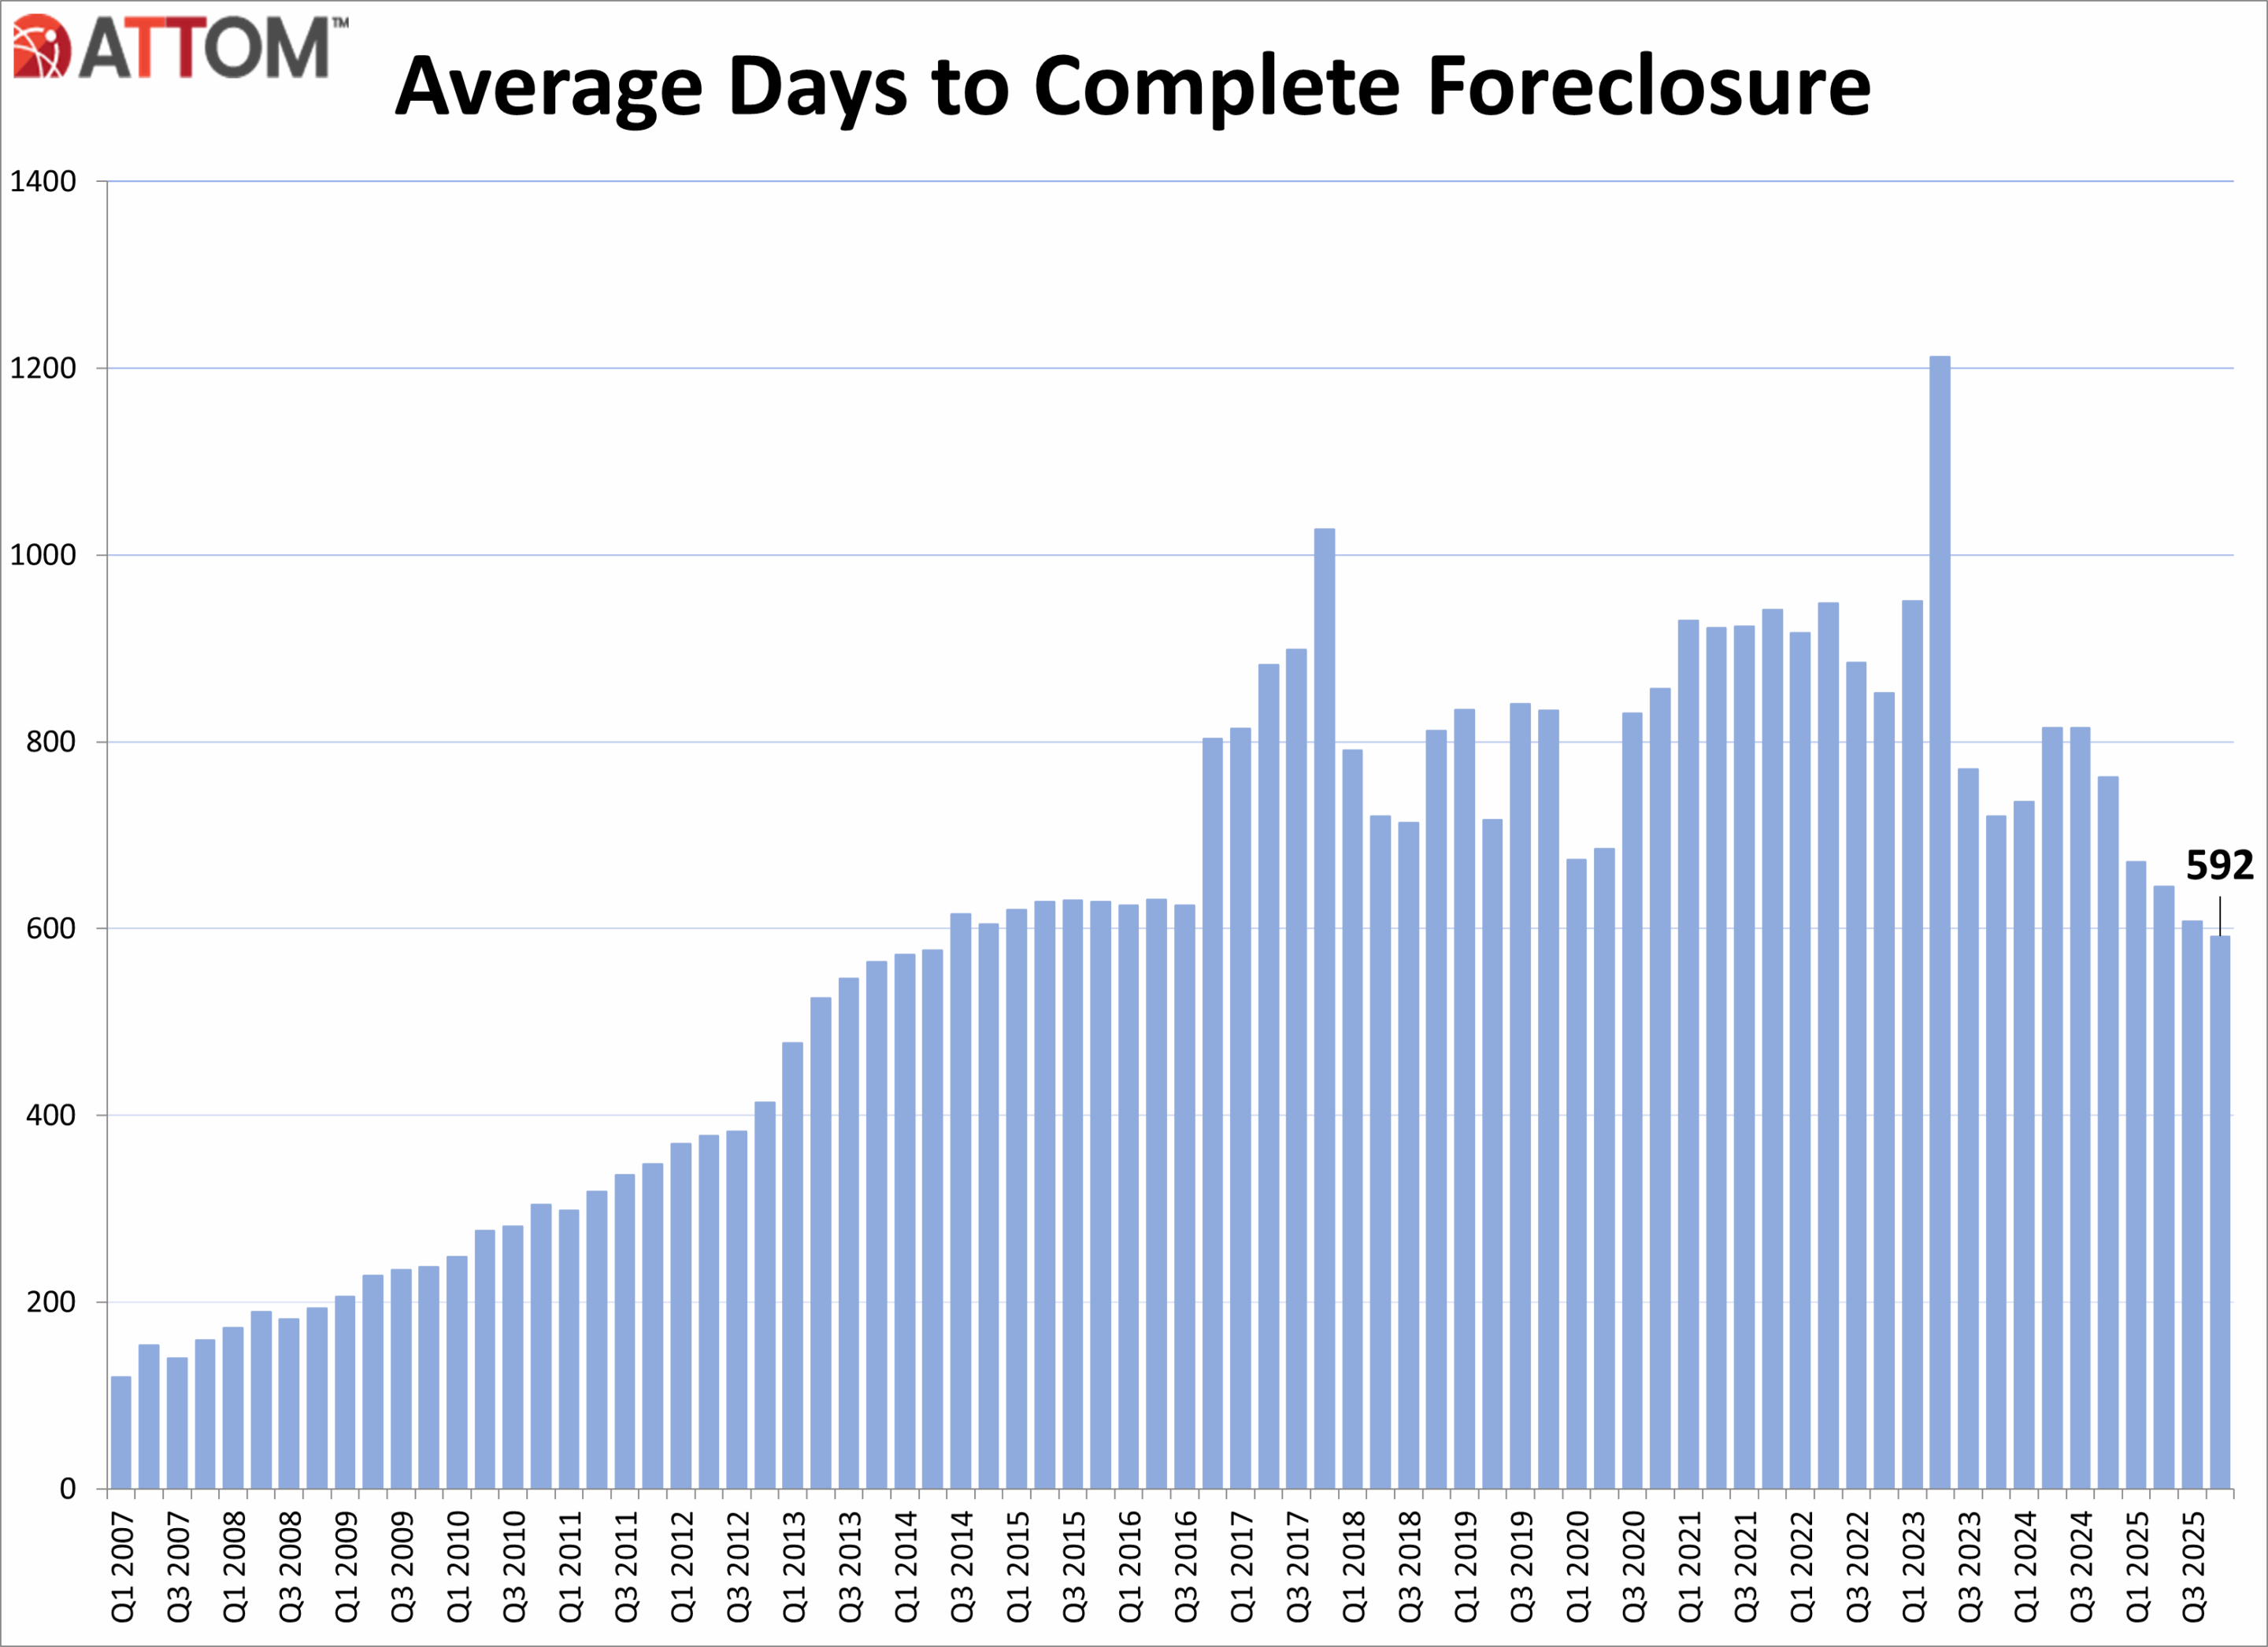
Average time to foreclose decreases
U.S. properties foreclosed in the fourth quarter of 2025 had been in the foreclosure process an average of 592 days, a 3 percent decrease from the previous quarter and a 22 percent decrease from a year ago.
States with the longest average time to foreclose in Q4 2025 were Louisiana (3,461 days); New York (1,998 days); Hawaii (1,760 days); Connecticut (1,600 days); and Kansas (1,594 days).
There was a total of 111,692 U.S. properties with foreclosure filings in Q4 2025, up 10 percent from the previous quarter and up 32 percent from a year ago.
Nationwide in Q4 2025, one in every 1,274 properties had a foreclosure filing.
December 2025 Foreclosure Activity Key Takeaways
Nationwide in December 2025, one in every 3,163 properties had a foreclosure filing.
States with the worst foreclosure rates in December 2025 were New Jersey (one in every 1,734 housing units with a foreclosure filing); South Carolina (one in every 1,917 housing units); Maryland (one in every 1,961 housing units); Delaware (one in every 2,044 housing units); and Florida (one in every 2,119 housing units).
28,269 U.S. properties started the foreclosure process in December 2025, up 19 percent from the previous month and up 46 percent from a year ago.
Lenders completed the foreclosure process on 5,953 U.S. properties in December 2025, up 53 percent from the previous month and up 101 percent from a year ago.
Conclusion
ATTOM’s Year-End 2025 Foreclosure Market Report shows that U.S. foreclosure activity increased in 2025, with foreclosure filings, starts, and bank repossessions all rising compared to 2024, signaling a continued shift toward more normalized market conditions. Despite the annual increases, foreclosure activity remains significantly below pre-pandemic levels and far below peaks seen during the last housing crisis. December 2025 and Q4 2025 data also showed increased foreclosure activity on both a monthly and annual basis.
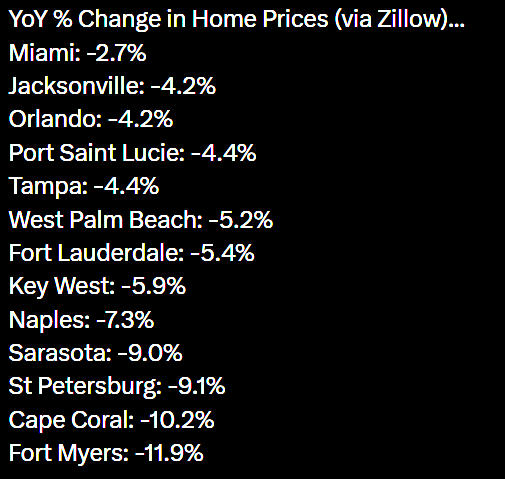
Florida home prices are tanking with Fort Myers leading the collapse at -11.9% YoY.
Hallelujah, I love this economy so! Of course, former First Lady Jill Biden is on the national tour trashing the economy saying it was “perfect” under Joe Biden.
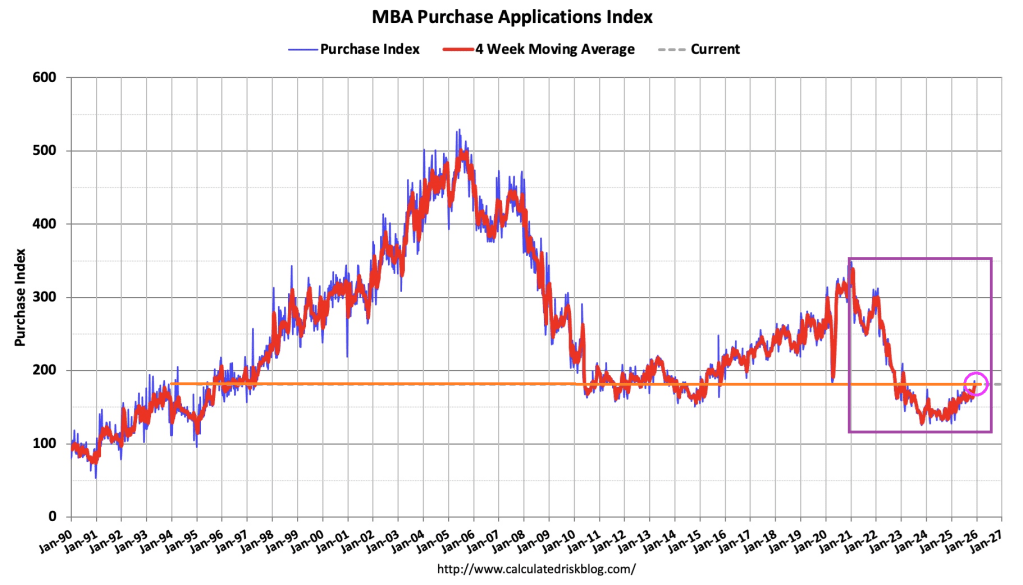
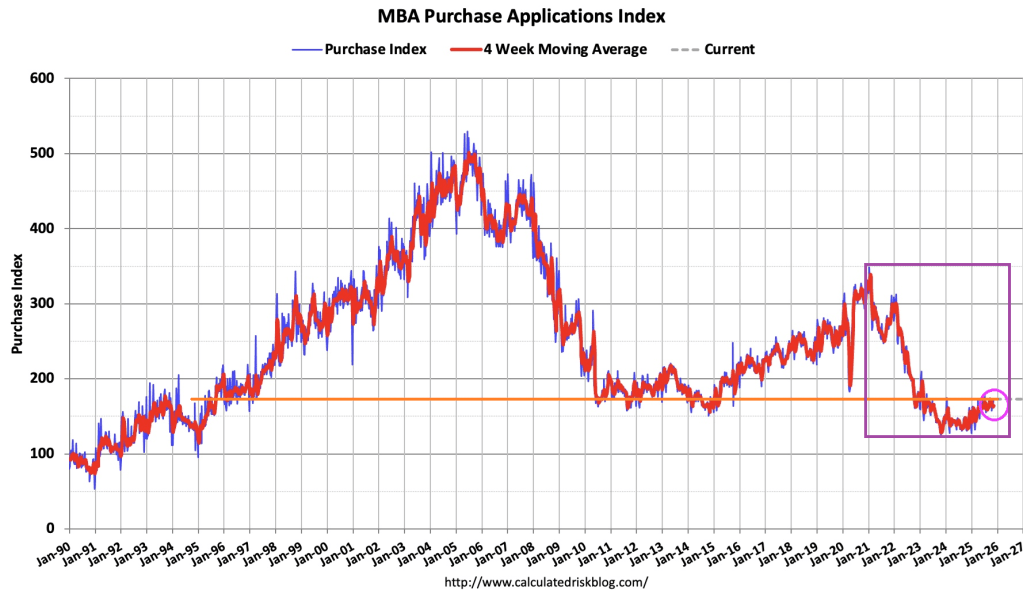
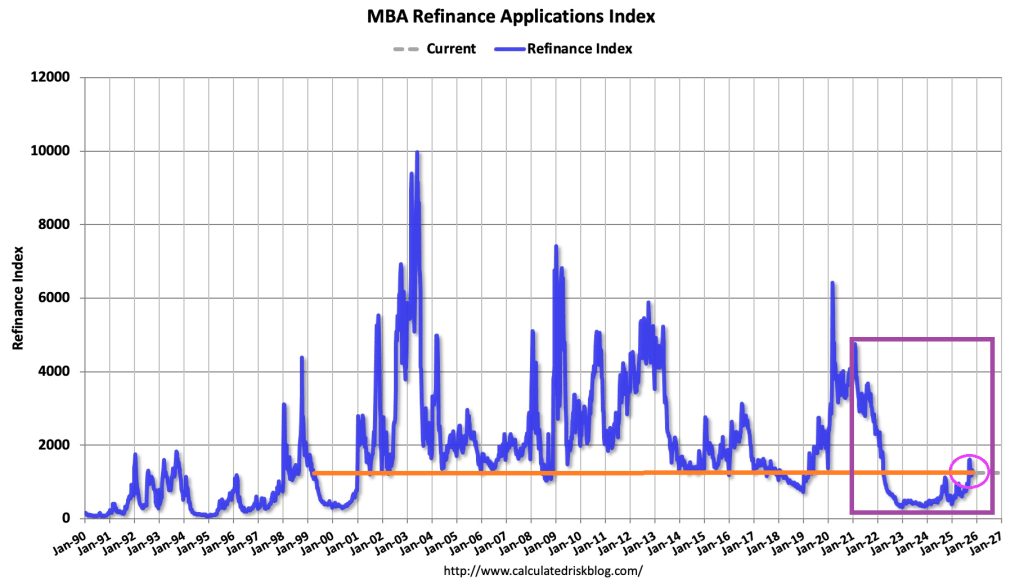
The Market Composite Index, a measure of mortgage loan application volume, increased 4.8 percent on a seasonally adjusted basis from one week earlier. On an unadjusted basis, the Index increased 49 percent compared with the previous week. The seasonally adjusted Purchase Index decreased 2 percent from one week earlier. The unadjusted Purchase Index increased 32 percent compared with the previous week and was 19 percent higher than the same week one year ago.
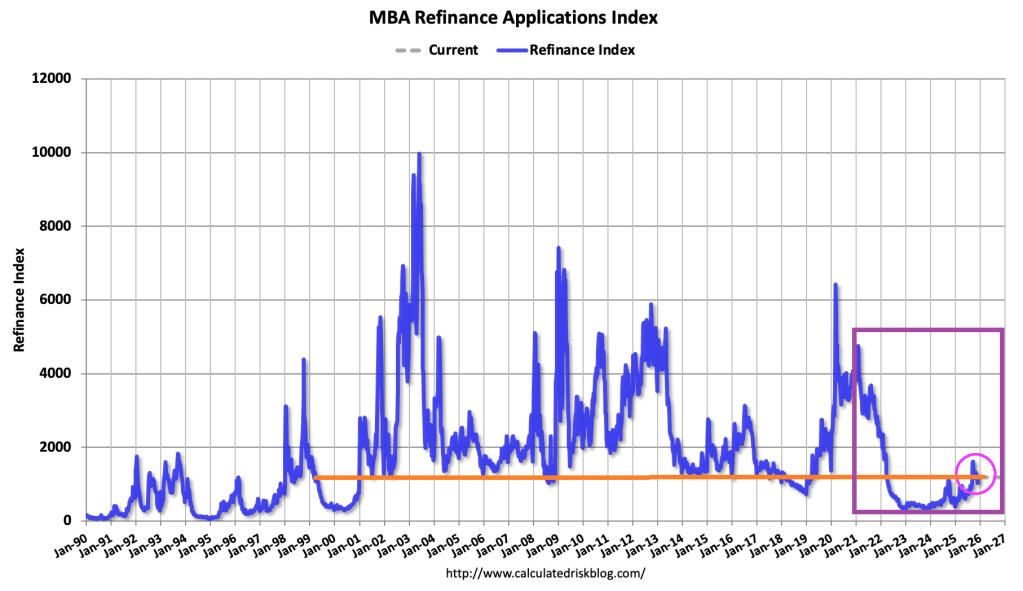
The Refinance Index increased 14 percent from the previous week and was 88 percent higher than the same week one year ago.
Compared to the prior week’s data, which included an adjustment for the Thanksgiving holiday, mortgage application activity increased last week, driven by an uptick in refinance applications,” said Joel Kan, MBA’s Vice President and Deputy Chief Economist. “Conventional refinance applications were up almost 8 percent and government refinances were up 24 percent as the FHA rate dipped to its lowest level since September 2024. Conventional purchase applications were down for the week, but there was a 5 percent increase in FHA purchase applications as prospective homebuyers continue to seek lower downpayment loans. Overall purchase applications continued to run ahead of 2024’s pace as broader housing inventory and affordability conditions improve gradually.
The average contract interest rate for 30-year fixed-rate mortgages with conforming loan balances ($806,500 or less) increased to 6.33 percent from 6.32 percent, with points increasing to 0.60 from 0.58 (including the origination fee) for 80 percent loan-to-value ratio (LTV) loans.
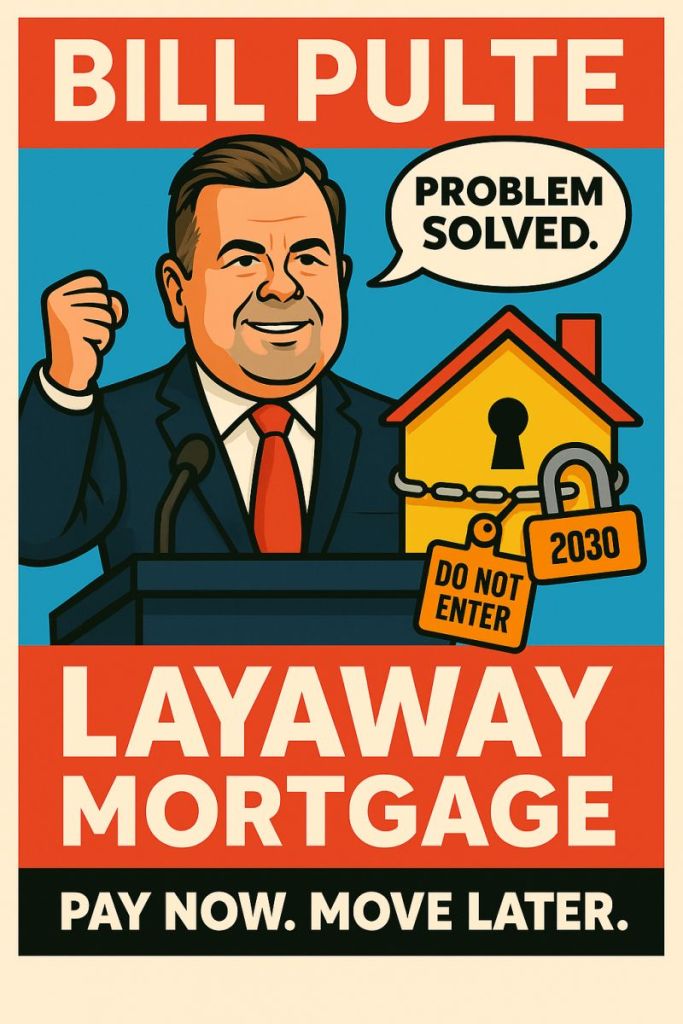
The US mortgage market is “livin’ on a prayer.” As a result, former homebuilder and current FHFA Director Bill Pulter has suggested 2 mortgage products to make US homes more “affordable”, adding to the legacy of stupid government policies to increase homeownership.
But first, current mortgage demand. Mortgage applications increased 0.6 percent from one week earlier, according to data from the Mortgage Bankers Association’s (MBA) Weekly Mortgage Applications Survey for the week ending November 7, 2025.
The Market Composite Index, a measure of mortgage loan application volume, increased 0.6 percent on a seasonally adjusted basis from one week earlier. On an unadjusted basis, the Index decreased 1 percent compared with the previous week. The seasonally adjusted Purchase Index increased 6 percent from one week earlier. The unadjusted Purchase Index increased 3 percent compared with the previous week and was 31 percent higher than the same week one year ago.
The Refinance Index decreased 3 percent from the previous week and was 147 percent higher than the same week one year ago.
Now on to Pulte’s stupid mortgage proposals.
Pulte Doubles Down After 50-Year Backlash, Proposes “Layaway Mortgage”
The 50-year mortgage is a stupid idea. True, it can reduce the monthly mortgage payment by several hundred dollars. But it extends the life of the mortgage from 30 to 50 years, keeping the outstanding mortgage balance elevated for longer, exposing the lender (or mortgage owner) to greater losses in the case of default. Not surprising since the duration risk of a 50-year mortgage is greater than on a 30-year mortgage. Who is going to hold these mortgages??
So, Pulte hearing that the mortgage market thinks this is a stupid idea, introduced another stupid mortgage idea: the “layaway mortgage” where buyers make payments for 5-10 years before they’re allowed to move into the home. This is a variation of “rent to own.”
Under Pulte’s Layaway Mortgage program:
▪️ Buyers select a home and begin making monthly payments immediately ▪️ They continue paying for 5-10 years (the “layaway period”) ▪️ During this time, they cannot live in the home, modify it, or even visit without an appointment ▪️ After the layaway period ends, buyers can move in and begin their 40-year mortgage ▪️ If they miss a payment during layaway, they forfeit everything and the home goes back on the market.
So, in other word, a 50-year mortgage (40+10 layaway).
Note: Japan used to offer 100-year mortgages during their housing bubble, but now 35-year mortgages are more common.
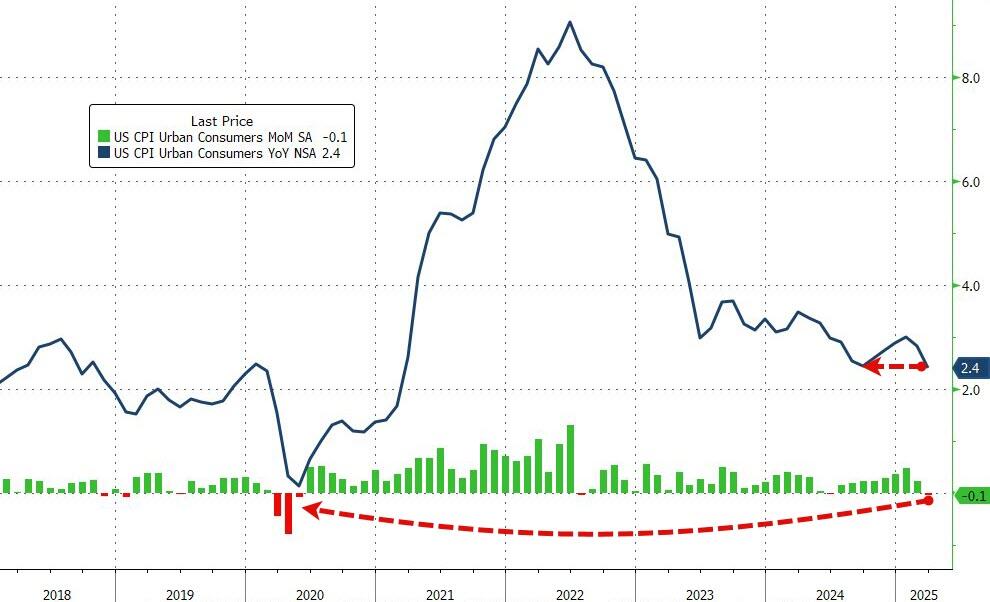
Having dipped lower in the previous month (following a few straight months of re-acceleration), expectations were for both headline and core measures to continue trending lower on a YoY basis… and they were.
Headline CPI FELL 0.1% MoM (vs +0.1% exp), which dragged the YoY CPI to +2.4%, matching the September lows…
Source: Bloomberg
That is the weakest MoM print since May 2020.
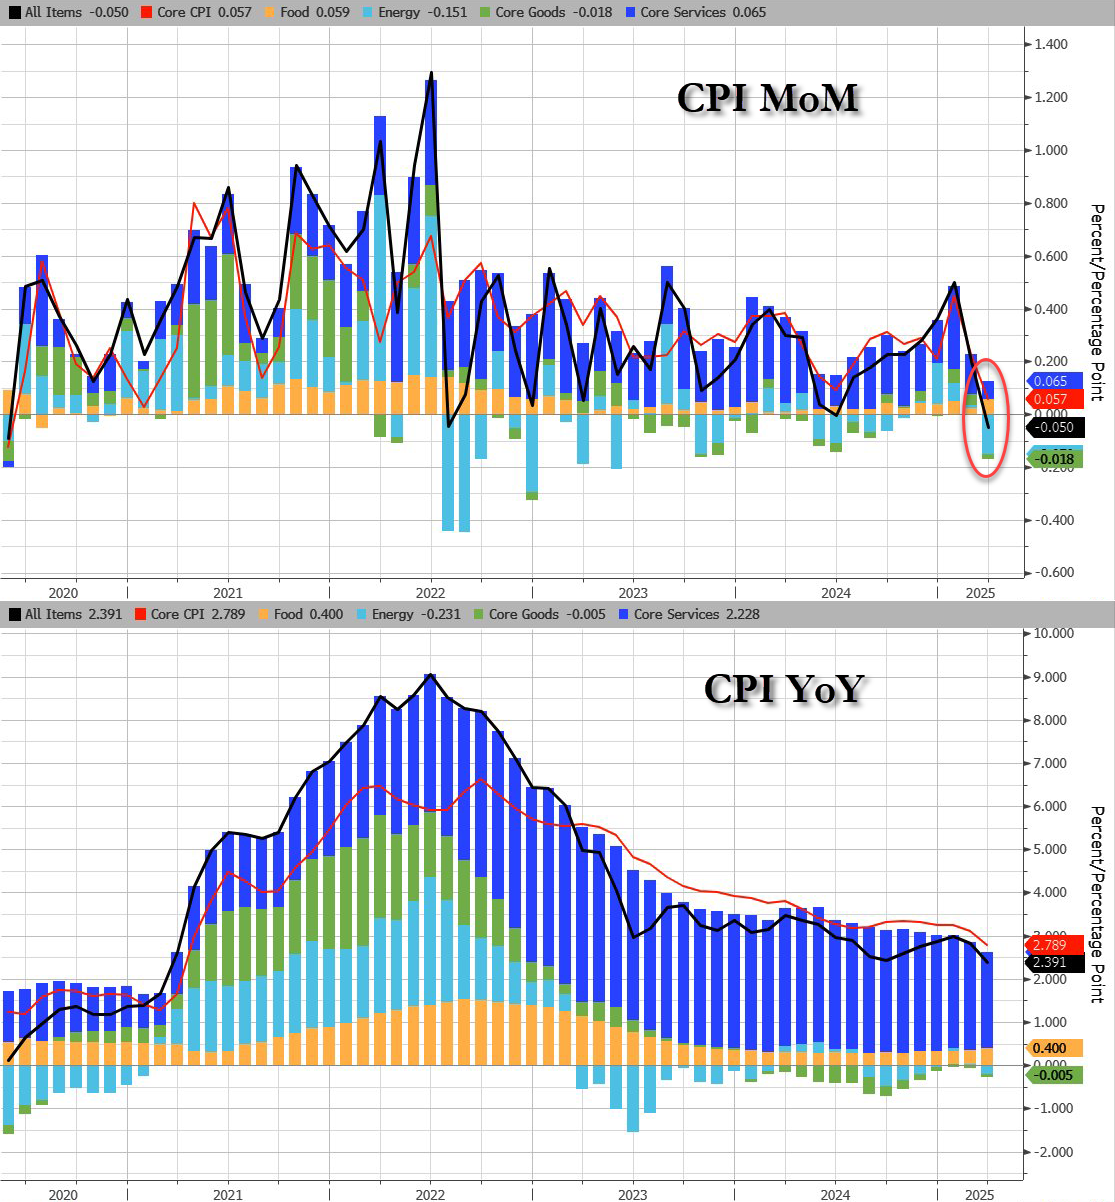
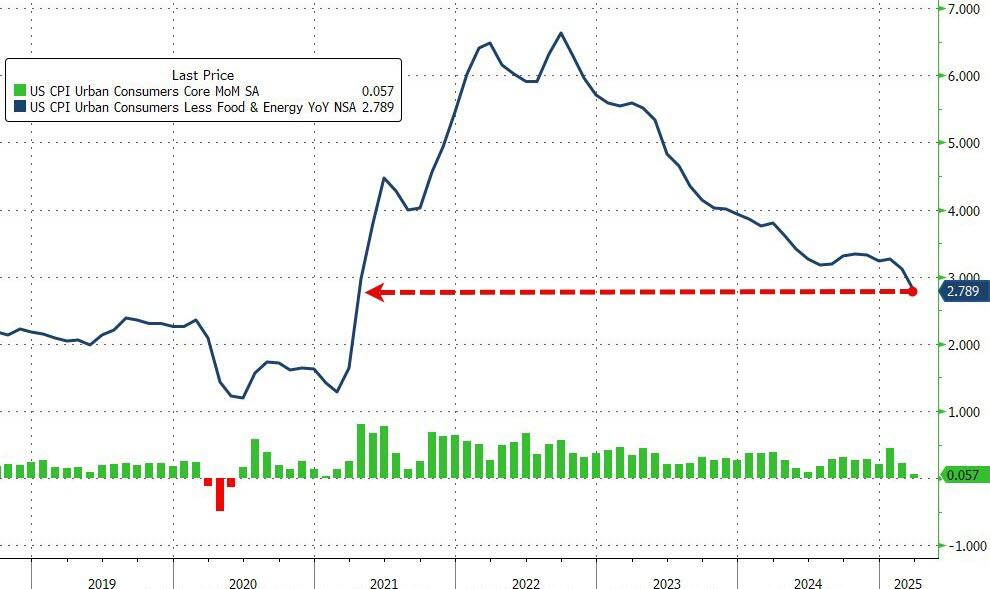
Core CPI also printed cooler than expected (+0.1% MoM vs +0.3% MoM exp), pulling the YoY print down t0 +2.8% YoY – the lowest since March 2021…
Source: Bloomberg
Services inflation tumbled…
Source: Bloomberg
CPI breakdown:
Headline:
CPI decreased 0.1% after rising 0.2% in February, and below the +0.1% estimate. Over the last 12 months, CPI rose 2.4%, below the 2.5% estimate.
Energy CPI fell 2.4% in March, as a 6.3% decline in the index for gasoline more than offset increases in the indexes for electricity and natural gas.
Food CPI rose 0.4% in March as the food at home index increased 0.5% and the food away from home index rose 0.4 percent over the month.
Core CPI:
The index for all items less food and energy rose 0.1% in March, following a 0.2% increase in February.
Indexes that increased over the month include personal care, medical care, education, apparel, and new vehicles.
The indexes for airline fares, motor vehicle insurance, used cars and trucks, and recreation were among the major indexes that decreased in March.
Core CPI details (MoM increase):
The shelter index increased 0.2% over the month.
The index for owners’ equivalent rent rose 0.% in March and the index for rent increased 0.3%.
The lodging away from home index fell 3.5 percent in March.
The personal care index rose 1.0%in March.
The index for education rose 0.4% over the month, as did the index for apparel.
The new vehicles index also increased over the month, rising 0.1%.
The index for airline fares fell 5.3% in March, after declining 4.0% in February.
The indexes for motor vehicle insurance, used cars and trucks, and recreation also fell over the month.
The household furnishings and operations index was unchanged in March.
The medical care index increased 0.2% over the month.
The index for hospital services increased 1.1% in March and the index for physicians’ services rose 0.3% over the month. In contrast, the prescription drugs index fell 2.0% in March.
Core CPI details (YoY increase):
The index for all items less food and energy rose 2.8 percent over the past 12 months.
The shelter index increased 4.0 percent over the last year, the smallest 12-month increase since November 2021.
Other indexes with notable increases over the last year include motor vehicle insurance (+7.5 percent), medical care (+2.6 percent), recreation (+1.9 percent), and education (+3.9 percent).
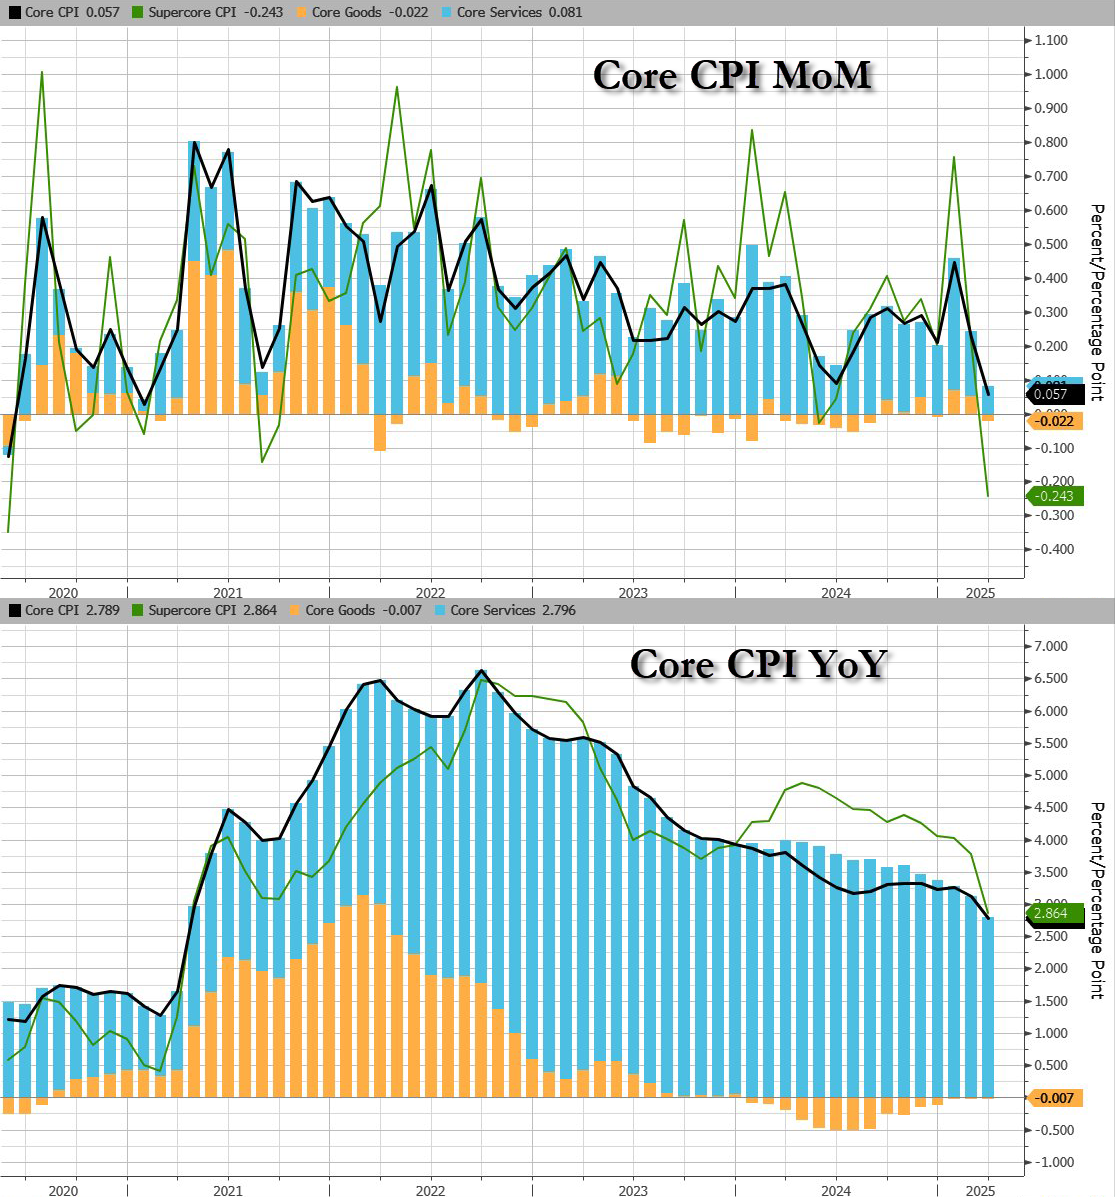
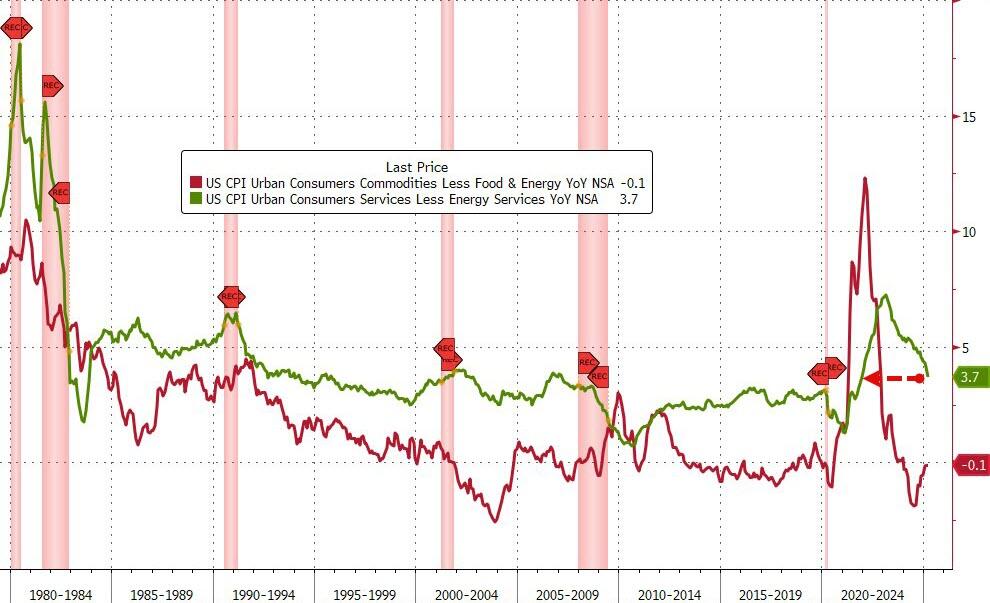
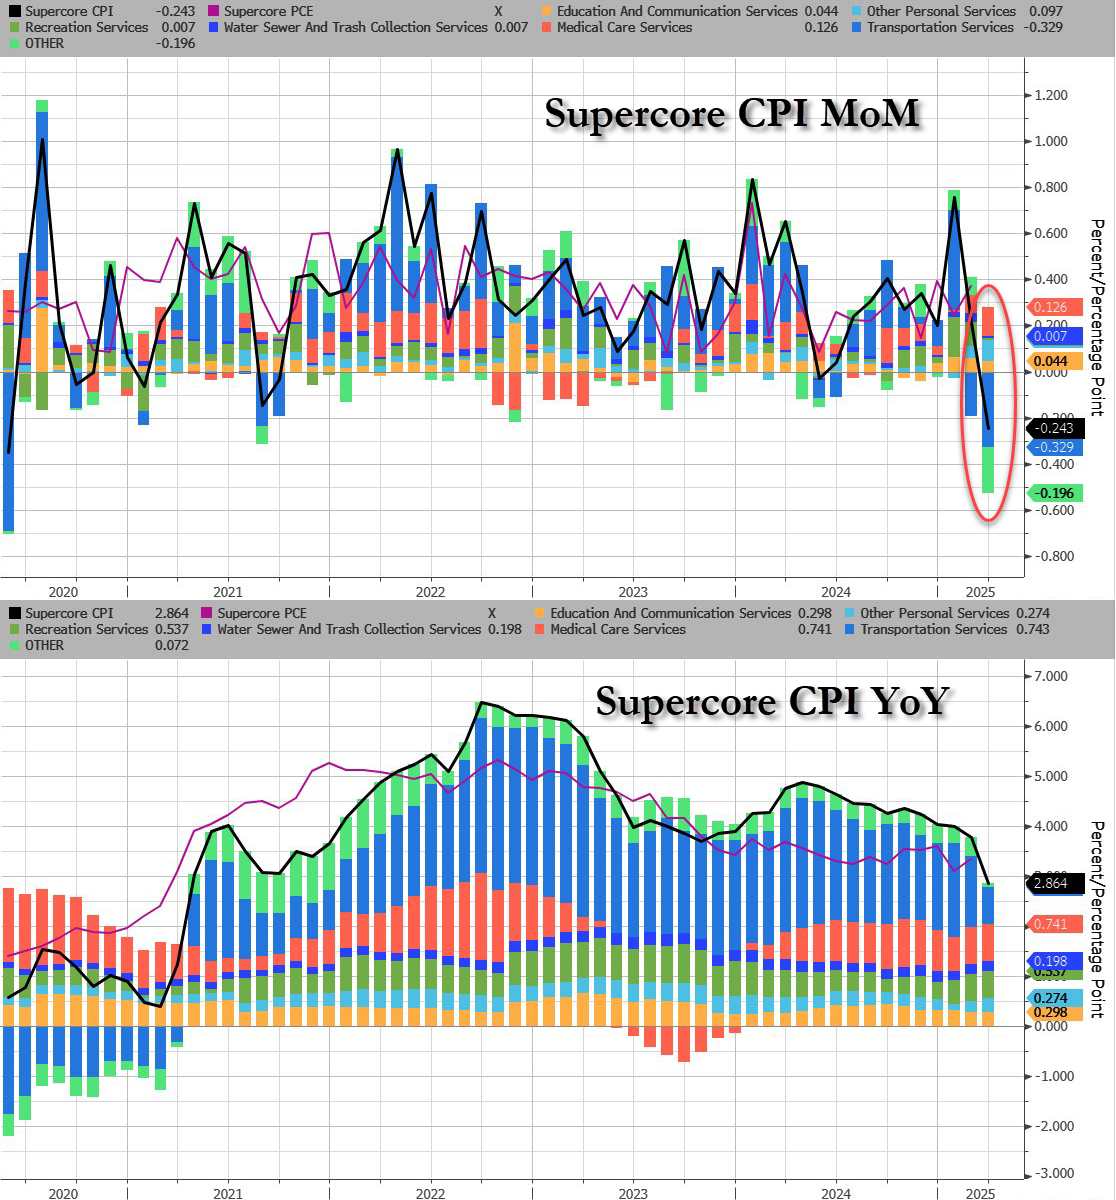
While goods inflation is flat (zero-ish), services cost inflation is fading fast…
Source: Bloomberg
Shelter and Rent inflation is slowing fast:
Shelter inflation +0.3% MoM, +3.99% YoY, down from 4.25% in February (lowest since Nov 2021)
Rent inflation +0.3% MoM, +3.99% YoY, down from 4.09% in February (lowest since Jan 2022)
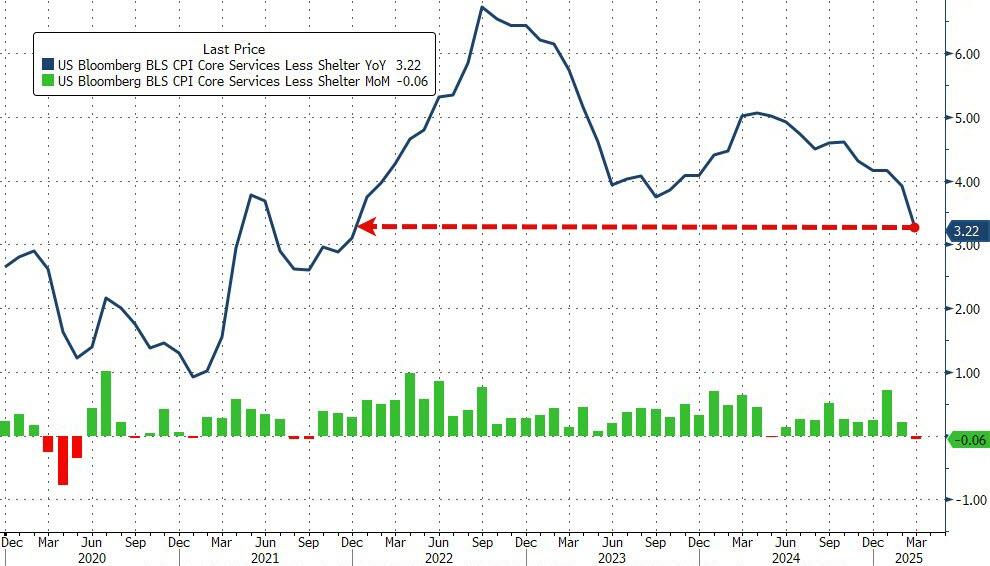
The so-called SuperCore CPI – Services Ex-Shelter – dropped 0.1% MoM dragging it down to +3.22% YoY – the lowest since Dec 2021…
Source: Bloomberg
Source: Bloomberg
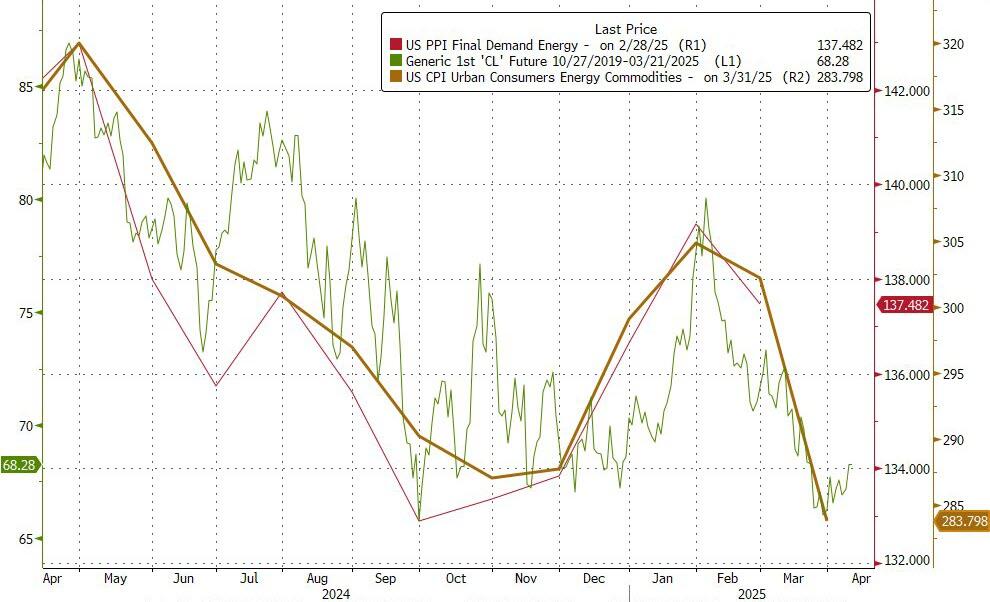
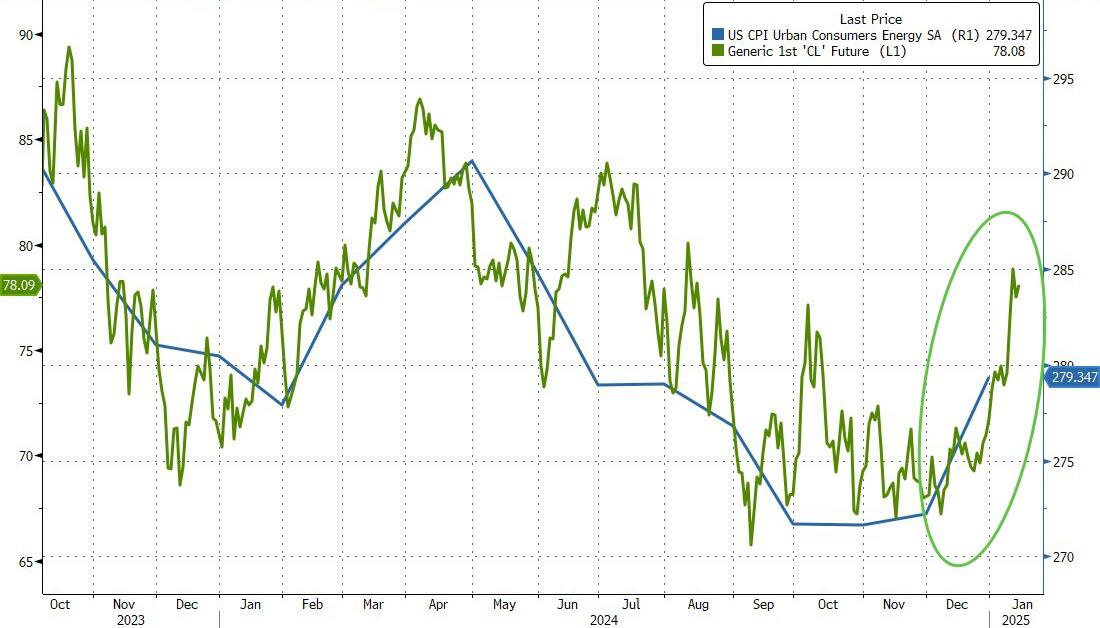
Drill Baby Drill (and tariffs recession fears) have dragged energy prices lower and pulled CPI lower with it…
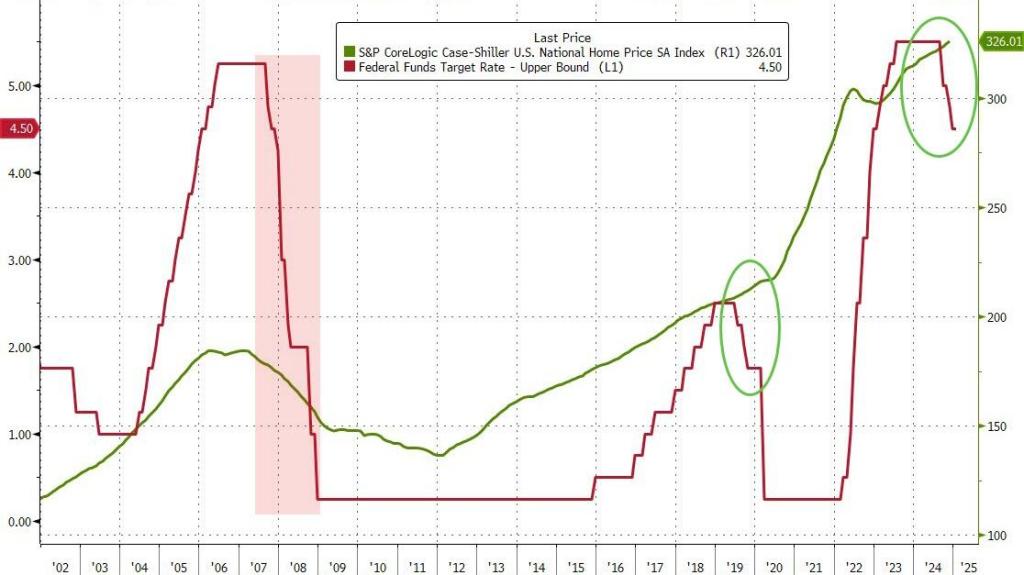
One reason that US home prices remain high (and unaffordable for many) is The Federal Reserve (aka, The Green Slime). Former Fed Chair (and Biden’s Treasury Secretary is no Luciana Paluzzi, the Italian beauty from the James Bond film Thunderball. Yellen is just a far-left economic hack.
Look at the Case-Shiller national home price index compared with The Fed funds target rate.
The S&P CoreLogic Case-Shiller U.S. National Home Price NSA Index, covering all nine U.S. census divisions, reported a 3.8% annual return for November, up from a 3.6% annual gain in the previous month. The 10-City Composite saw an annual increase of 4.9%, recording the same annual increase in the previous month. The 20-City Composite posted a year-over-year increase of 4.3%, up from a 4.2% increase in the previous month. New York again reported the highest annual gain among the 20 cities with a 7.3% increase in November, followed by Chicago and Washington with annual increases of 6.2% and 5.9%, respectively. Tampa posted the lowest return, falling 0.4%.
The pre-seasonally adjusted U.S. National, 20-City, and 10-City Composite Indices’ upward trends continued to reverse in November, with a -0.1% drop for the national index, while the 20-City Composite saw a -0.1% decline and the 10-City Composite was unchanged.
While the Fed Funds target rate gyrates, The Fed’s balance sheet remains high.
This is the worst start to a fiscal year EVER: – Spending is up 10.9% – Receipts are down 2.2% – FYTD deficit up 39.4% at $711 billion They’re handing Trump a ticking time bomb!
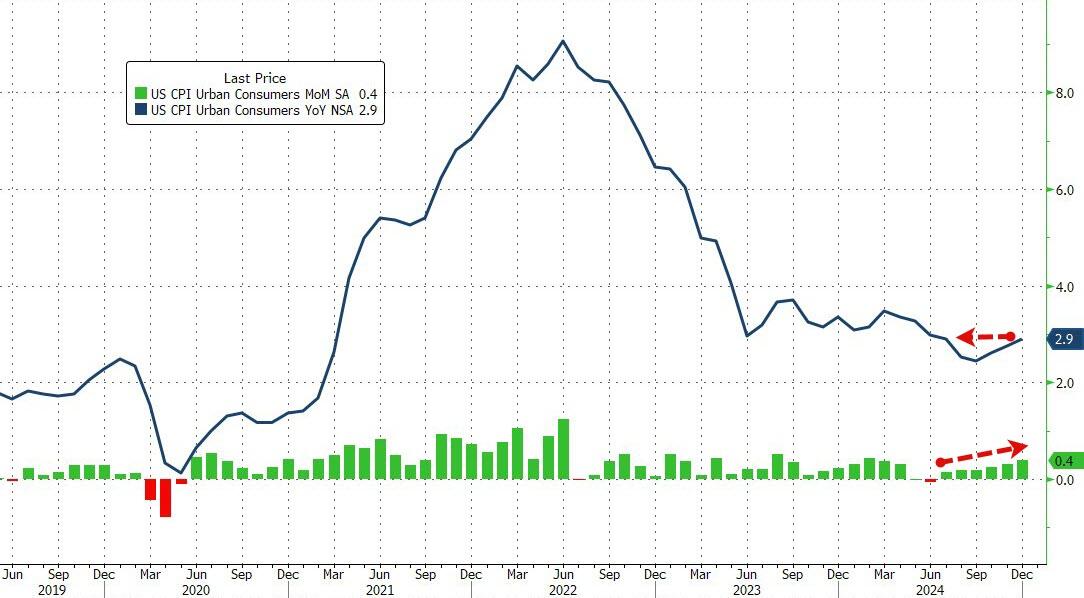
Speaking of Biden handing a ticking time bomb (according to Zero Hedge), after rising for 5 straight months, analysts expected headline consumer prices to continue accelerating in December (+0.4% MoM exp) and it did exactly that – the highest MoM print since March, leading the YoY CPI to rise 2.9% (the highest since July)…
Source: Bloomberg
CPI details:
Food
The index for food increased 0.3% in December, after rising 0.4% in November. The food at home index also rose 0.3% over the month. Four of the six major grocery store food group indexes increased in December. The index for cereals and bakery products rose 1.2% over the month, after falling 1.1% in November. The meats, poultry, fish, and eggs index increased 0.6 percent in December, as the eggs index rose 3.2 percent. The index for other food at home rose 0.3 percent over the month and the index for dairy and related products increased 0.2 percent.
Energy
The energy index increased 2.6% in December, after rising 0.2% in November. The gasoline index increased 4.4% over the month. (Before seasonal adjustment, gasoline prices decreased 1.1 percent in December.) The natural gas index rose 2.4 percent over the month and the index for electricity rose 0.3 percent in December. The energy index decreased 0.5 percent over the past 12 months. The gasoline index fell 3.4% over this 12-month span and the fuel oil index fell 13.1 percent over that period. In contrast, the index for electricity increased 2.8 percent over the last 12 months and the index for natural gas rose 4.9 percent.
All items less food and energy
The index for all items less food and energy rose 0.2 percent in December, after rising 0.3 percent in each of the 4 preceding months.
The shelter index increased 0.3 percent in December, as it did in November.
The index for owners’ equivalent rent also rose 0.3 percent over the month, as did the index for rent.
The lodging away from home index fell 1.0 percent in December, after rising 3.2 percent in November.
The medical care index increased 0.1 percent over the month, after rising 0.3 percent in October and November.
The index for physicians’ services increased 0.1 percent in December and the index for hospital services rose 0.2 percent over the month.
The airline fares index rose 3.9 percent in December, after rising 0.4 percent in the previous month.
The index for used cars and trucks rose 1.2 percent over the month and the index for new vehicles increased 0.5 percent.
Other indexes that increased in December include motor vehicle insurance, recreation, apparel, and education.
In contrast, the index for personal care fell 0.2 percent in December after rising 0.4 percent in November. The indexes for communication and alcoholic beverages also declined over the month. The household furnishings and operations index was unchanged in December
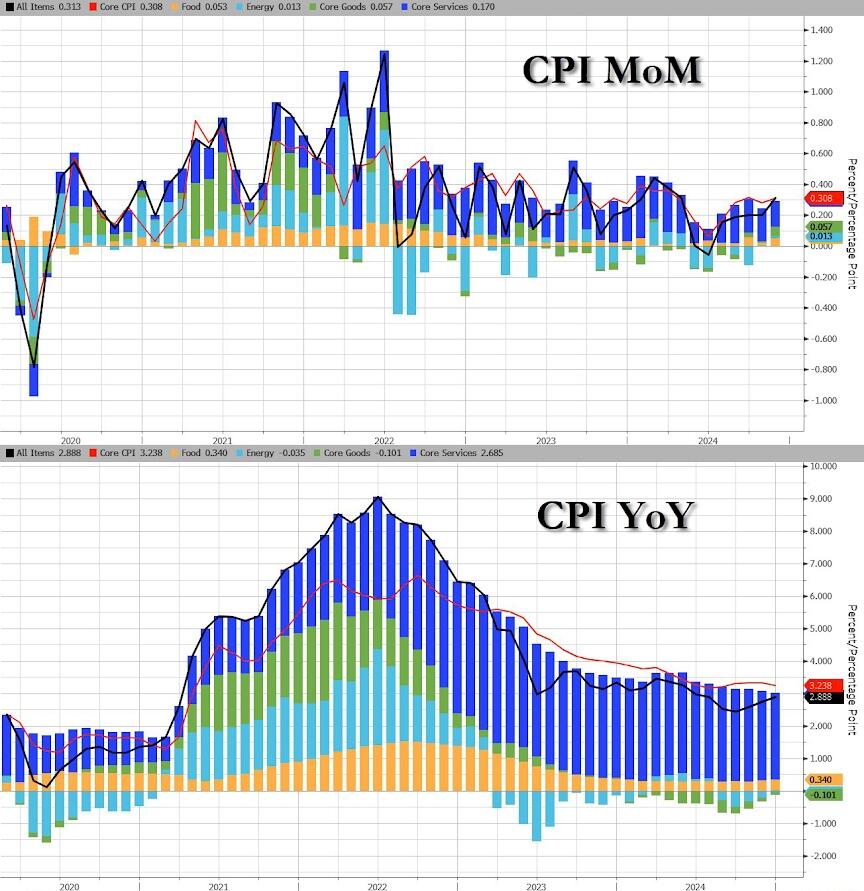
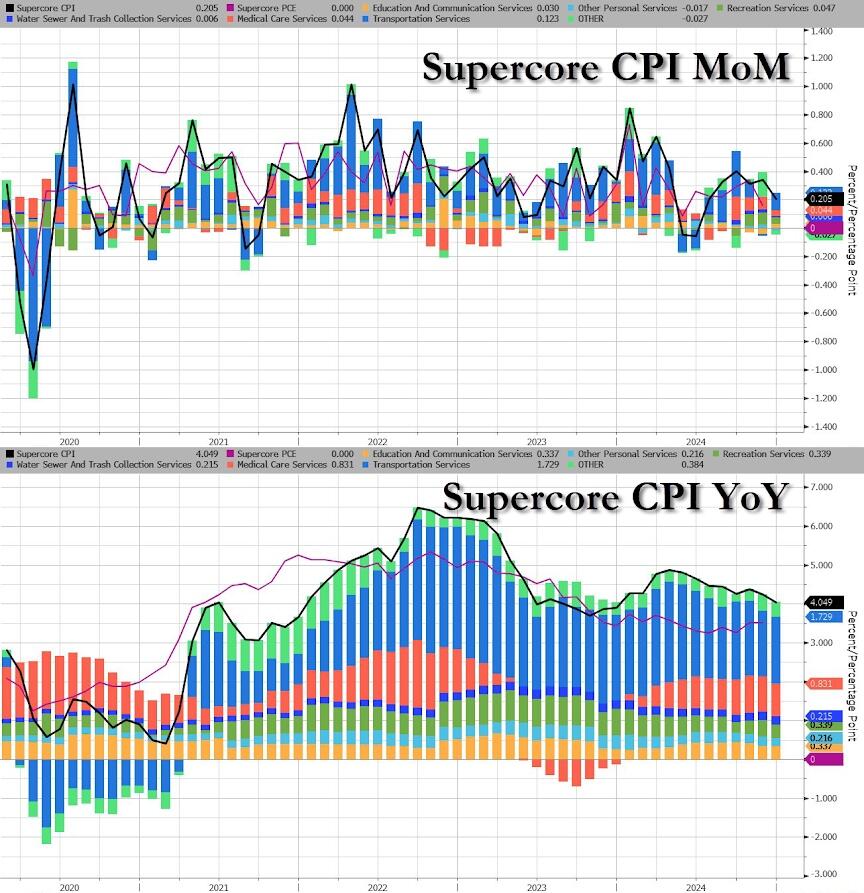
The resurgence of energy costs drove the hot headline CPI along with Core Services…
Source: Bloomberg
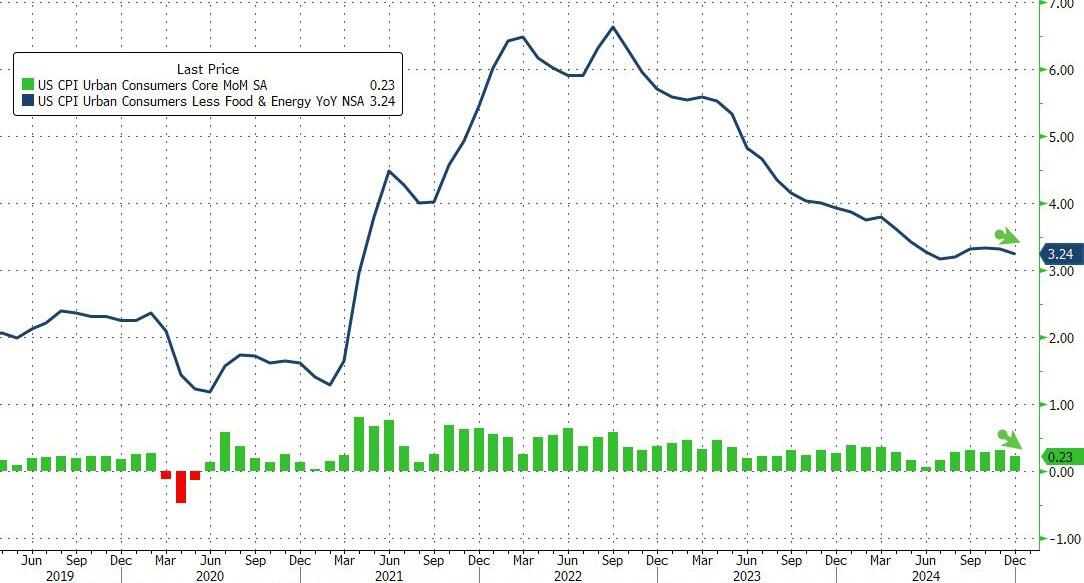
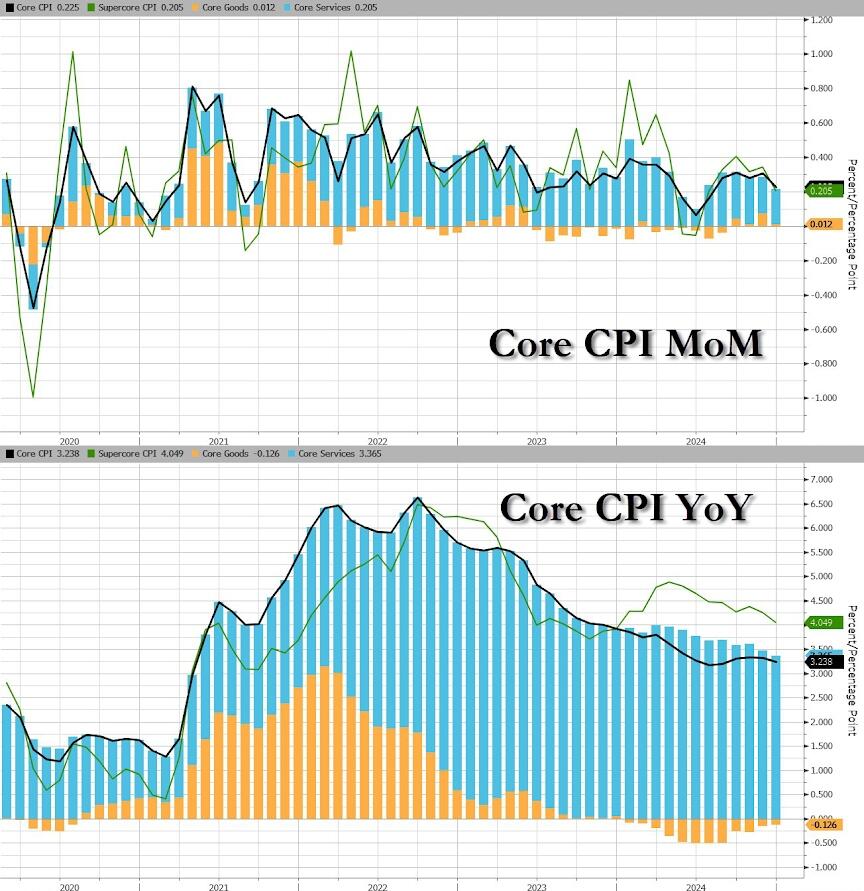
Core CPI (ex Food and Energy) dipped to +0.2% MoM (below the 0.3% exp) and the YoY pace of inflation slowed to 3.24% YoY. Core CPI rose EVERY month under Biden…
Source: Bloomberg
Core Goods price inflation slowed MoM (but deflation is gone on a YoY basis)…
Source: Bloomberg
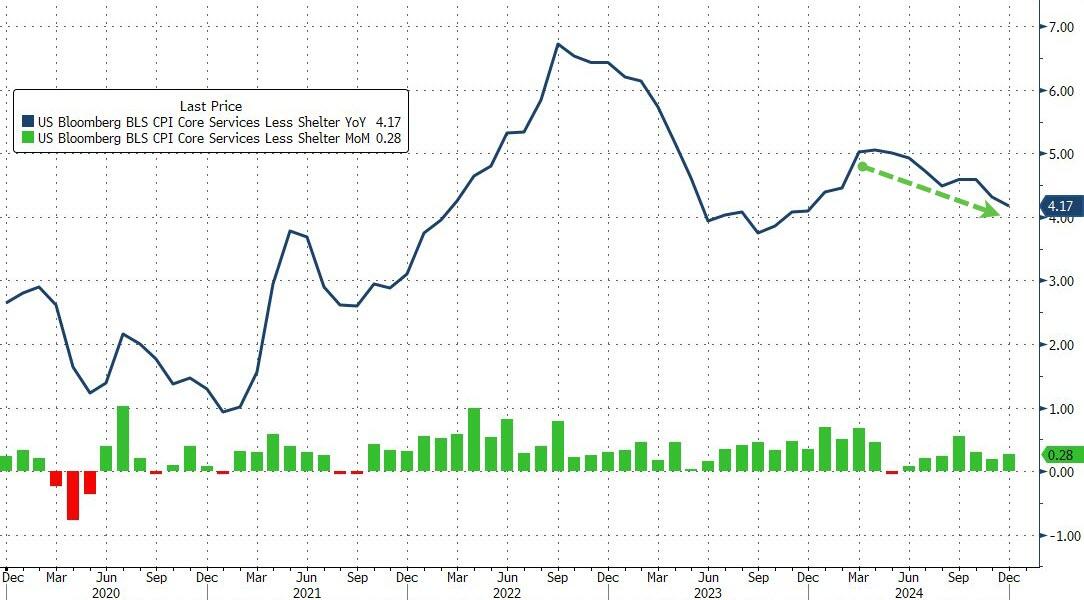
The Fed’s favorite indicator of the CPI bunch – SuperCore or Services CPI ex-Shelter – rose 0.28% MoM (slowing the pace of annual inflation to +4.17%)…
Source: Bloomberg
Transportation Services were not MoM…
Source: Bloomberg
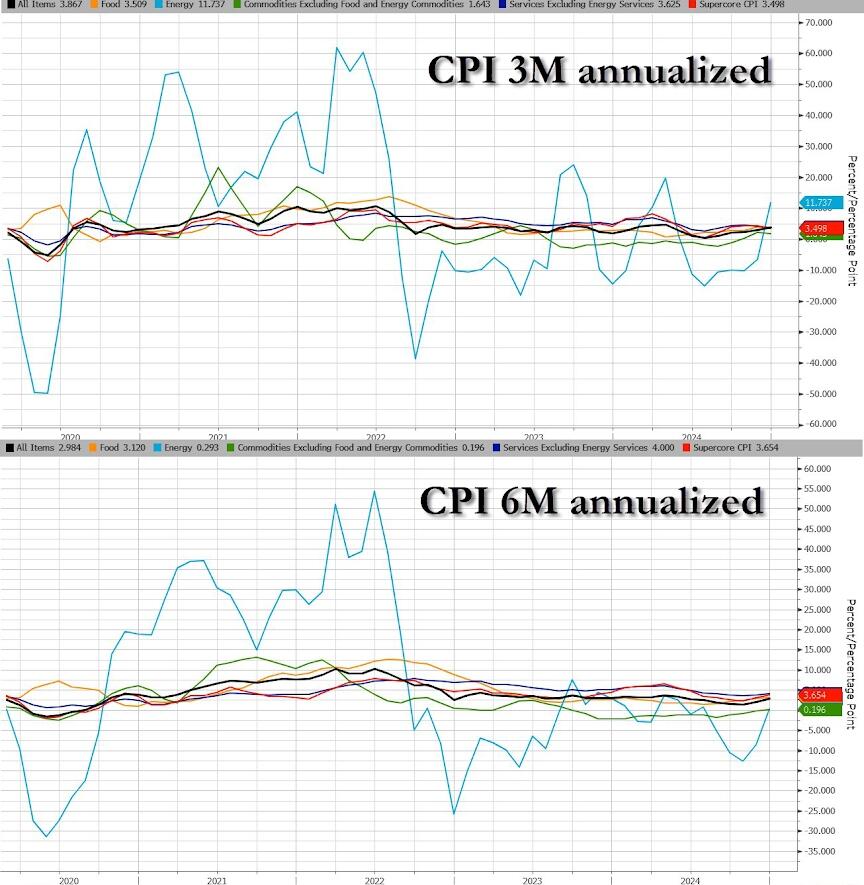
Overall, it’s energy costs that are re-emerging as a drive of inflation… thanks Joe!
Source: Bloomberg
…and Energy prices aren’t going down anytime soon in the CPI world… thanks Joe!
Source: Bloomberg
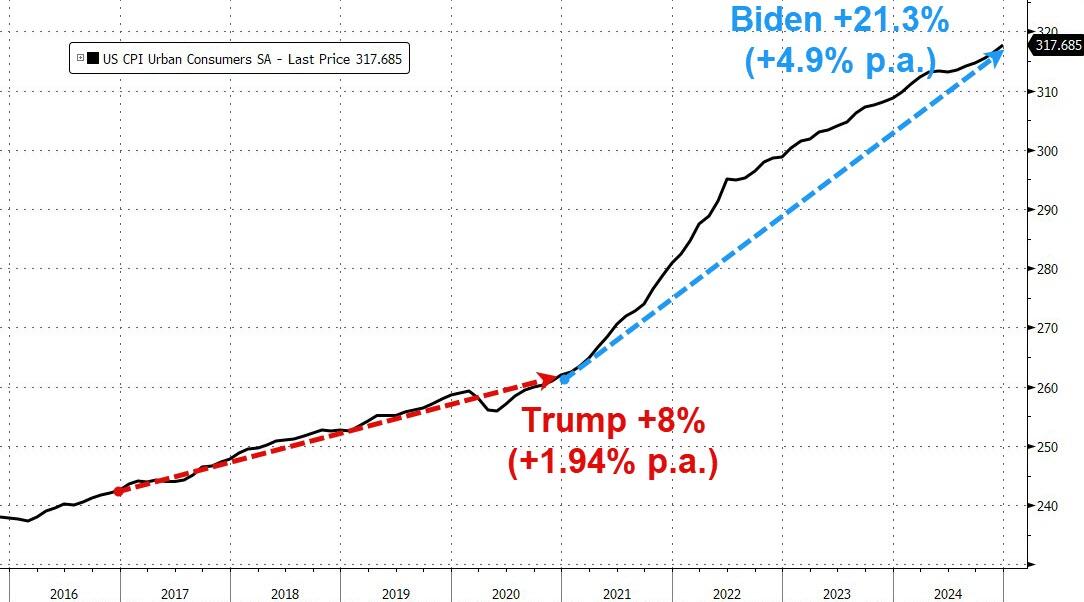
While Producer Prices under Biden rose at triple the rate they did under Trump, Consumer Prices soared 21.25% under Biden (+4.9% p.a.) vs 8%, 1.94% p.a. under Trump…
Source: Bloomberg
Finally, equity traders were braced for a volatile day ahead of the print, with options implying moves of 1.1% in either direction for the S&P 500, the most for a CPI day since March 2023.
The delinquency rate for commercial mortgage-backed securities (CMBS) tied to office properties reached 10.4 percent in November 2024, approaching the 10.7 percent peak reached during the 2008 financial crisis. The ascent is the fastest two-year increase on record, with rates climbing 8.8 percentage points since late 2022, significantly outrunning the 6.3-point rise seen during the financial crisis nearly 15 years ago.
The office real estate sector has been grappling with a severe downturn for several years now, but are accelerating recently as they are driven by persistently high vacancy rates and declining rents. Property values, particularly for older office buildings, have plummeted, with many losing 50 to 70 percent of their market value and in some cases becoming effectively worthless. Those conditions have left real estate portfolio managers and building owners unable to borrow, refinance or sell properties, contributing to rising delinquencies and foreclosures. (Mortgages become effectively delinquent when payments are missed beyond a standard 30-day grace period.)
On the CMBS front, there have been no upgrades in 2023 and 2024.
Efforts to convert office buildings into residential spaces are increasing but remain limited by structural and economic constraints. Many office towers are unsuitable for conversion due to their large floor plates or prohibitively high retrofitting costs which often exceed the cost of demolition and rebuilding. In 2024, 73 office-to-residential conversions were completed, with an additional 30 underway. Despite plans to increase the pace in 2025, the cumulative impact remains minimal, addressing just 7.9 percent of the 902 million square feet of vacant office space nationwide.
NEW YORK, NOVEMBER 26, 2024: S&P Dow Jones Indices (S&P DJI) today released the September 2024 results for the S&P CoreLogic Case-Shiller Indices. The leading measure of U.S. home prices recorded a 3.9% annual gain in September 2024, a slight deceleration from the previous annual gains in 2024.
YEAR-OVER-YEAR The S&P CoreLogic Case-Shiller U.S. National Home Price NSA Index, covering all nine U.S. census divisions, reported a 3.9% annual return for September, down from a 4.3% annual gain in the previous month. The 10-City Composite saw an annual increase of 5.2%, down from a 6.0% annual increase in the previous month. The 20-City Composite posted a year-over-year increase of 4.6%, dropping from a 5.2% increase in the previous month. New York again reported the highest annual gain among the 20 cities with a 7.5% increase in September, followed by Cleveland and Chicago with annual increases of 7.1% and 6.9%, respectively. Denver posted the smallest year-over-year growth with 0.2%.
Table 2 below summarizes the results for September 2024. Cleveland and New York top 7% YoY.


You must be logged in to post a comment.