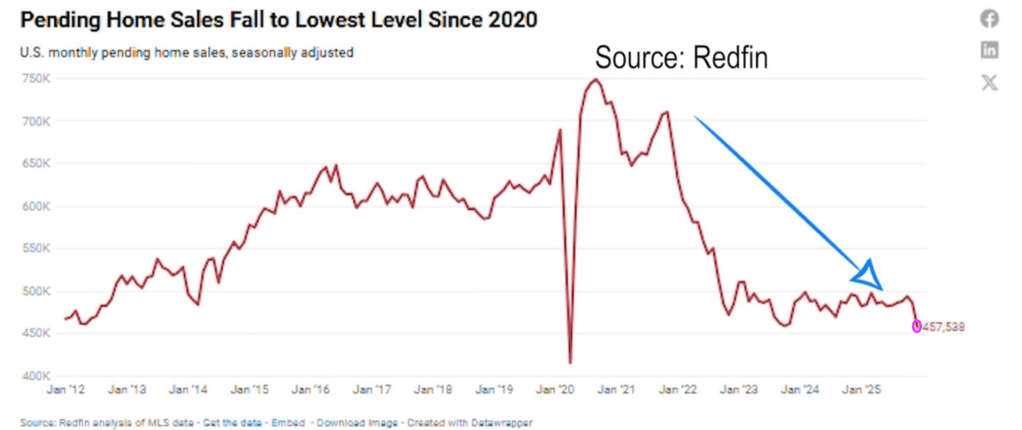
According to Redfin, US pending home sales fell to the lowest since the Covid epidemic of 2020.
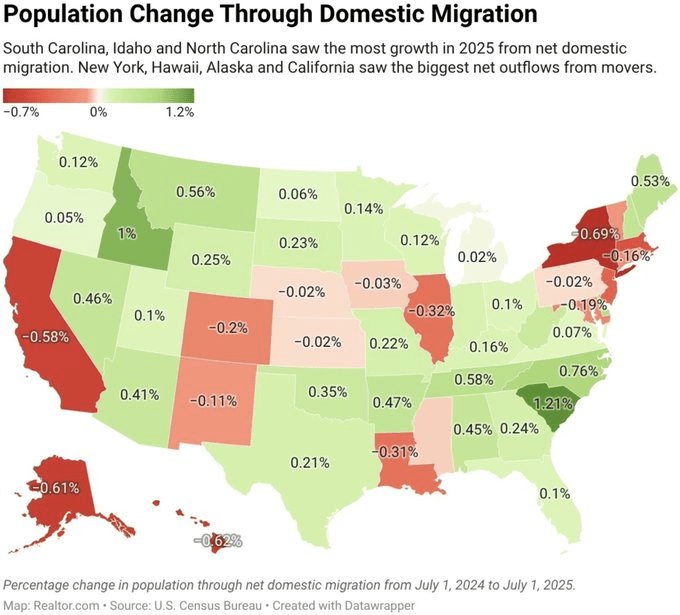
With the population change from state to state, like New York, California and Illinous to South Carolina and Idaho (home of Napolean Dynamite), it is no wonder that the housing market is in a state of turmoil.
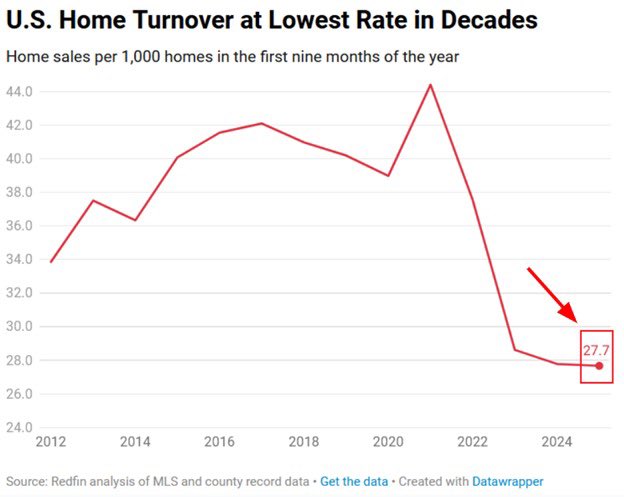
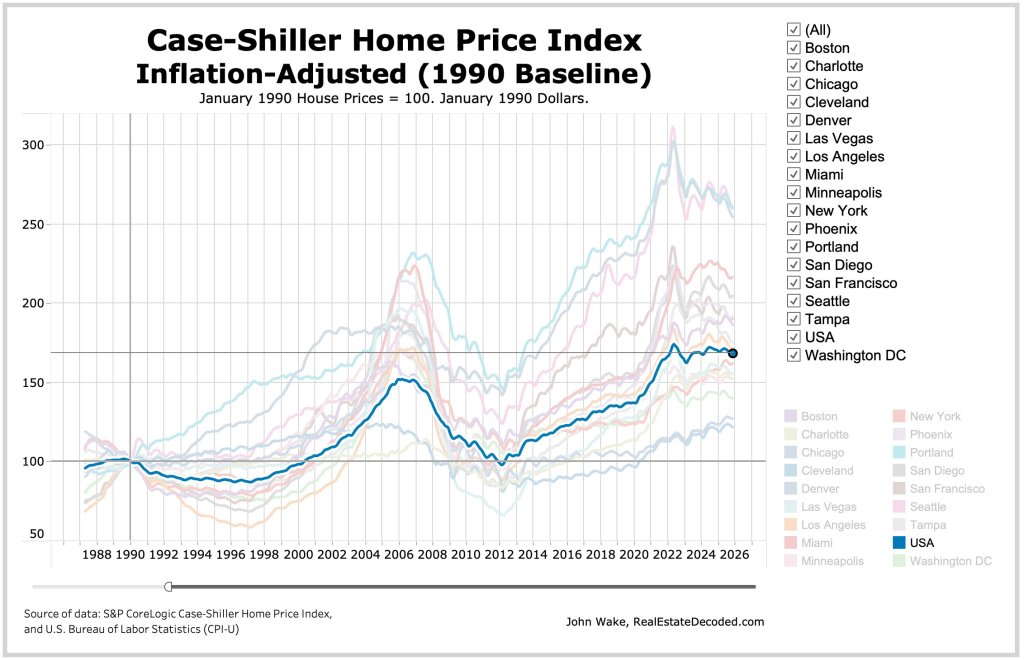
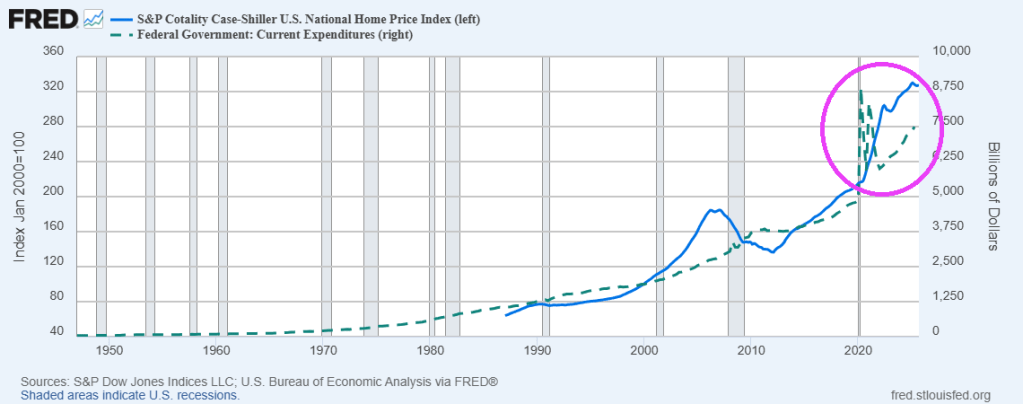
Home prices exploded under Biden and Covid Federal spending. Making housing unaffordable for millions. Now the turnover rates for homes is at its lowesst rate in decades.
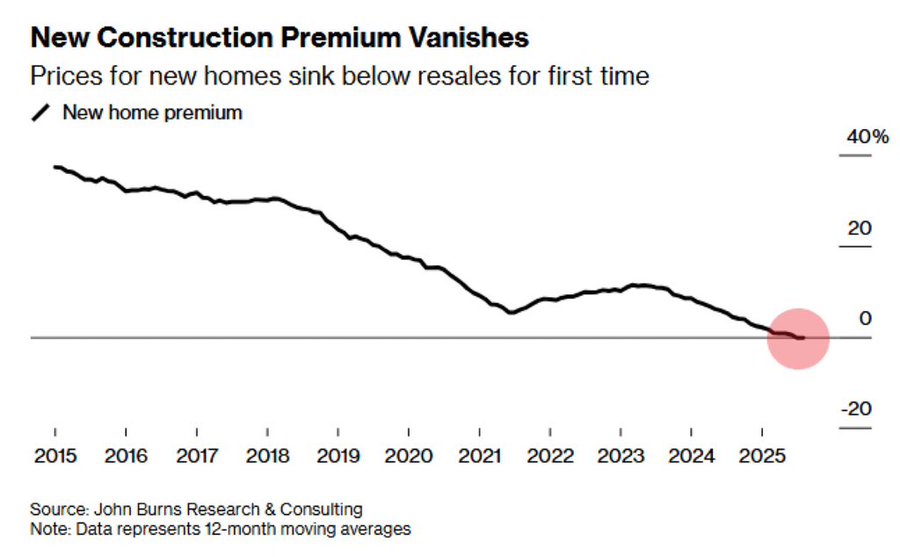
Existing homes are now more expensive than new homes.
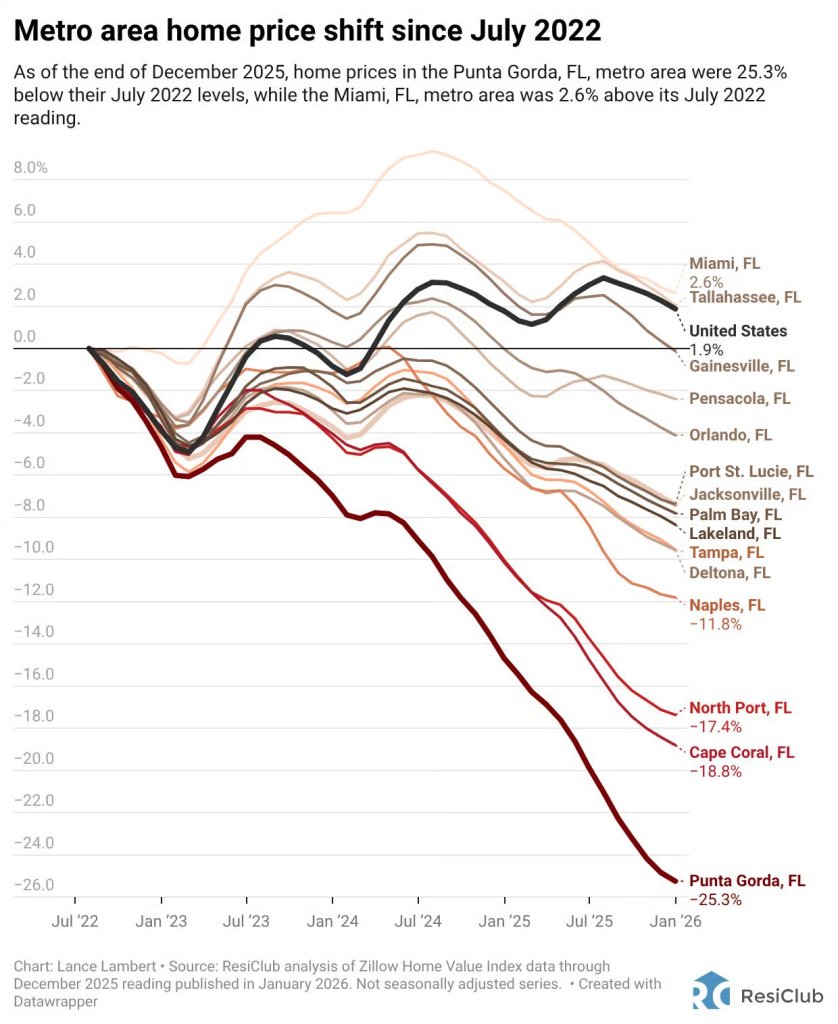
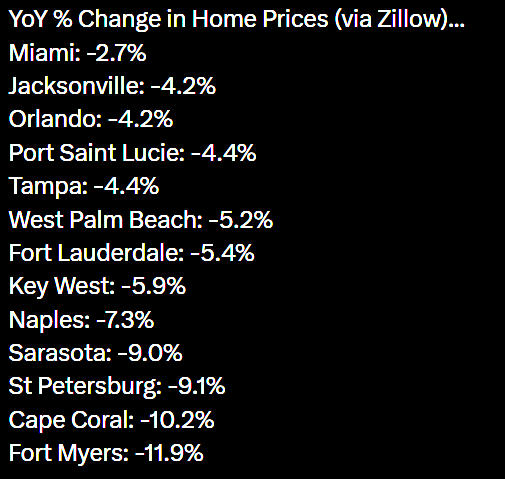
Florida housing is getting gut-punched from Naples to Punta Gorda.
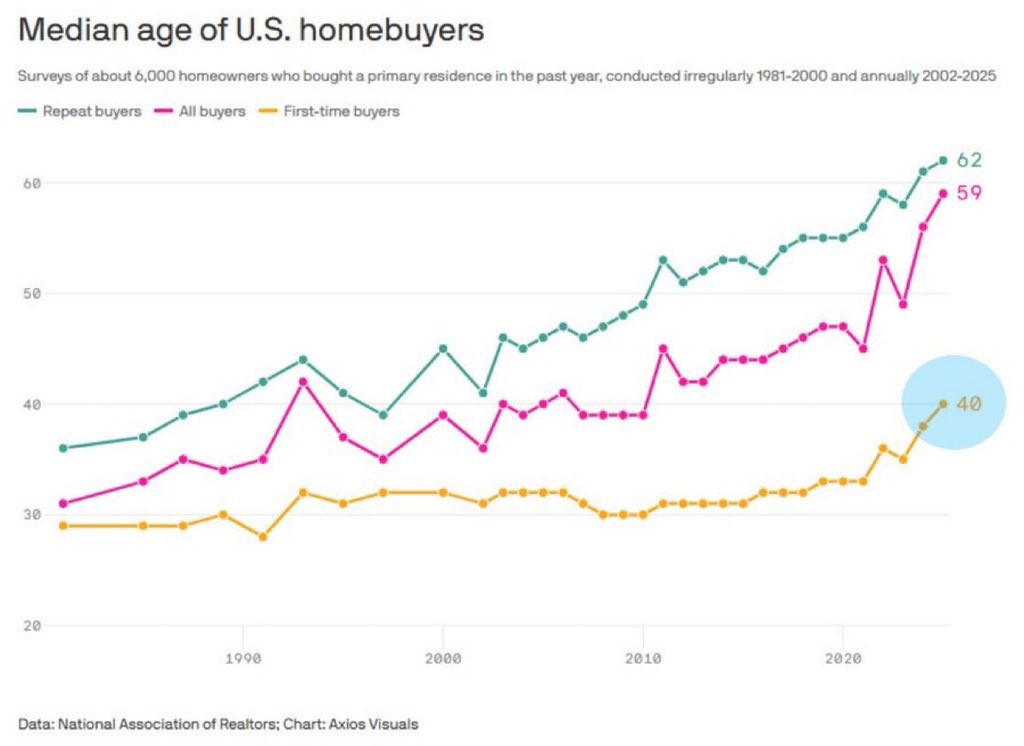
Yikes! Median age of first time homebuyers is 40.
Fortunately, Joe Biden is out of office. But Chuck Schumer may make a comeback and restart the insane Covid-era spending. Schumer, the penultimate knucklehead in Congress, approved Ketanji Brown Jackson to sit on the Supreme Court of the USA.
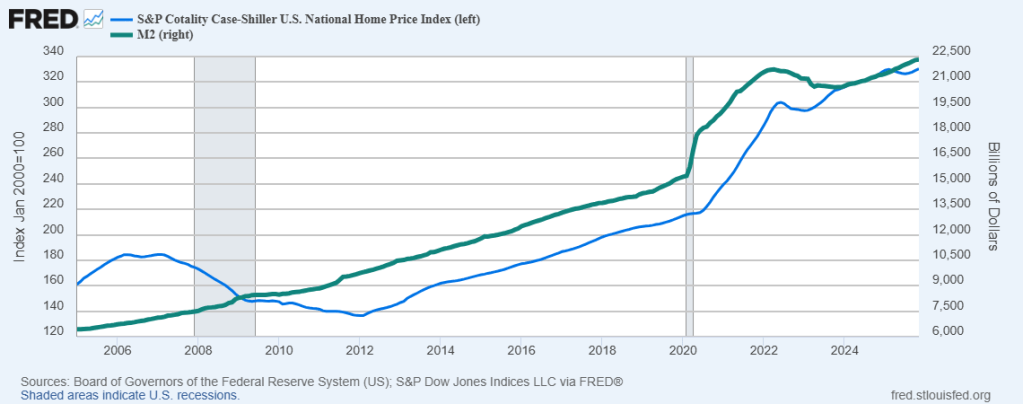
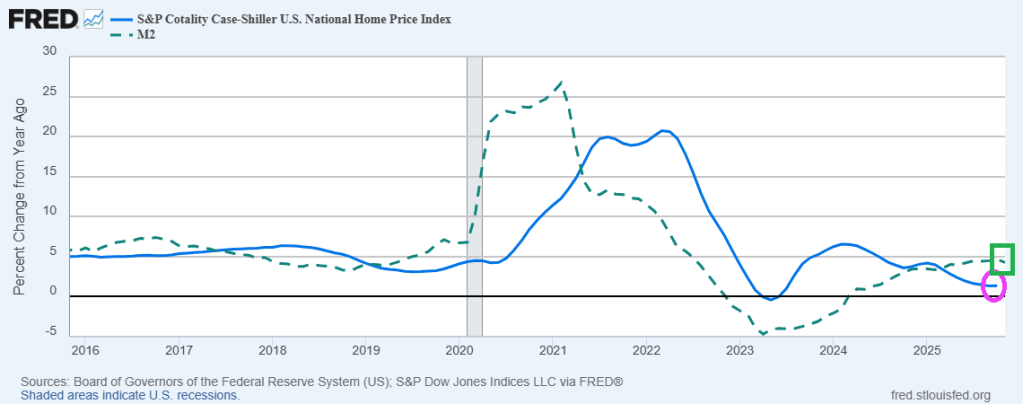
Keep on printing money. It seems that home price growth requires The Fed to keep printing money.
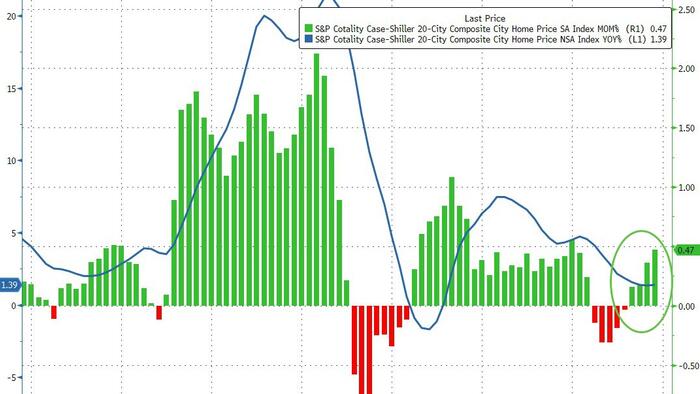
S&P/Case-Shiller released the monthly Home Price Indices for November (“November” is a 3-month average of September, October and November closing prices). September closing prices include some contracts signed in July, so there is a significant lag to this data. Here is a graph of the month-over-month (MoM) change in the Case-Shiller National Index Seasonally Adjusted (SA).
The S&P Cotality Case-Shiller U.S. National Home Price NSA Index posted a 1.4% annual gain for November, in line with the previous month.
Real home values declined as consumer inflation (2.7%) outpaced the National Index gain (1.4%) by 1.3 percentage points.
Regional divergence persisted: Midwestern and Northeastern markets led by Chicago (+5.7%) and New York (+5.0%) posted gains, while Sun Belt cities including Tampa (–3.9%), Phoenix (–1.4%), Dallas (–1.4%), and Miami (–1.0%) saw declines. … “Regional patterns continue to illustrate a stark divergence. Chicago leads all cities for a second consecutive month with a 5.7% year-over-year price increase, followed by New York at 5.0% and Cleveland at 3.4%. These historically steady Midwestern and Northeastern markets have maintained respectable gains even as overall conditions cool. By contrast, Tampa home prices are 3.9% lower than a year ago – the steepest decline among the 20 cities, extending that market’s 13-month streak of annual drops. Other Sun Belt boomtowns remain under pressure as well: Phoenix (-1.4%), Dallas (-1.4%), and Miami (-1.0%) each continue to see year-over-year declines, a dramatic turnaround from their pandemic-era strength.
“Monthly price changes were mixed but leaned negative in November, underscoring persistent softness. On a non-seasonally adjusted basis, 15 of the 20 major metro areas saw prices decline from October (versus 16 declines in the previous month). Only a handful of markets – including Los Angeles, San Diego, Miami, New York, and Phoenix – eked out slight gains before seasonal adjustment. After accounting for typical seasonal slowing, the National Index inched up just 0.4% for the month, indicating that price momentum remains muted. … The S&P Cotality Case-Shiller U.S. National Home Price NSA Index, covering all nine U.S. census divisions, reported a 1.4% annual gain for November. The 10-City Composite showed an annual increase of 2.0%, up from a 1.9% increase in the previous month. The 20-City Composite posted a year-over-year increase of 1.4%, up from a 1.3% increase in the previous month. … The pre-seasonally adjusted U.S. National Index saw a drop of 0.1% and the 20-City Composite Index fell 0.03%, while the 10-City Composite Index increased 0.1%.
After seasonal adjustment, the U.S. National Index reported a monthly increase of 0.4%, and both the 10-City Composite and 20-City Composite Indices posted month-over-month gains of 0.5%.
While its not the 2009, we do have a house price bubble that is deflating as The Fed slows M2 Money growth. However, we are witnessing rising foreclosure rates.
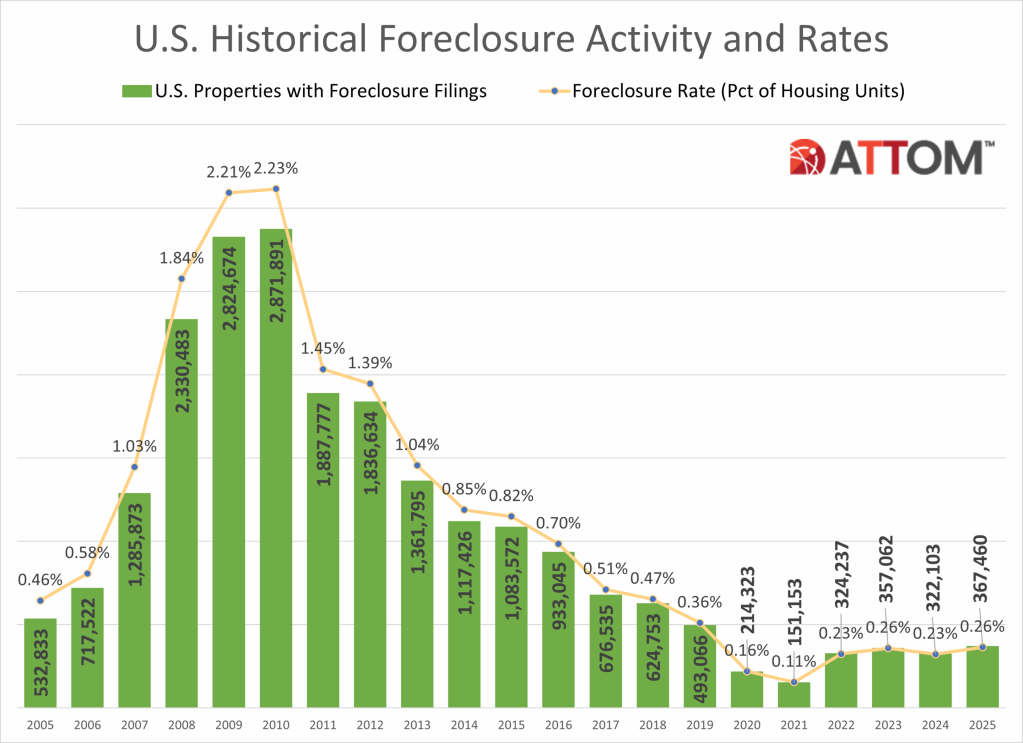
Lenders started the foreclosure process on 289,441 U.S. properties in 2025, up 14 percent from 2024, up 213 percent from the pandemic-era low in 2021, but down 14 percent form 2019 and down 86 percent from a peak of 2,139,005 in 2009.
States that saw the greatest number of foreclosure starts in 2025 included Texas (37,215 foreclosure starts); Florida (34,336 foreclosure starts); California (29,777 foreclosure starts); Illinois (15,010 foreclosure starts); and New York (13,664 foreclosure starts).
Those metropolitan statistical areas with a population greater than 1 million that saw the greatest number of foreclosure starts in 2025 included New York, NY (14,189 foreclosure starts); Chicago, IL (13,312 foreclosure starts); Houston, TX (13,009 foreclosure starts); Miami, FL (8,936 foreclosure starts); and Los Angeles, CA (8,503 foreclosure starts).
Bank repossessions increase year over year
Lenders repossessed 46,439 properties through foreclosures (REO) in 2025, up 27 percent from 2024 but down 68 percent from 143,955 in 2019, the last full year before pandemic-related declines, and down 96 percent from a peak of 1,050,500 in 2010.
States that saw the greatest number of REOs in 2025 included Texas (5,147 REOs); California (4,030 REOs); Pennsylvania (2,975 REOs); Florida (2,869 REOs); and Illinois (2,768 REOs).
Those metropolitan statistical areas with a population greater than 1 million that saw the greatest number of REOs in 2025 included Chicago, IL (2,033 REOs); New York, NY (1,462 REOs); Houston, TX (1,381 REOs); Detroit, MI (1,105 REOs); and Philadelphia, PA (1,100 REOs).
Florida, Delaware, and South Carolina record the worst foreclosure rates in 2025
States with the worst foreclosure rates in 2025 were Florida (1 in every 230 housing units with a foreclosure filing); Delaware (1 in every 240 housing units); South Carolina (1 in every 242 housing units); Illinois (1 in every 248 housing units); and Nevada (1 in every 248 housing units).
Rounding out the top 10 states with the worst foreclosure rates in 2025, were New Jersey (1 in every 273 housing units); Indiana (1 in every 302 housing units); Ohio (1 in every 307 housing units); Texas (1 in every 319 housing units); and Maryland (1 in every 326 housing units).
Lakeland, Columbia, and Cleveland post the worst metro foreclosure rates in 2025
Among 225 metropolitan statistical areas with a population of at least 200,000, those with the worst foreclosure rates in 2025 were Lakeland, FL (1 in every 145 housing units with a foreclosure filing); Columbia, SC (1 in every 165 housing units); Cleveland, OH (1 in every 187 housing units); Cape Coral, FL (1 in every 189 housing units); and Atlantic City, NJ (1 in every 192 housing units).
Metro areas with a population greater than 1 million, including Cleveland that had the worst foreclosure rates in 2025 were: Jacksonville, FL (1 in every 200 housing units); Las Vegas, NV (1 in every 210 housing units); Chicago, IL (1 in every 214 housing units); and Orlando, FL (1 in every 217 housing units).
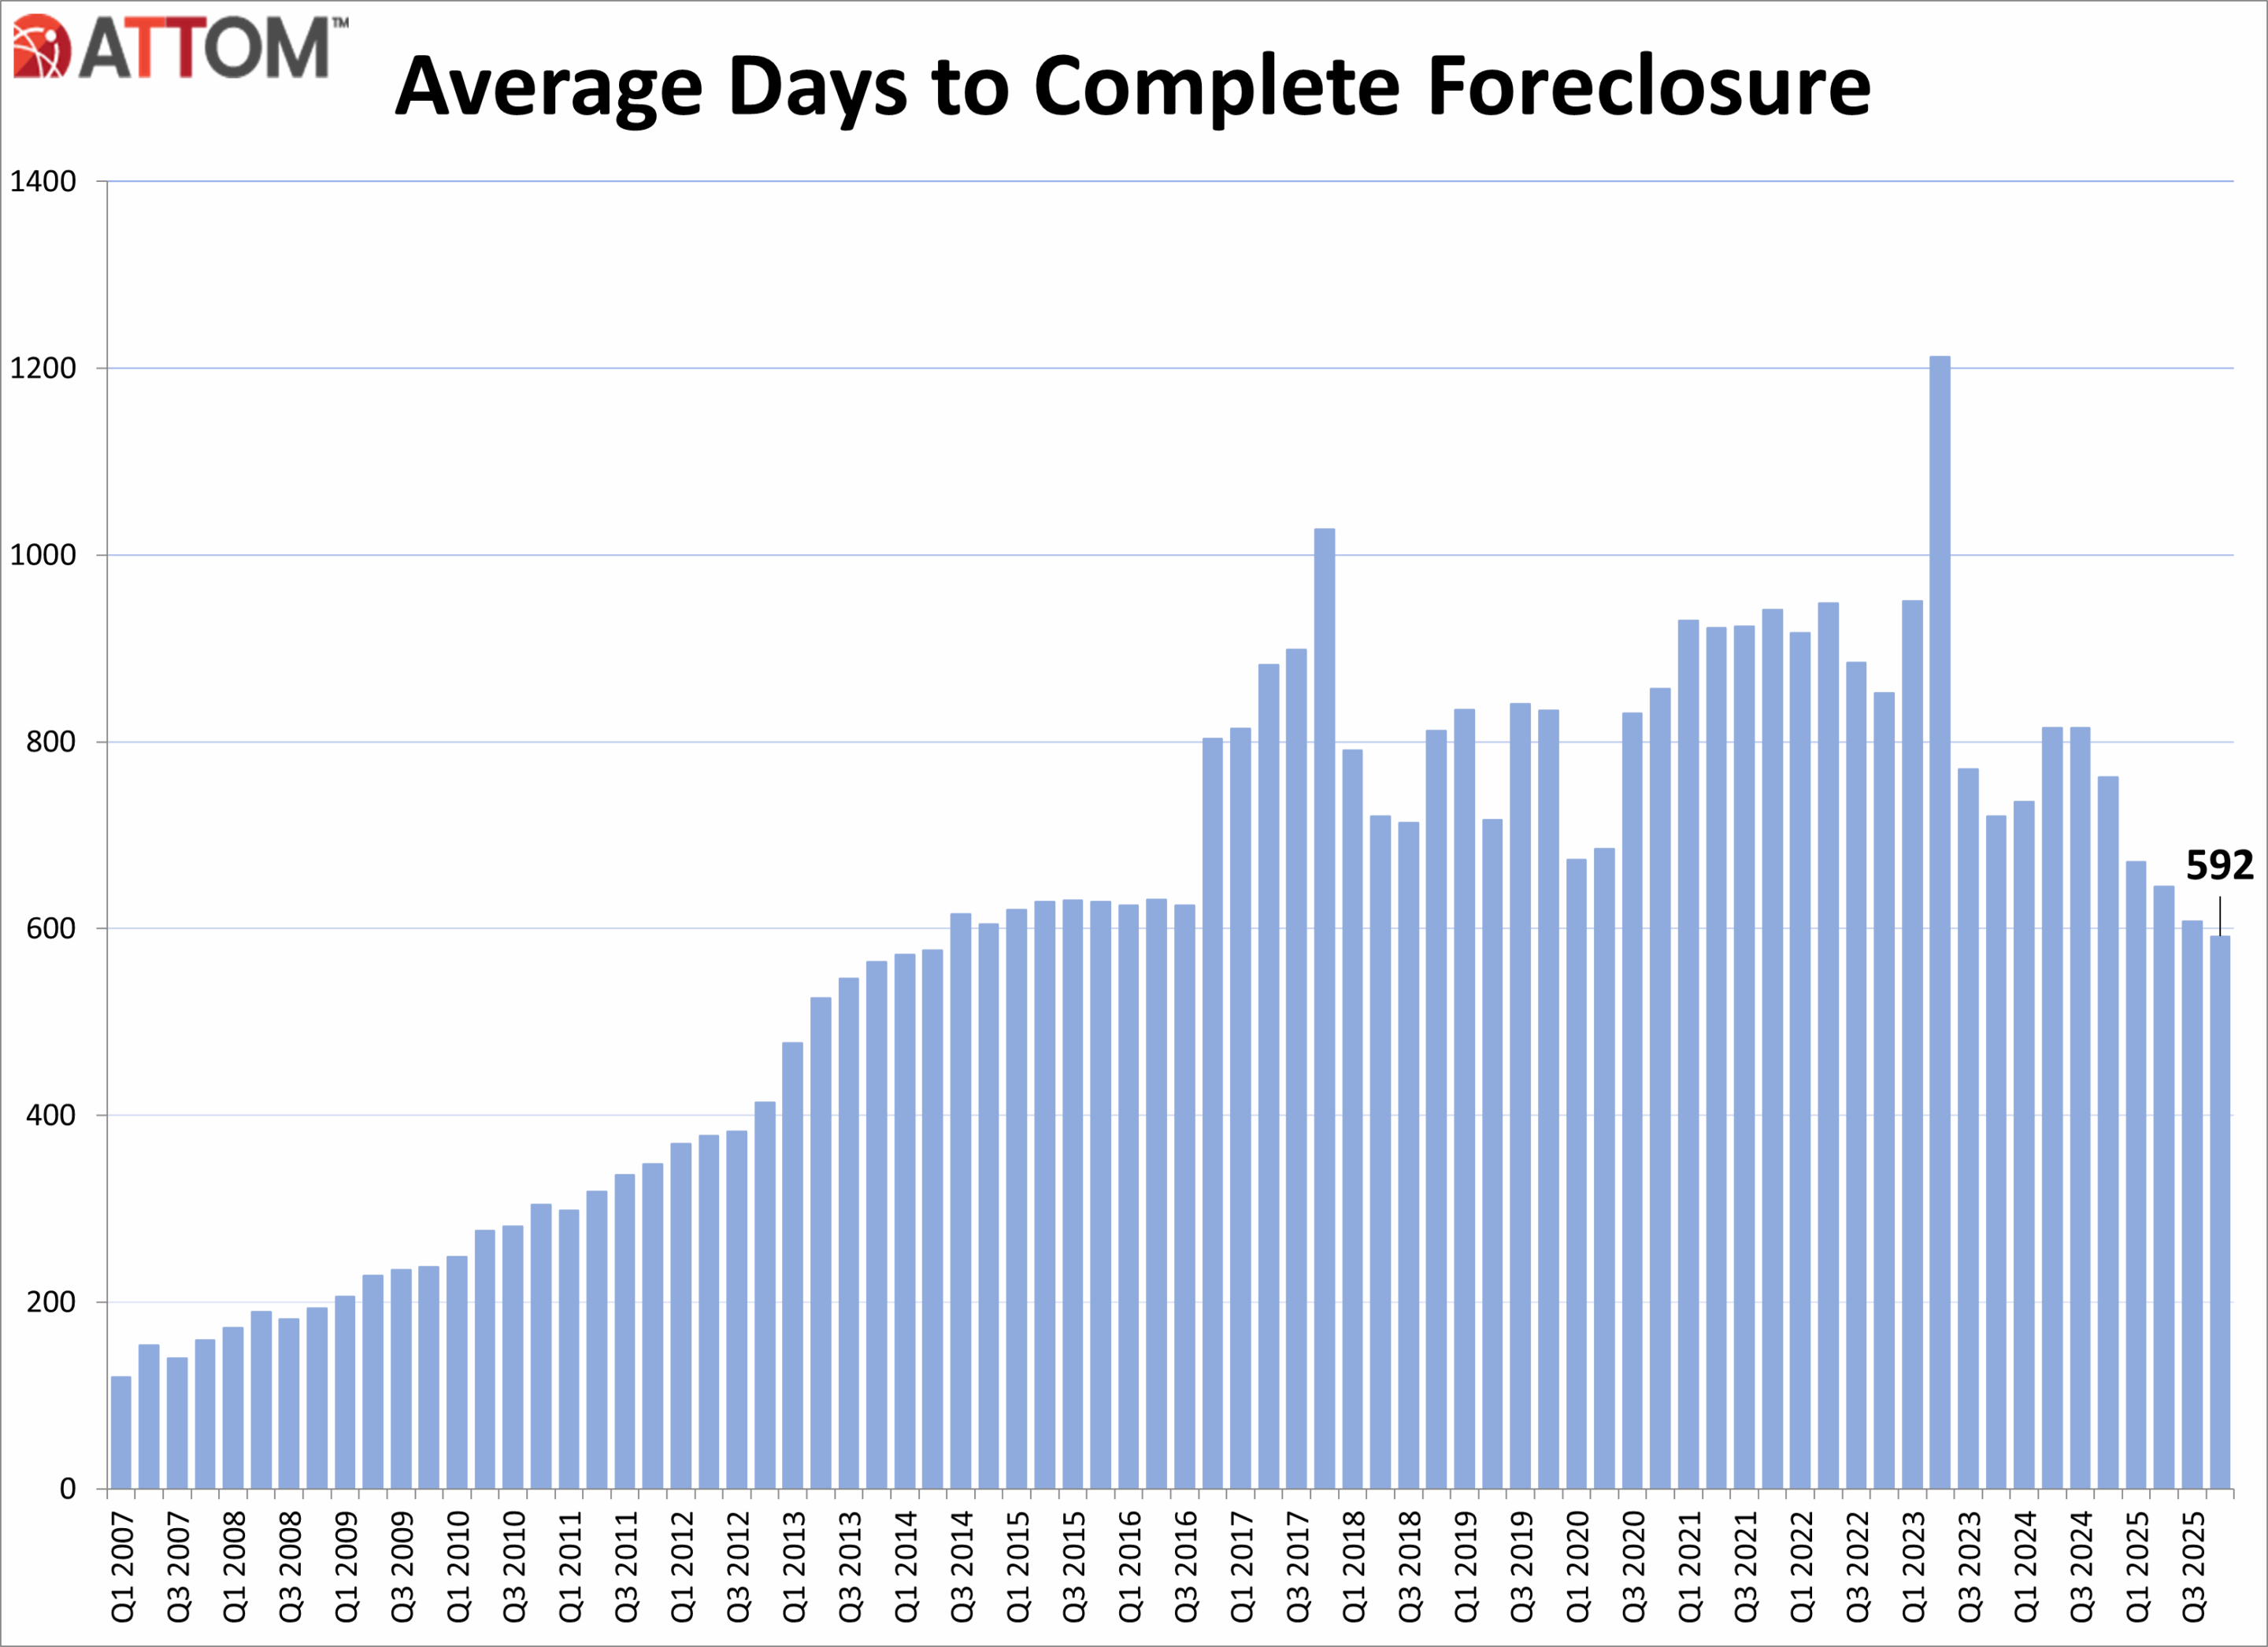
Average time to foreclose decreases
U.S. properties foreclosed in the fourth quarter of 2025 had been in the foreclosure process an average of 592 days, a 3 percent decrease from the previous quarter and a 22 percent decrease from a year ago.
States with the longest average time to foreclose in Q4 2025 were Louisiana (3,461 days); New York (1,998 days); Hawaii (1,760 days); Connecticut (1,600 days); and Kansas (1,594 days).
There was a total of 111,692 U.S. properties with foreclosure filings in Q4 2025, up 10 percent from the previous quarter and up 32 percent from a year ago.
Nationwide in Q4 2025, one in every 1,274 properties had a foreclosure filing.
December 2025 Foreclosure Activity Key Takeaways
Nationwide in December 2025, one in every 3,163 properties had a foreclosure filing.
States with the worst foreclosure rates in December 2025 were New Jersey (one in every 1,734 housing units with a foreclosure filing); South Carolina (one in every 1,917 housing units); Maryland (one in every 1,961 housing units); Delaware (one in every 2,044 housing units); and Florida (one in every 2,119 housing units).
28,269 U.S. properties started the foreclosure process in December 2025, up 19 percent from the previous month and up 46 percent from a year ago.
Lenders completed the foreclosure process on 5,953 U.S. properties in December 2025, up 53 percent from the previous month and up 101 percent from a year ago.
Conclusion
ATTOM’s Year-End 2025 Foreclosure Market Report shows that U.S. foreclosure activity increased in 2025, with foreclosure filings, starts, and bank repossessions all rising compared to 2024, signaling a continued shift toward more normalized market conditions. Despite the annual increases, foreclosure activity remains significantly below pre-pandemic levels and far below peaks seen during the last housing crisis. December 2025 and Q4 2025 data also showed increased foreclosure activity on both a monthly and annual basis.
Florida home prices are tanking with Fort Myers leading the collapse at -11.9% YoY.
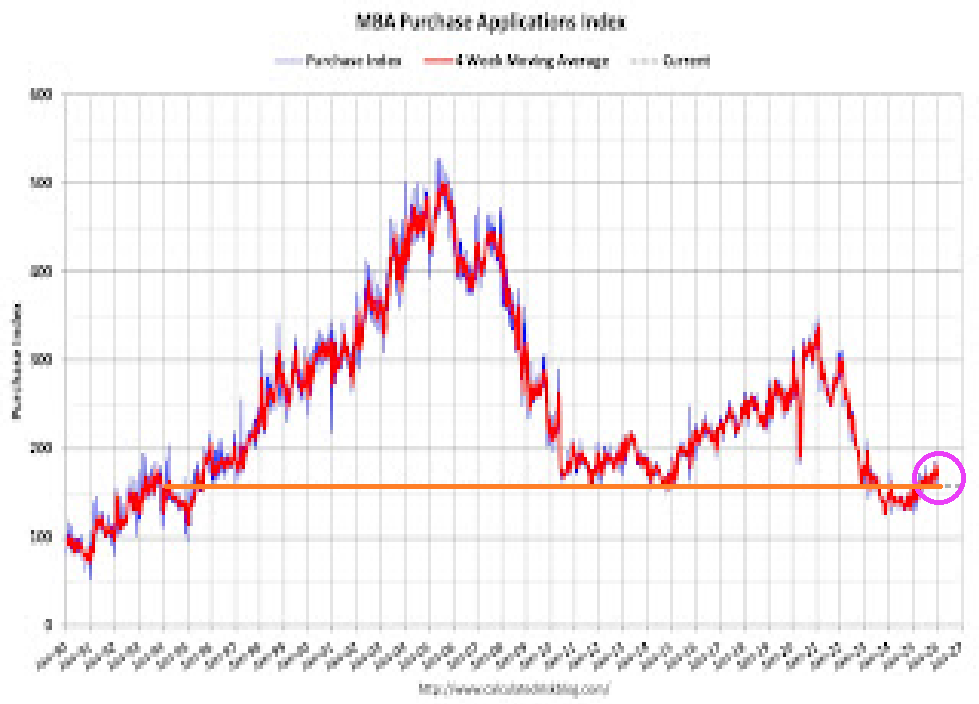
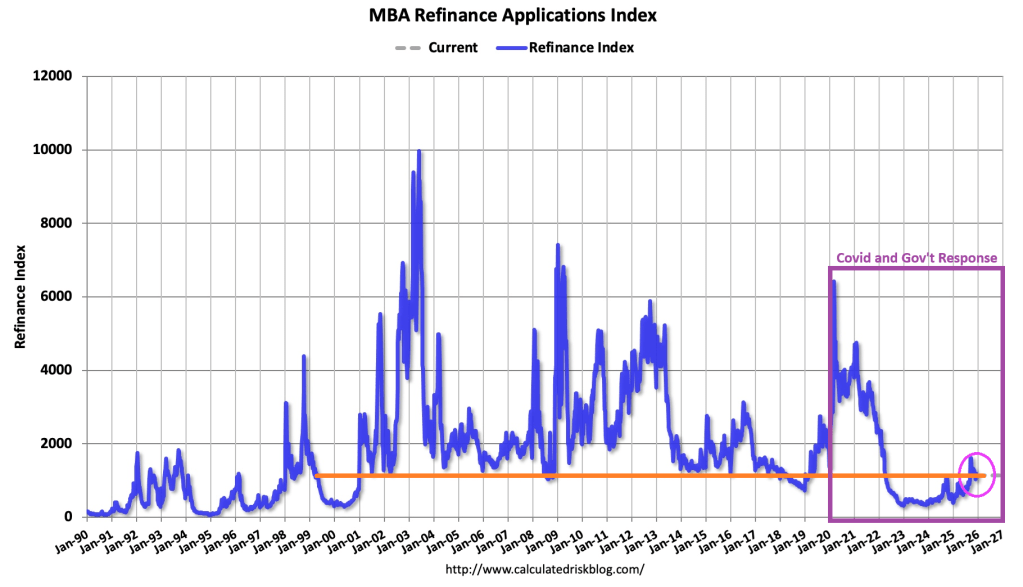
Mortgage demand is recovering slowly from Biden-era mismanagement. Rising mortgage rates coupled with rising home prices made housing affordability get flushed down the toilet.
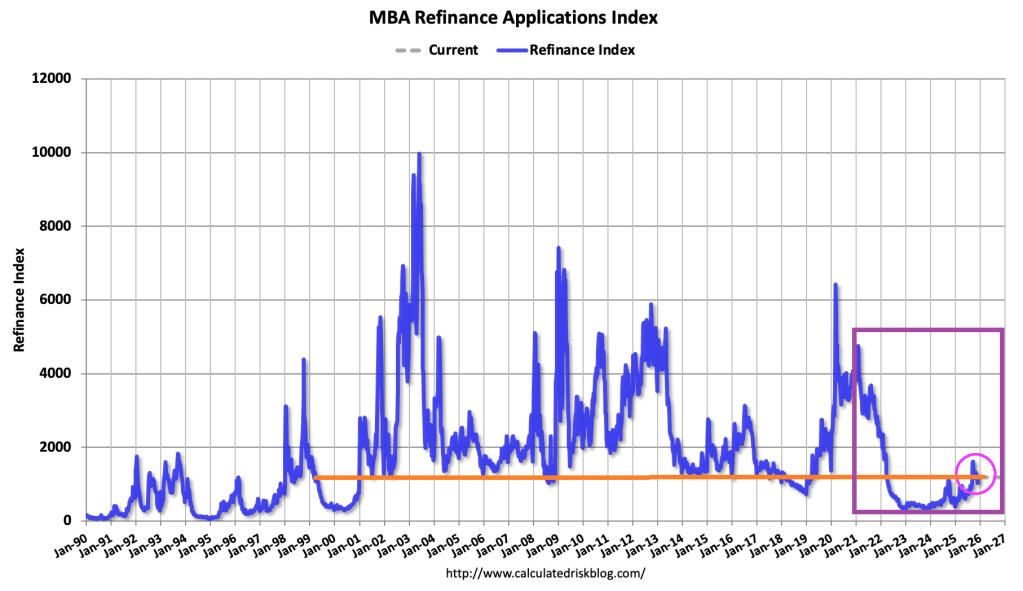
Mortgage applications decreased 9.7 percent from two weeks earlier, according to data from the Mortgage Bankers Association’s (MBA) Weekly Mortgage Applications Survey for the week ending January 2, 2026. The results include an adjustment for the holidays.
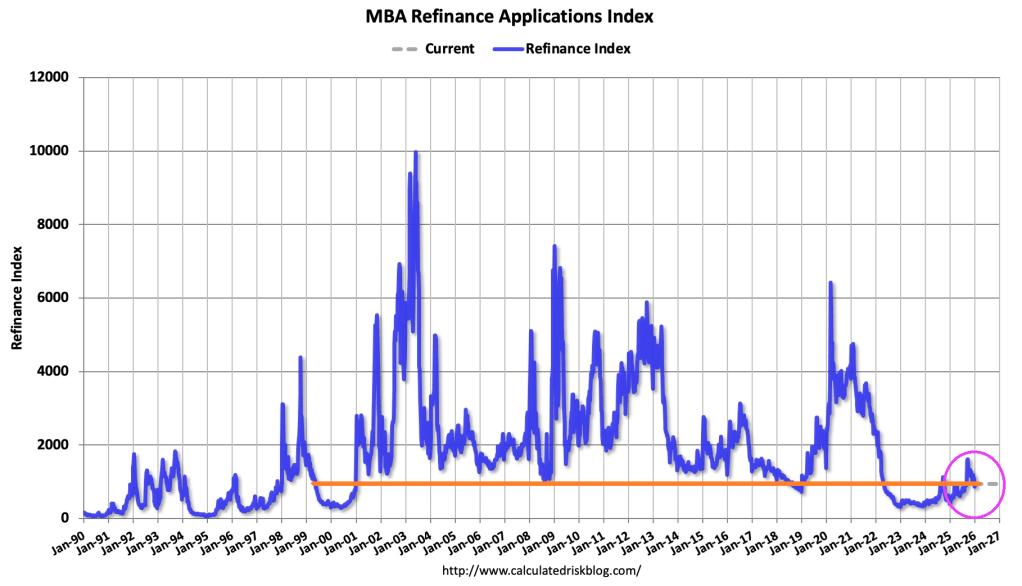
The Market Composite Index, a measure of mortgage loan application volume, decreased 9.7 percent on a seasonally adjusted basis from two weeks earlier. On an unadjusted basis, the Index decreased 28 percent compared with two weeks ago. The unadjusted Refinance Index decreased 31 percent from two weeks ago and was 108 percent higher than the same week one year ago. The seasonally adjusted Purchase Index decreased 6 percent from two weeks earlier. The unadjusted Purchase Index decreased 23 percent compared with two weeks ago and was 10 percent higher than the same week one year ago.
The holiday adjusted Refinance Index decreased 14 percent from two weeks ago and was 133 percent higher than the same week one year ago.
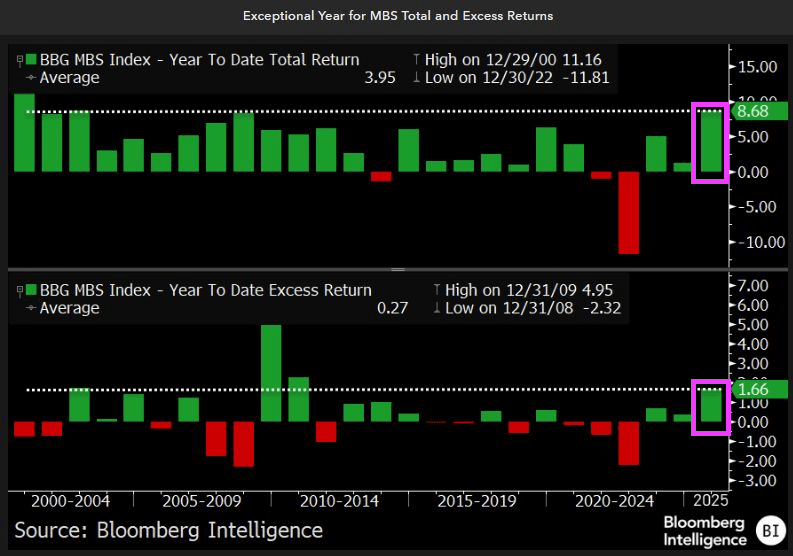
With all the breaking news about Maduro’s capture in Venezuela and the potential collapse of Iran’s Islamic government, I will provide some good news for investors about Mortgage-backed Securities (MBS).
Mortgage-backed securities (MBS) are capping off an exceptionally strong 2025 with further outperformance in December, beating the rest of the aggregate bond market on an excess return basis. Both total and excess returns for full year 2025 were the highest in more than a decade. MBS performance has been boosted by spread tightening as volatility declined and scarce net supply that was met with resilient demand, including renewed GSE and overseas buying.
Thanks to University of Chicago graduate Erica Adelberg.
Nobody wastes money like government, particularly around events like Covid where Federal spending led to housing prices spiking after Covid outbreak in 2020. This made housing unaffordable for most households. This in turn helped kill the mortgage market.
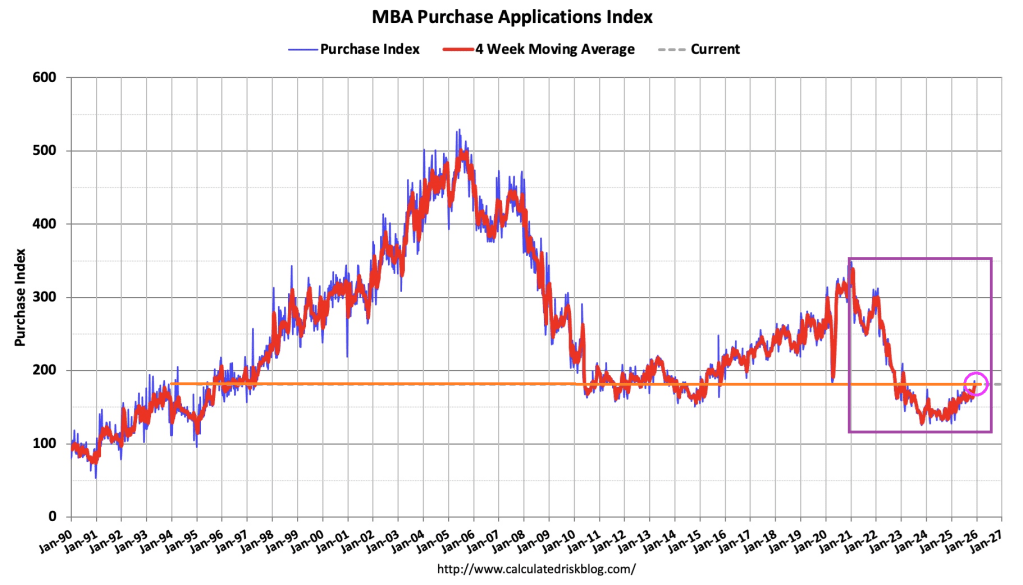
The Market Composite Index, a measure of mortgage loan application volume, decreased 3.8 percent on a seasonally adjusted basis from one week earlier. On an unadjusted basis, the Index decreased 5 percent compared with the previous week. The seasonally adjusted Purchase Index decreased 3 percent from one week earlier. The unadjusted Purchase Index decreased 7 percent compared with the previous week and was 13 percent higher than the same week one year ago.
The Refinance Index decreased 4 percent from the previous week and was 86 percent higher than the same week one year ago.
Once again, the government response to the Wuhan Covid virus of 2020 helped drive up housing prices killing off mortgage demand.
Hallelujah, I love this economy so! Of course, former First Lady Jill Biden is on the national tour trashing the economy saying it was “perfect” under Joe Biden.
The Market Composite Index, a measure of mortgage loan application volume, increased 4.8 percent on a seasonally adjusted basis from one week earlier. On an unadjusted basis, the Index increased 49 percent compared with the previous week. The seasonally adjusted Purchase Index decreased 2 percent from one week earlier. The unadjusted Purchase Index increased 32 percent compared with the previous week and was 19 percent higher than the same week one year ago.
The Refinance Index increased 14 percent from the previous week and was 88 percent higher than the same week one year ago.
Compared to the prior week’s data, which included an adjustment for the Thanksgiving holiday, mortgage application activity increased last week, driven by an uptick in refinance applications,” said Joel Kan, MBA’s Vice President and Deputy Chief Economist. “Conventional refinance applications were up almost 8 percent and government refinances were up 24 percent as the FHA rate dipped to its lowest level since September 2024. Conventional purchase applications were down for the week, but there was a 5 percent increase in FHA purchase applications as prospective homebuyers continue to seek lower downpayment loans. Overall purchase applications continued to run ahead of 2024’s pace as broader housing inventory and affordability conditions improve gradually.
The average contract interest rate for 30-year fixed-rate mortgages with conforming loan balances ($806,500 or less) increased to 6.33 percent from 6.32 percent, with points increasing to 0.60 from 0.58 (including the origination fee) for 80 percent loan-to-value ratio (LTV) loans.
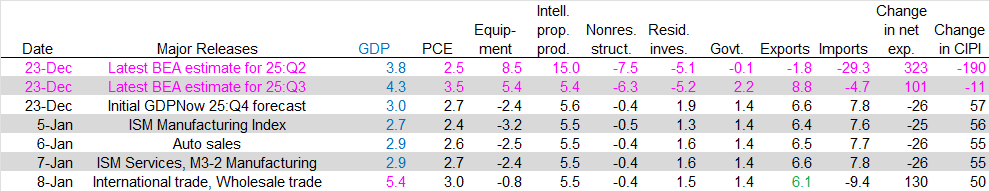
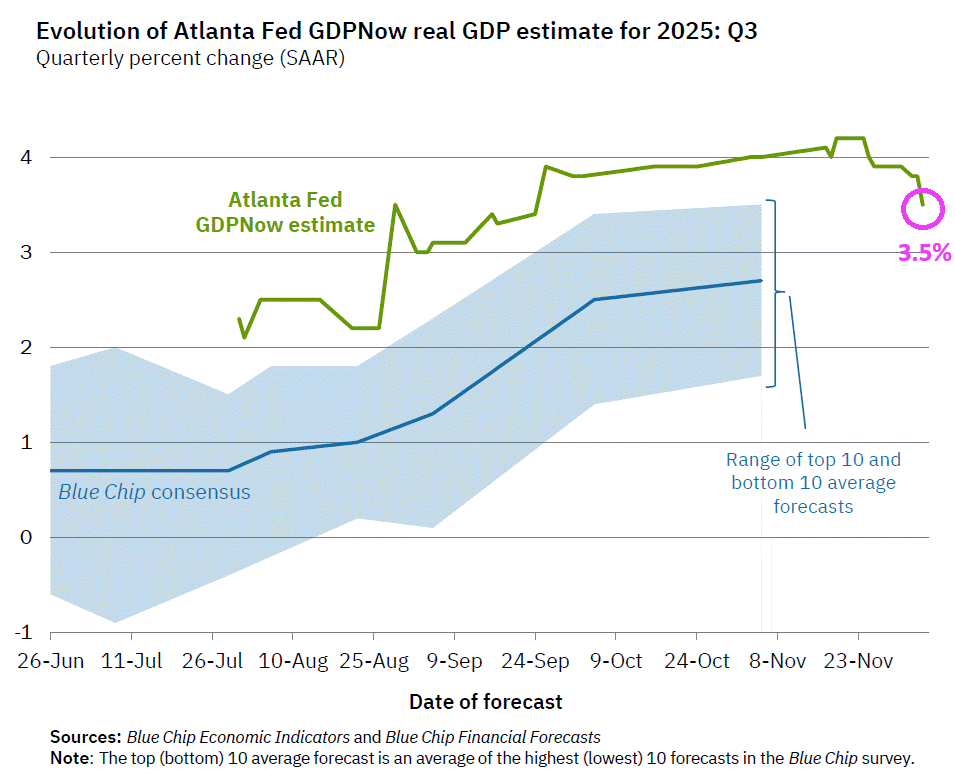
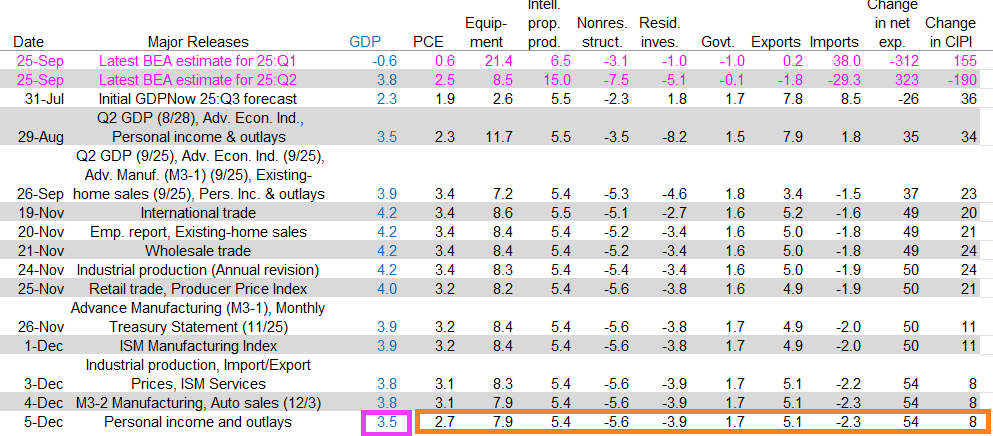
The GDPNow model estimate for real GDP growth (seasonally adjusted annual rate) in the third quarter of 2025 is 3.5 percent on December 5, down from 3.8 percent on December 4. After this morning’s personal income and outlays release from the US Bureau of Economic Analysis, the nowcast for third-quarter real personal consumption expenditures growth declined from 3.1 percent to 2.7 percent.
Unfortunately, residential and non-residential construction are negative as are imports.


You must be logged in to post a comment.