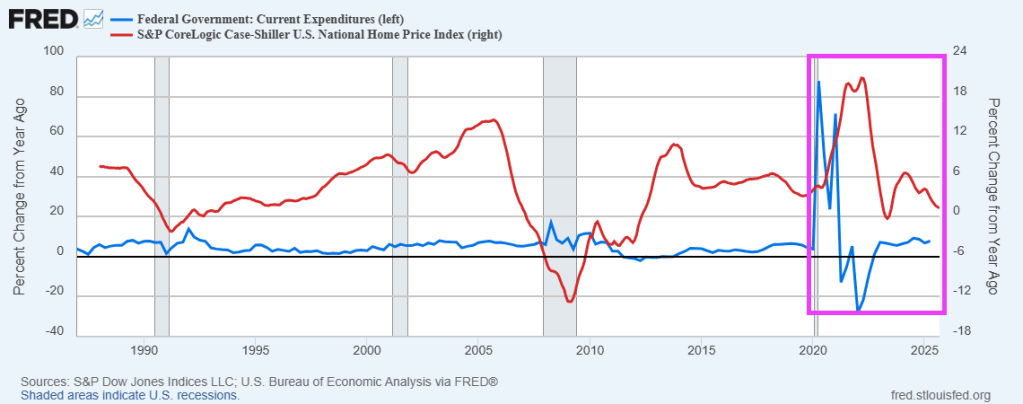
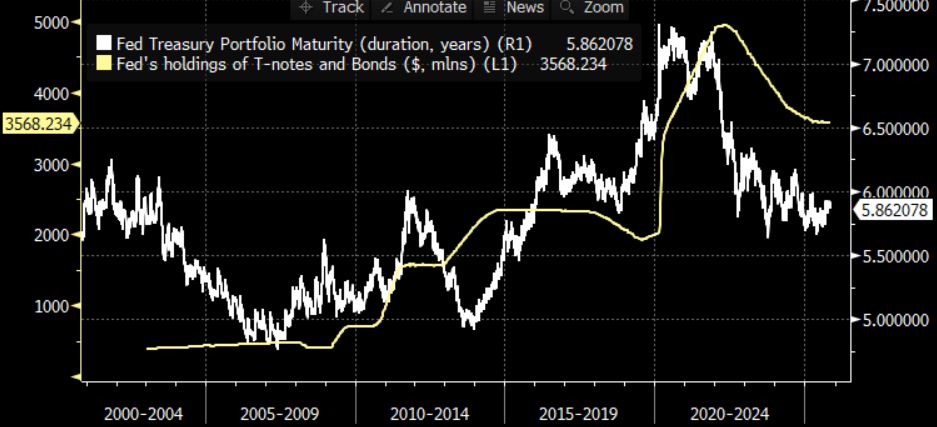
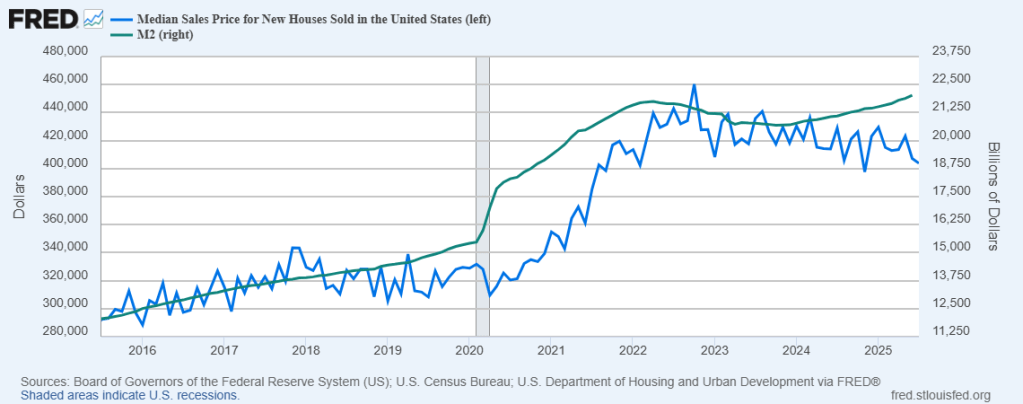
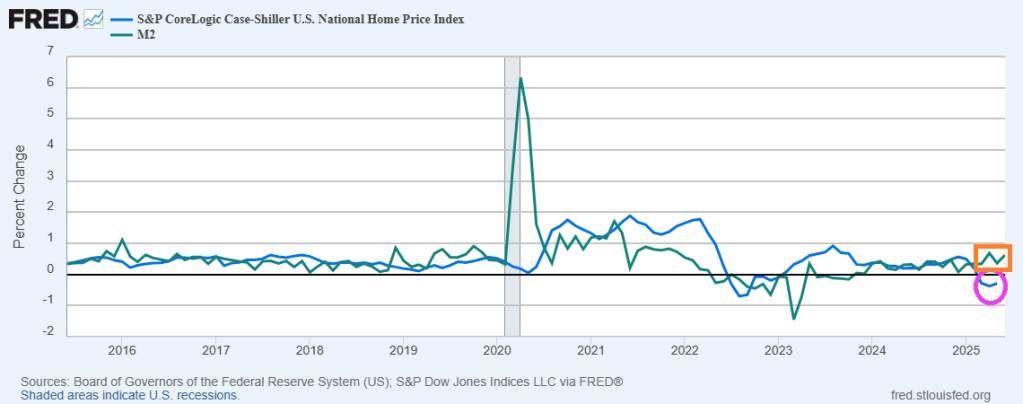
Roll out the barrel! As in Fed money printing.
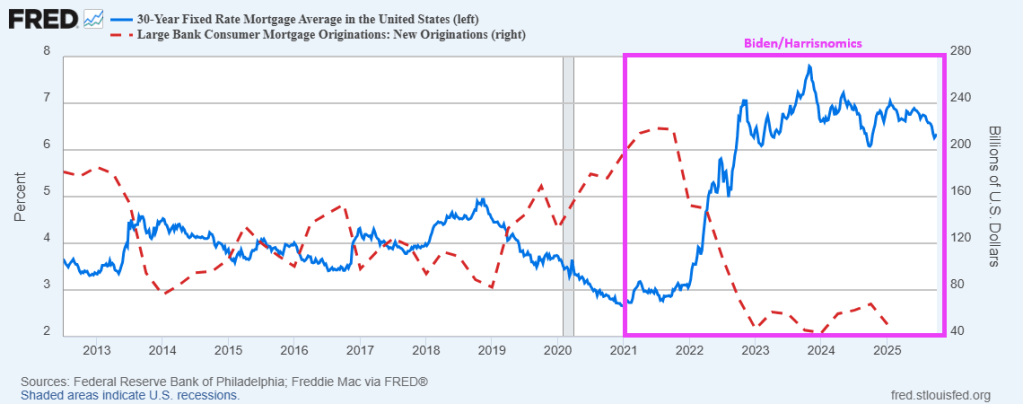
How can the current housing disaster be fixed? One answer is to build more homes (made difficult by local government zoning and building policies). Another is increase household income. But Fed money printing is the easiest way to increase home prices.
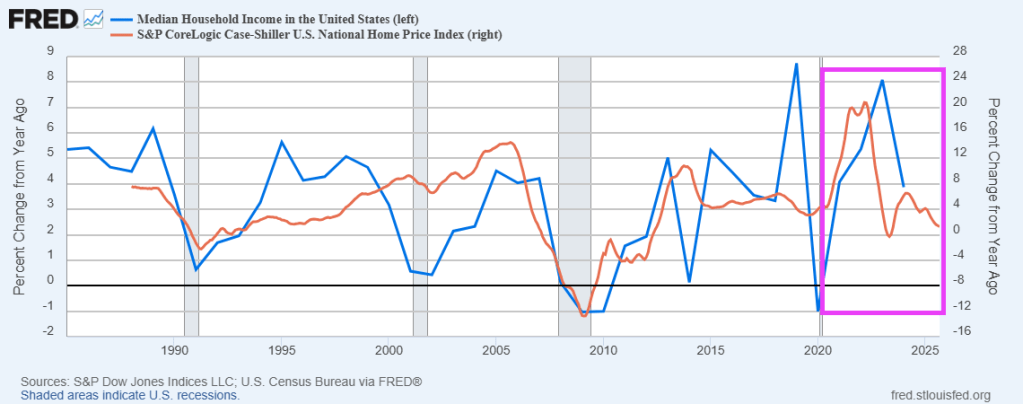
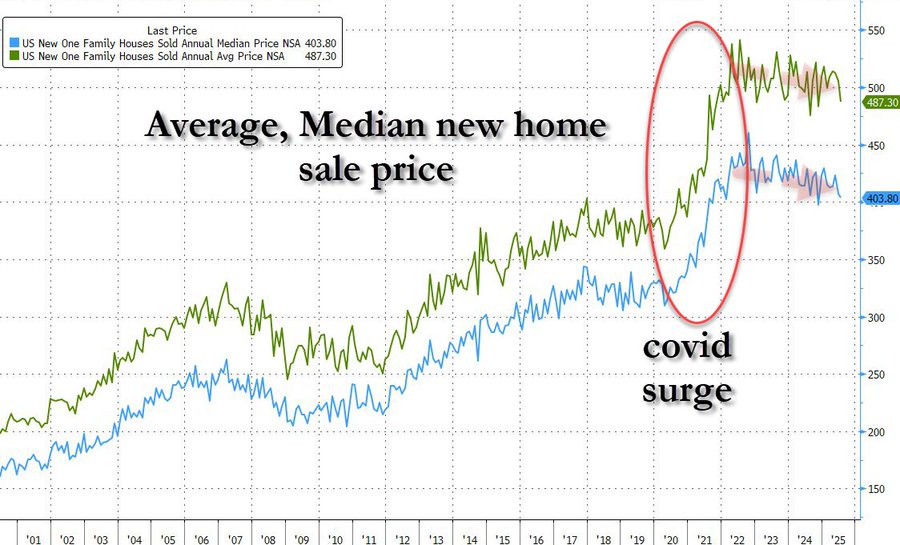
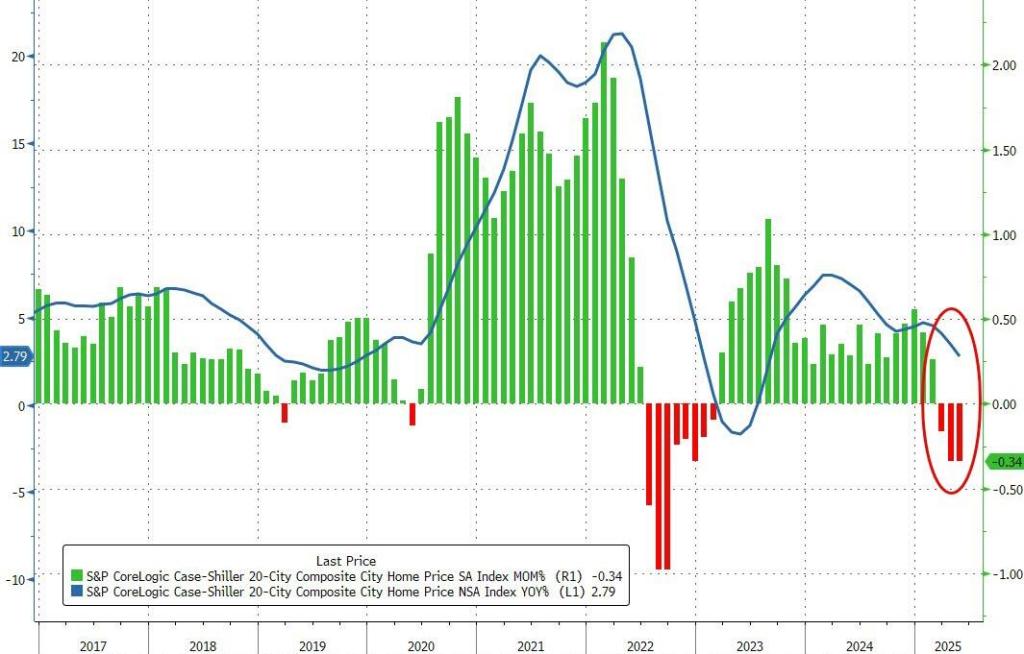
Since the Federal government spending spree associated with Covid ended, median household income has declined. But so have home prices.
But in terms of home price growth compared to median household income, you can see that home price growth has slowed after the Covid spending spike, but so did median household income.
Pray that The Fed doesn’t resort to trying to fix the housing market. They will only make things worse.


You must be logged in to post a comment.