Dazed And Confused? Existing Home Sales Rose 0.8% YoY In July, Median Existing Home Prices Up 0.2% From One Year Ago (And Why Fed Rate Cuts Won’t Matter)

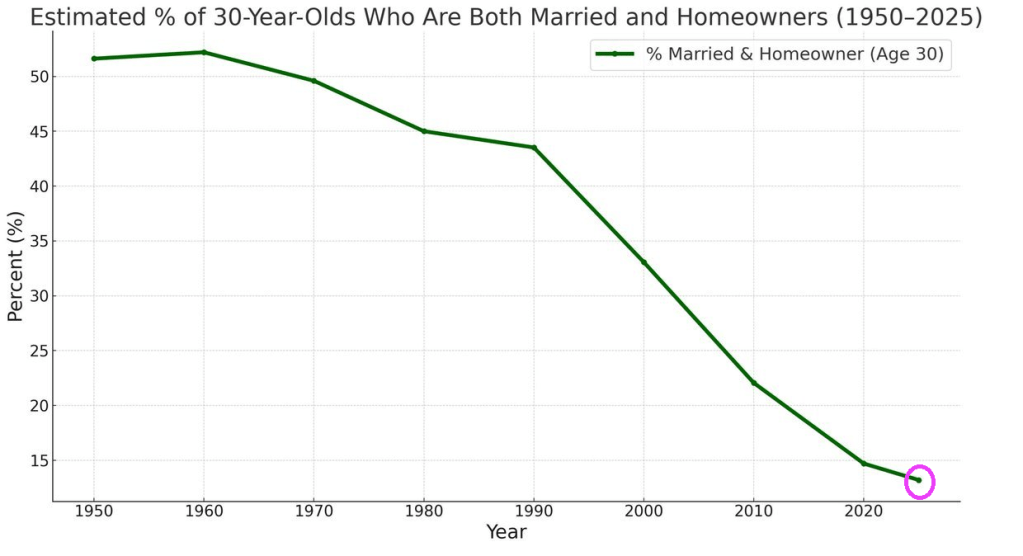
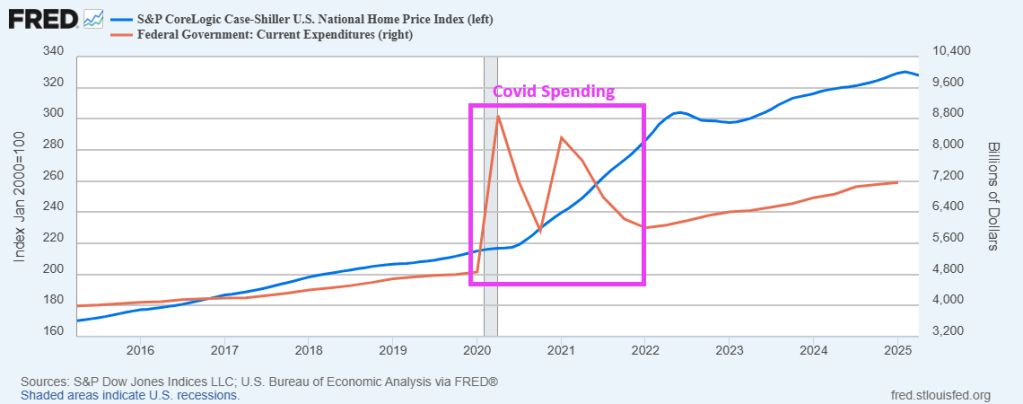
The Federal Reserve is Dazed and Confused. Their money printing is making housing progressively more expensive and unaffordable.

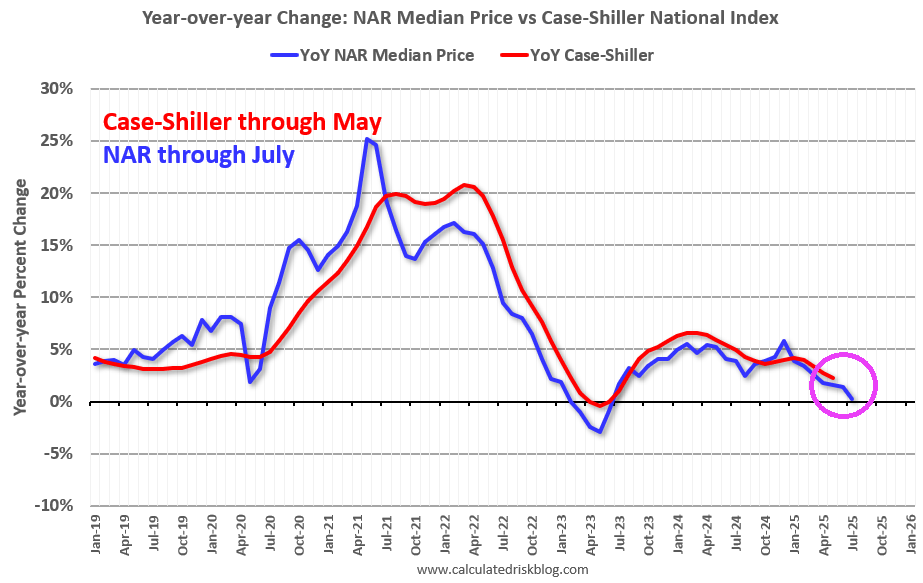
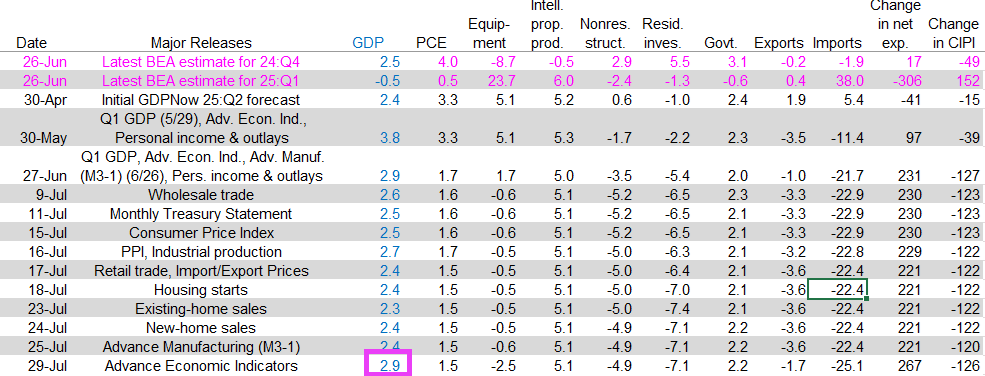
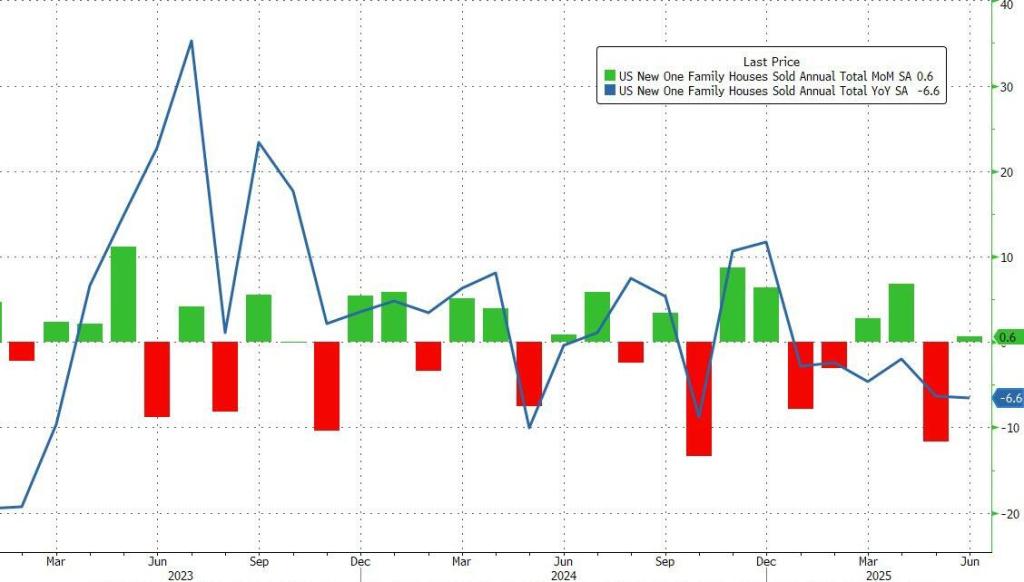
Existing-home sales increased by a measley 2.0% in July, according to the National Association of REALTORS® Existing-Home Sales Report.

Month-over-month sales increased in the Northeast, South, and West, and fell in the Midwest. Year-over-year, sales rose in the South, Northeast, and Midwest, and fell in the West.

• 2.0% increase in existing-home sales – seasonally adjusted annual rate of 4.01 million in July.

Year-over-year: 0.8% increase in existing-home sales

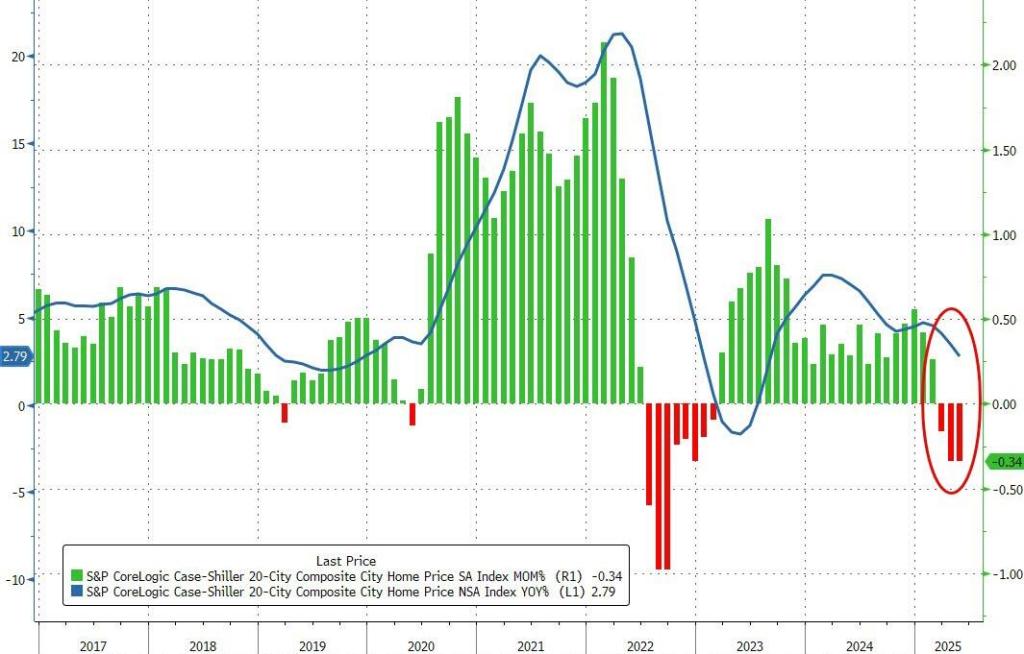
Median existing-home price for all housing types, up 0.2% from one year ago ($421,400) – the 25th consecutive month of year-over-year price increases.

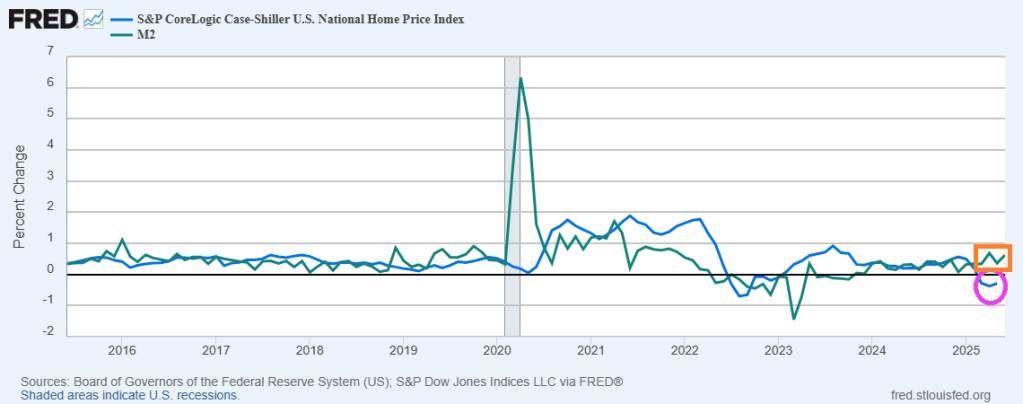
It will be hard to make housing more affordable as long as The Fed keeps printing money.

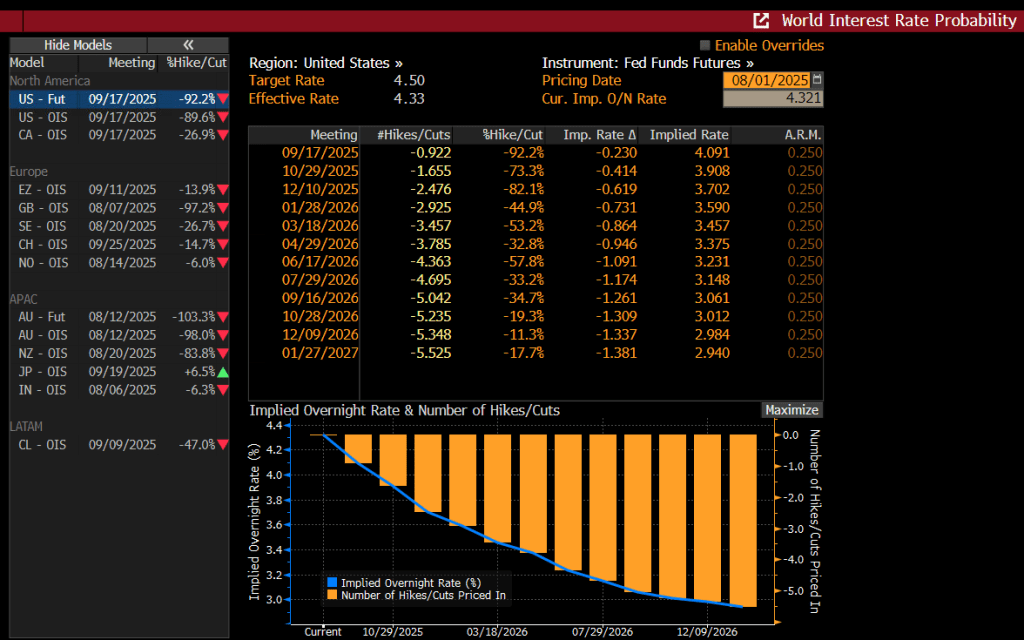
Powell et al cutting rates 25 basis points won’t really matter as long as they continue to print money. Unfortunately, M2 VELOCITY peaked under the Clinton Administration and has declined since despite frantic money printing.

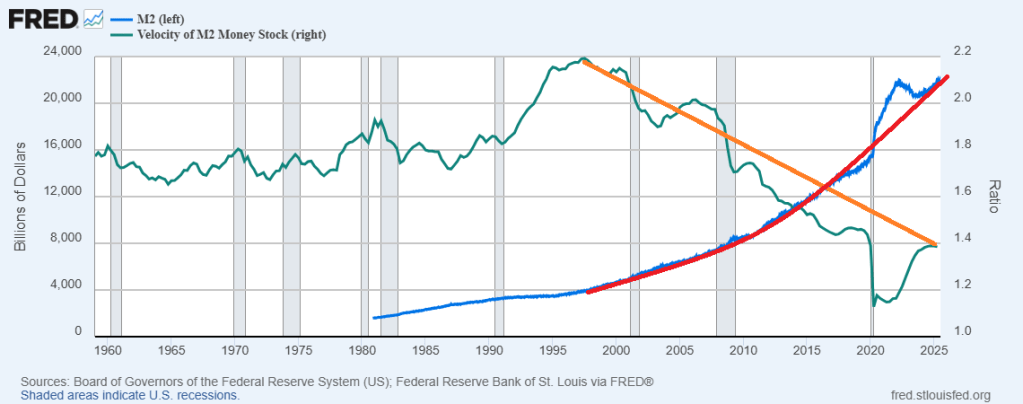
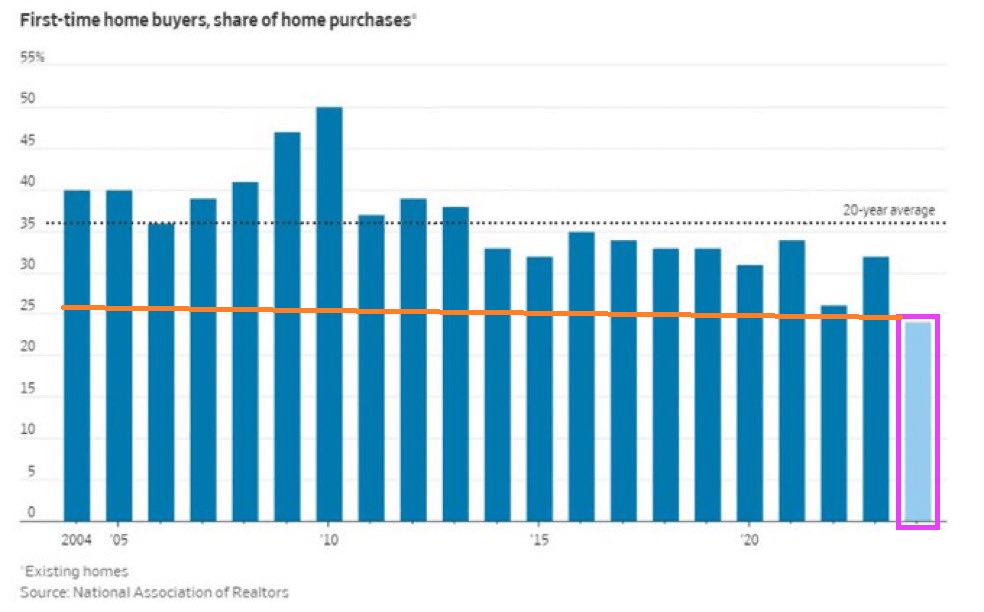
What happended in 1995? Clinton’s National Homeownership Strategy that mandated HUD partners (GNMA, FHA, Fannie Mae, Freddie Mac, banks, etc.) to lower credit standards to encourage homeownership.

We need FHFA Director Bill Pulte to avoid doing what Democrats love (everything free or cheap).

Keep On Printing? Home Price Growth Linked To Fed Money Printing (Cleveland OH Is Fastest Growing City In Terms of Home Prices Tampa FL Fastest Declining)

Is This My Free One-Way Bus Ticket To Cleveland? Cleveland is leading the nation in home price growth at 4.7% YoY. Followed closely by Hartford CT, Louisville KY, Detroit MI and Buffalo NY.

Well, if The Fed would stop printing money (M2), home prices would decline. But The Fed will keep on printing!

Of course, the top 1% of net worth households are doing quite well thanks to The Fed’s eternal money printing.

On the commercial RE side, US office vacancy rates are approaching 20%.

Lastly, Tampa FL is the slowest growing area. Actually declining at a rate of -6.2% YoY.

What The Fed Can’t Fix! Percentage Of 30-Year-Olds Both Married and Homeowners Lowest Since 1950 (Mortgage Rates Near Highest Since 2006)

The US housing market is finally slowing down in terms of price growth. But this is after 3 Federal government-fueled house price bubbles.

In addition to record-high housing prices, mortgage rates are higher than levels going back to 2006.

Throw in the “woke” movement, and we have a problem. The percentage of 30-year-olds who are both married and homeowners has plummeted to the lowest level since 1950.

Simply lowering interest rates won’t fix this problem. Much of the housing “crisis” is due to local and state level politicians and their restrictive housing policies. Like LA Mayor Karen “Venceremos Brigade” Bass allocating the burnt-down Pacific Palisades area on the Pacific Ocean to “affordable housing.”

July Jobs Report Factoids: Revisions Doomed BLS Commissioner McEntarfer, Native Born Workers Rose While Foreign Born Workers Declined, Federal Workers Declined For Sixth Straight Month

The July jobs reports for the US revealed some interesting factoids, such as the BLS Commissioner, Erika McEntarfer, being fired. Note that McEntarfer was BLS Commissioner since January 29, 2024. But under McEntarfer, downward revisions were the norm except for election season (Oct 2024 – Dec 2024) when there were upward revisions. But once Trump was elected and took office, all jobs report revisions were negative.

Native born workers rose while foreign born workers declined.

And for the 6th straight month, Federal jobs declined.

And with the poor jobs report that will surely be revised upwards.

The market is pricing in a rate cut at the 09/17/2025 FOMC meeting.

Trump in the underworld (Washington DC).

The US Housing Market Is In A Price Bubble (Again)

Yes, the US housing market is in a price bubble. If we compared home price growth with median earnings.

The financial crisis was spawned by a home price bubble where home price growth was faster than median earnings growth (see Bubble 1). After home price growth cooled in 2007-2009, the cycle started again (Bubble 2). But the current bubble (Bubble 3) is related to the Covid outbreak and massive spending binge by Congress (and The Fed). Notice that median earnings dropped (green line) post Covid.

But while we have normalized home price growth and median earnings, the LEVELS are still unaffordable for millions of households.

Poor Bill Pulte (FHFA Director). He has to work with an uncooperative Fed under Foul Powell, and local politivcians like Greasy Gavin Newsom (Democrat Gov of California), JB Pritzker (Democrat Gov on Illinois), Kathy Hocul (Democrat Gov of New York), and the assorted lunatic Mayors like Karen Bass (D, Mayor Los Angeles), Zohran Kwame Mamdani (D, presumptive Mayor New York City), etc.

Foul Powell! Mortgage Applications Decreased 3.8 Percent Week-over-week

Foul Powell on the prowl!

Mortgage applications decreased 3.8 percent from one week earlier, according to data from the Mortgage Bankers Association’s (MBA) Weekly Mortgage Applications Survey for the week ending July 25, 2025.

The Market Composite Index, a measure of mortgage loan application volume, decreased 3.8 percent on a seasonally adjusted basis from one week earlier. On an unadjusted basis, the Index decreased 4 percent compared with the previous week. The seasonally adjusted Purchase Index decreased 6 percent from one week earlier. The unadjusted Purchase Index decreased 6 percent compared with the previous week and was 17 percent higher than the same week one year ago.

The Refinance Index decreased 1 percent from the previous week and was 30 percent higher than the same week one year ago.

Between Powell keeping rates high and Biden’s grossly incompetent management, the mortgage market remains in the doldrums.

Final Q2 Real GDP Climbs To 2.9% Despite Dire Democrat Forecasts

The US Real GDP report is out tomorrow. Here is an advanced estimate of Q2 US Real GDP, courtesy of The Atlanta Fed. It is forecast to be 2.9%. Despite dire forecasts by Democrats and the media.

Latest estimate: 2.9 percent — July 29, 2025

The final GDPNow model estimate for real GDP growth (seasonally adjusted annual rate) in the second quarter of 2025 is 2.9 percent on July 29, up from 2.4 percent on July 25. After this morning’s Advance Economic Indicators report from the US Census Bureau, a decline in the nowcast of real gross private domestic investment growth from -11.7 percent to -12.7 percent was more than offset by an increase in the nowcast of the contribution of net exports to real GDP growth from 3.31 percentage points to 4.04 percentage points.

My knucklehead Congressional Rep Joyce Beatty (Democrat) says that Trump is lying about the economic data, but was silent about Biden’s inflated jobs numbers. So Ms Beatty, is the Atlanta Fed lying too??

Case-Shiller National Home Price Index Falls For 3rd Straight Month In May -0.3% MoM (Despite Fed Money Printing) 

US home prices fell for the 3rd straight month In May. The MoM decrease in the seasonally adjusted (SA) Case-Shiller National Index was at -0.29% (-3.5% annual rate).

Despite continued money printing by The Fed.

China, Fauci And Home Prices? Mortgage Demand Plummeted With Covid As Federal Spending Soared (New Home Sales Declined 6.6% YoY In June)

China unleashed the Wuhan virus on the globe, Anthony Fauci convinced Congress to binge spend like drunken sailors on Covid prevention and relief. Homes prices soared, mortgage demand sank and nothing has been the same.

Here is a chart of the Case-Shiller national home price index post Covid outbreak and the hysterical overreaction by Congress and the Administration (including Anthony Fauci).

Another example? New home sales are down 6.6% YoY.

Who do we blame? China? Yes. Anthony Fauci? Yes. Congress? Yes.