Hallelujah, I love this economy so! Of course, former First Lady Jill Biden is on the national tour trashing the economy saying it was “perfect” under Joe Biden.
Mortgage applications increased 4.8 percent from one week earlier, according to data from the Mortgage Bankers Association’s (MBA) Weekly Mortgage Applications Survey for the week ending December 5, 2025. Last week’s results included an adjustment for the Thanksgiving holiday.
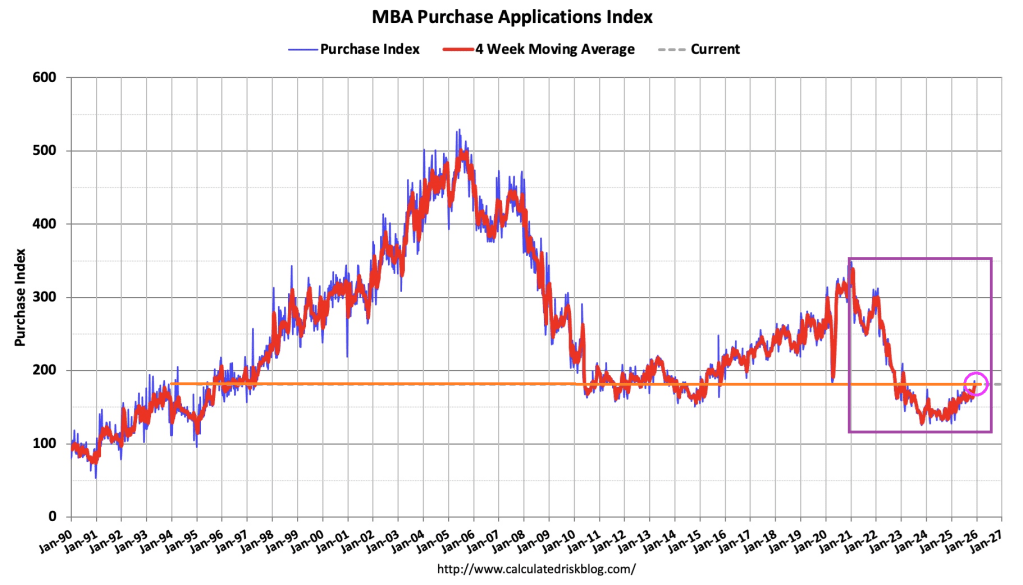
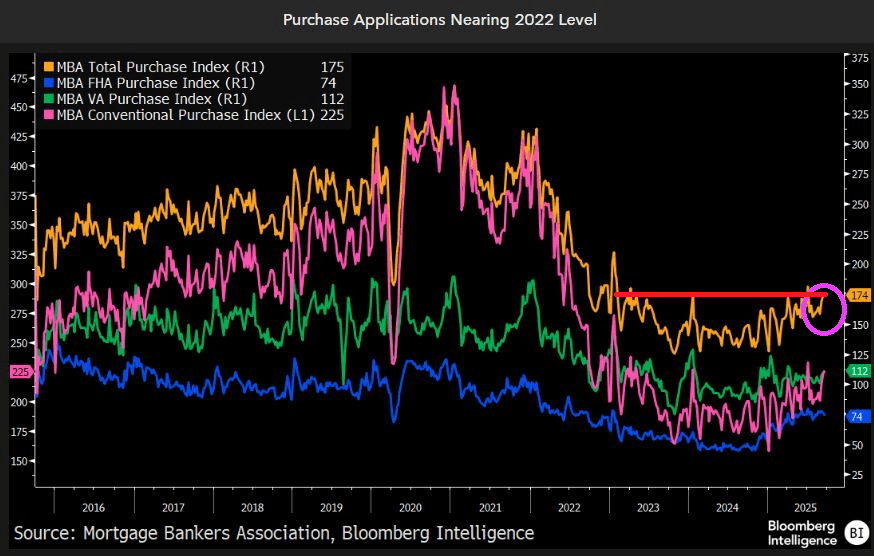
The Market Composite Index, a measure of mortgage loan application volume, increased 4.8 percent on a seasonally adjusted basis from one week earlier. On an unadjusted basis, the Index increased 49 percent compared with the previous week. The seasonally adjusted Purchase Index decreased 2 percent from one week earlier. The unadjusted Purchase Index increased 32 percent compared with the previous week and was 19 percent higher than the same week one year ago.
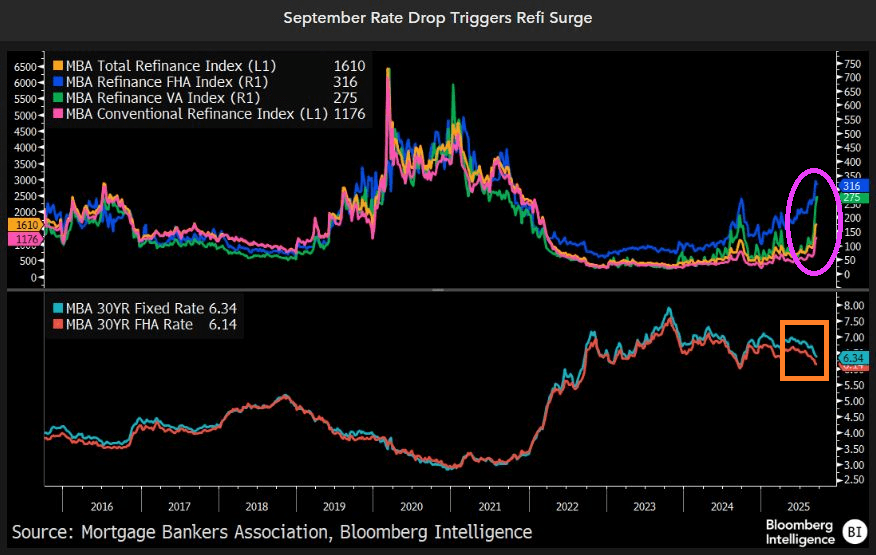
The Refinance Index increased 14 percent from the previous week and was 88 percent higher than the same week one year ago.
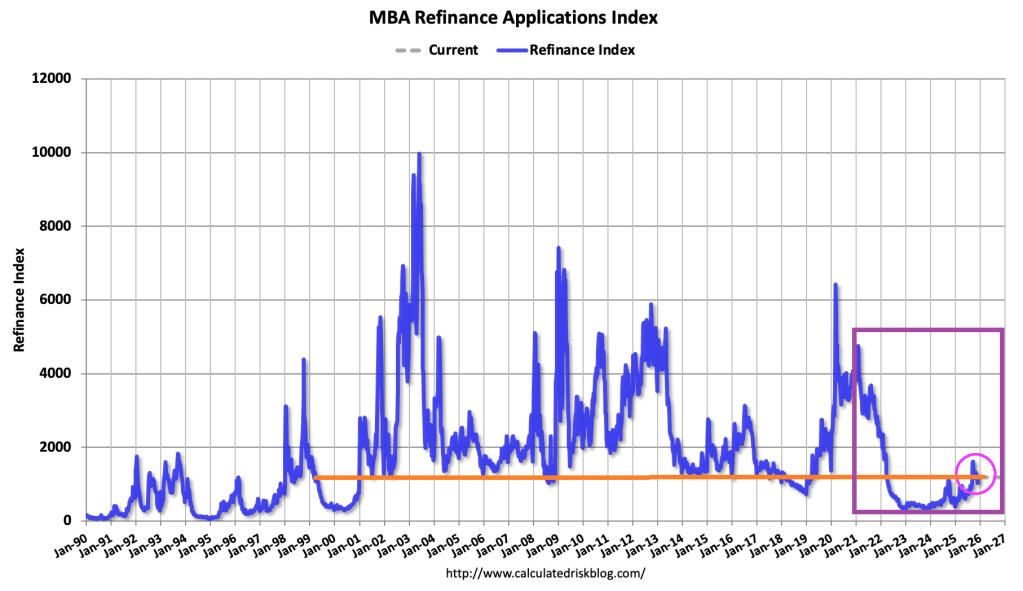
Compared to the prior week’s data, which included an adjustment for the Thanksgiving holiday, mortgage application activity increased last week, driven by an uptick in refinance applications,” said Joel Kan, MBA’s Vice President and Deputy Chief Economist. “Conventional refinance applications were up almost 8 percent and government refinances were up 24 percent as the FHA rate dipped to its lowest level since September 2024. Conventional purchase applications were down for the week, but there was a 5 percent increase in FHA purchase applications as prospective homebuyers continue to seek lower downpayment loans. Overall purchase applications continued to run ahead of 2024’s pace as broader housing inventory and affordability conditions improve gradually.
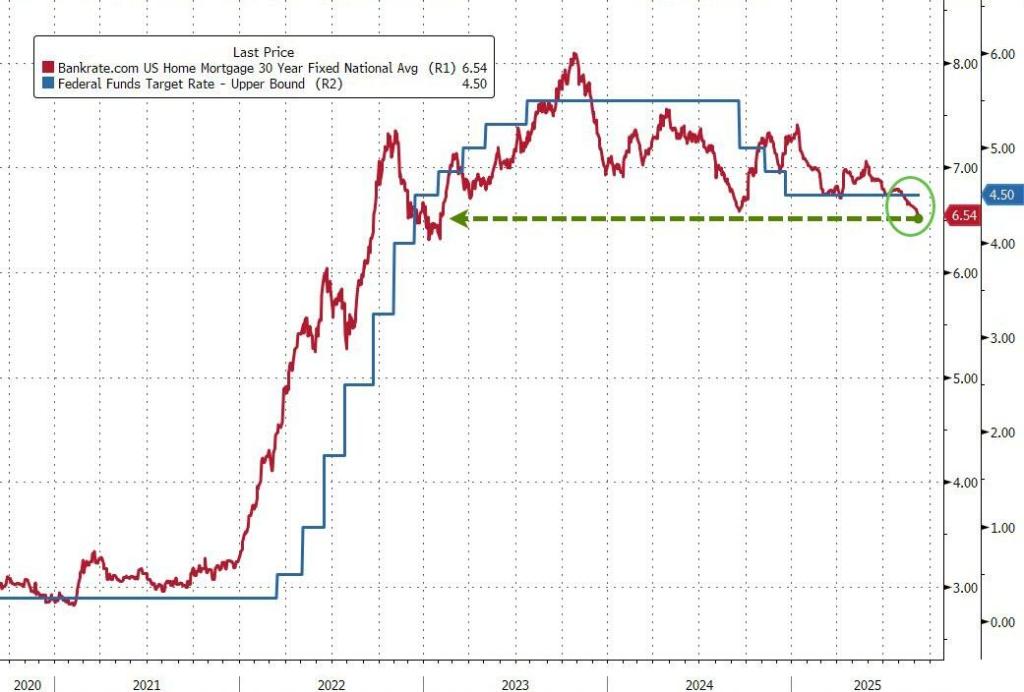
The average contract interest rate for 30-year fixed-rate mortgages with conforming loan balances ($806,500 or less) increased to 6.33 percent from 6.32 percent, with points increasing to 0.60 from 0.58 (including the origination fee) for 80 percent loan-to-value ratio (LTV) loans.


You must be logged in to post a comment.