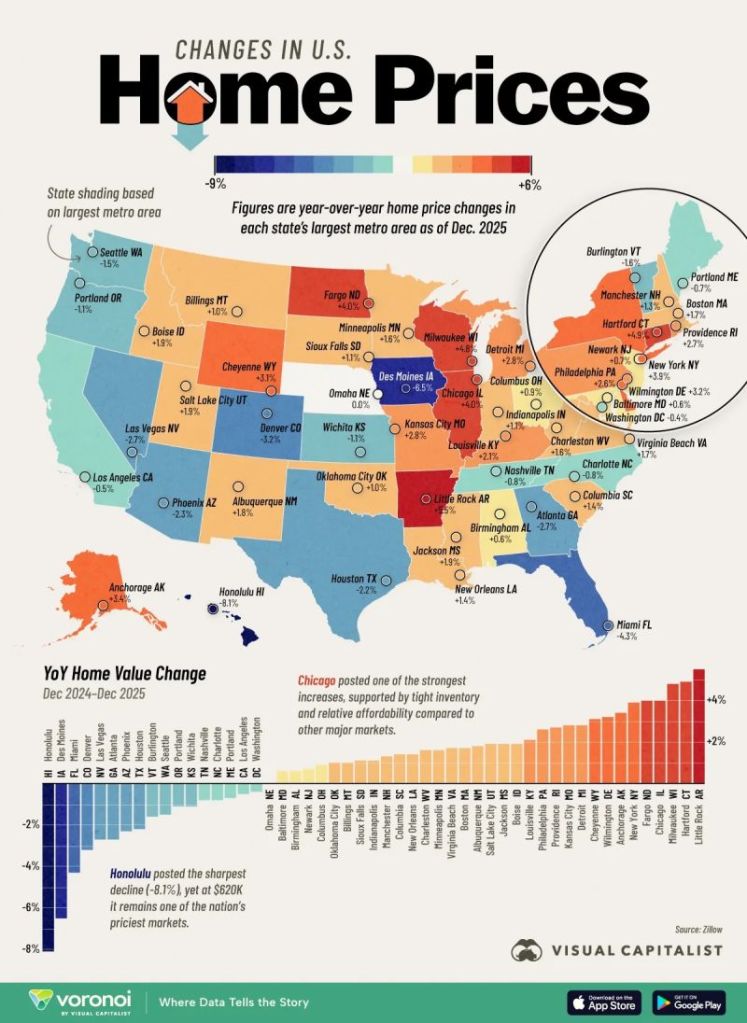
We are seeing mean reversion in home prices in red cities and blue cities.
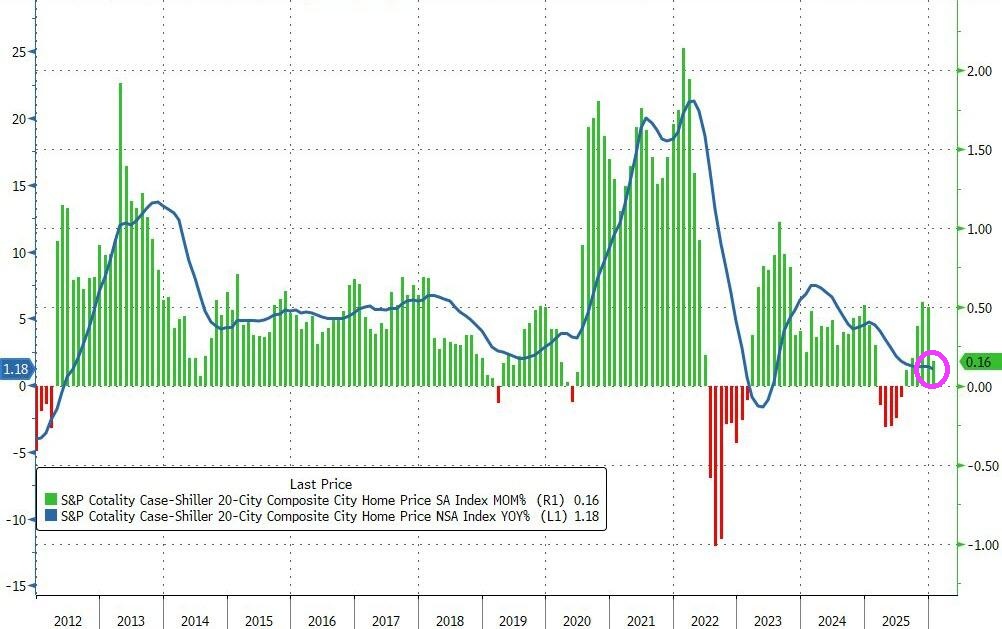
The price of homes in America’s to 20 cities rose just 0.16% MoM in January (the lowest MoM rise since August and well below the 0.35% MoM expected.
Source: Bloomberg
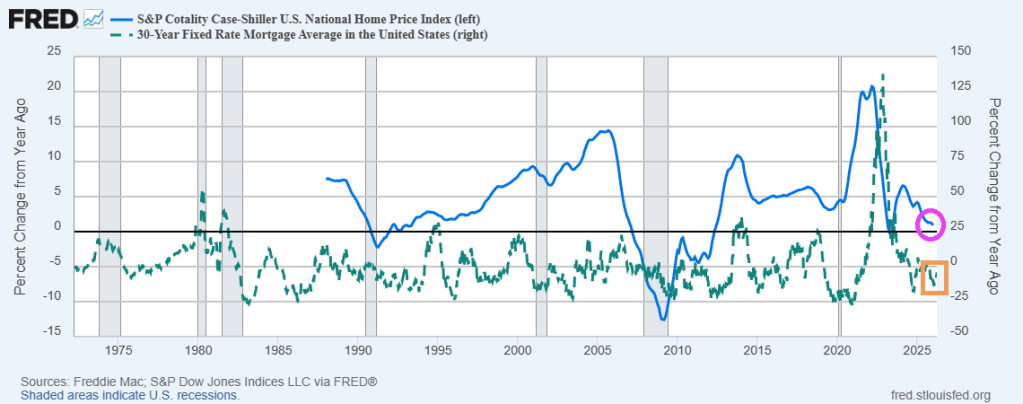
Home prices rose 0.9% YoY as mortgage rates have fallen. Home prices are still too high.
New York leads with a 4.9% annual gain, followed by Chicago at 4.6% and Cleveland at 3.6%, while Tampa fell 2.5%…
Don’t be confused. This isn’t leftists running to blue cities. It is mean reversion. The prior fleeing blue cities to red cities created a mean reversion effect where red cities home prices rose too fast and blue cities fell too fast.
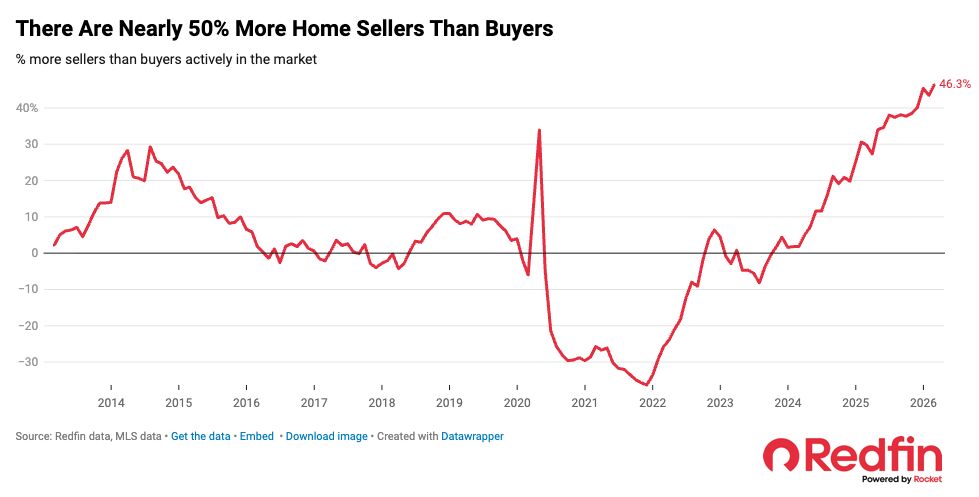
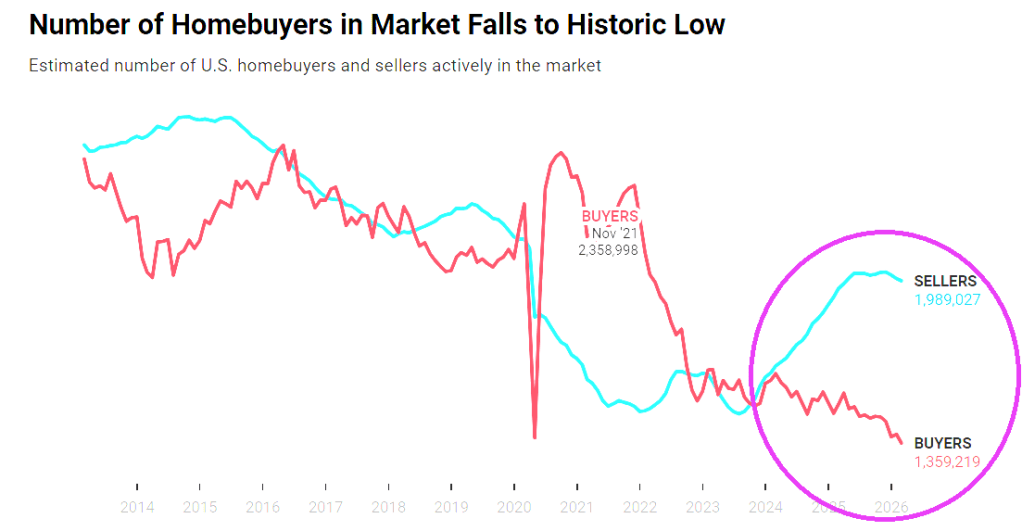
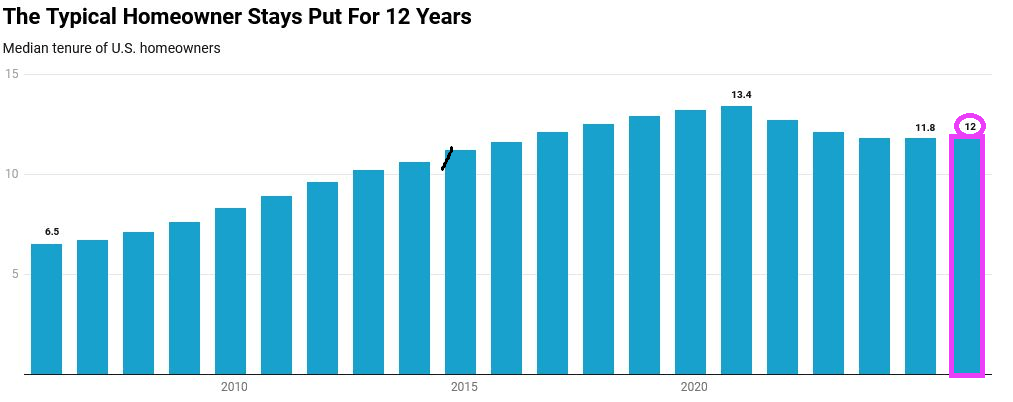
Nothing has been the same in the US housing market since the Covid outbreak of 2020. According to Redfin, there are nearly 50% more home sellers than buyers.
And the number of homebuyers has fallen to historic lows.
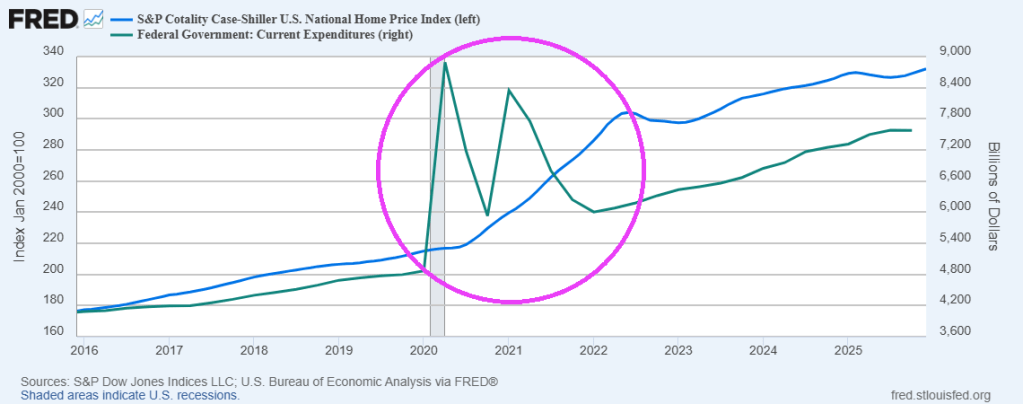
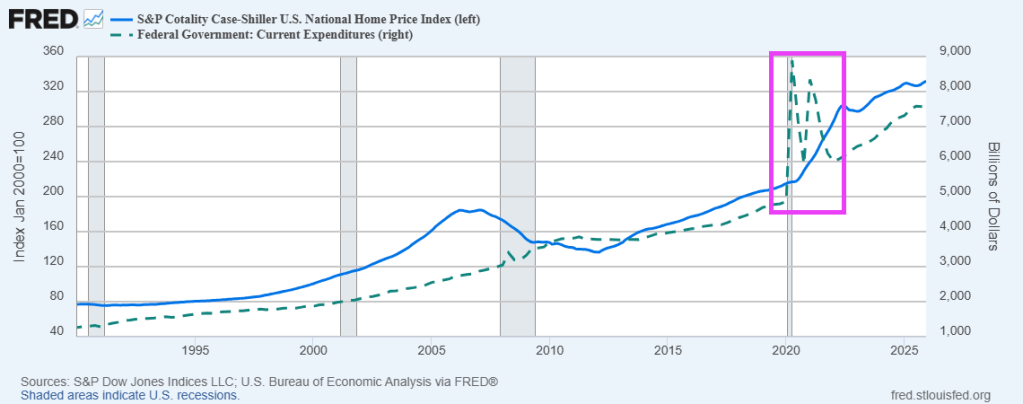
A good reason there are so few buyers is that home prices has soared after the Federal government’s spending spree after Covid.
Prayers for the soul of Noelia Castillo Ramos, murdered by the Spanish government. For being gangrape TWICE by immigrants then attempted suicide.
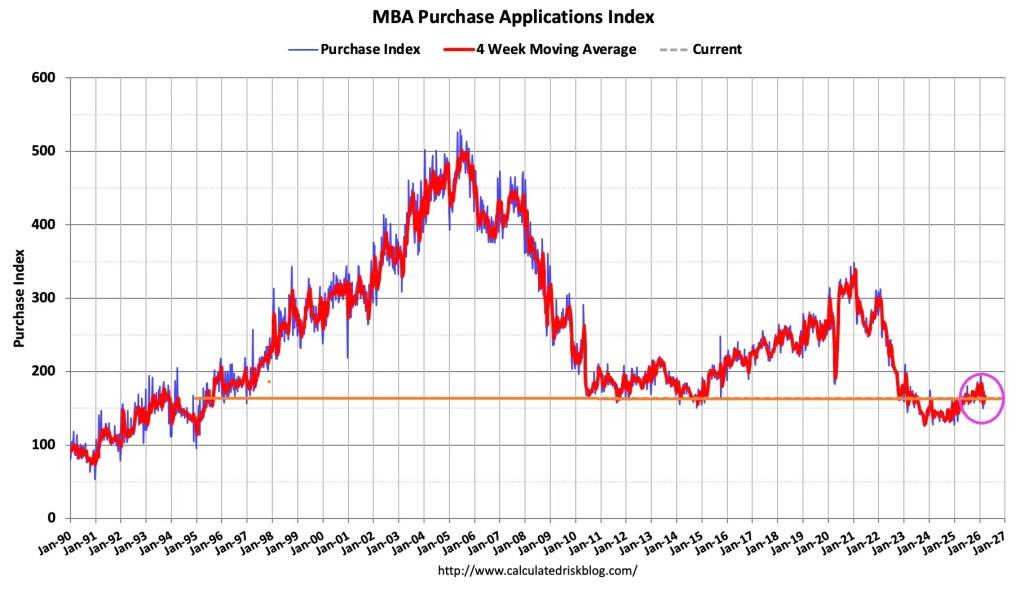
Mortgage applications decreased 10.5 percent from one week earlier, according to data from the Mortgage Bankers Association’s (MBA) Weekly Mortgage Applications Survey for the week ending March 20, 2026.
The Market Composite Index, a measure of mortgage loan application volume, decreased 10.5 percent on a seasonally adjusted basis from one week earlier. On an unadjusted basis, the Index decreased 10 percent compared with the previous week. The seasonally adjusted Purchase Index decreased 5 percent from one week earlier. The unadjusted Purchase Index decreased 5 percent compared with the previous week and was 5 percent higher than the same week one year ago.
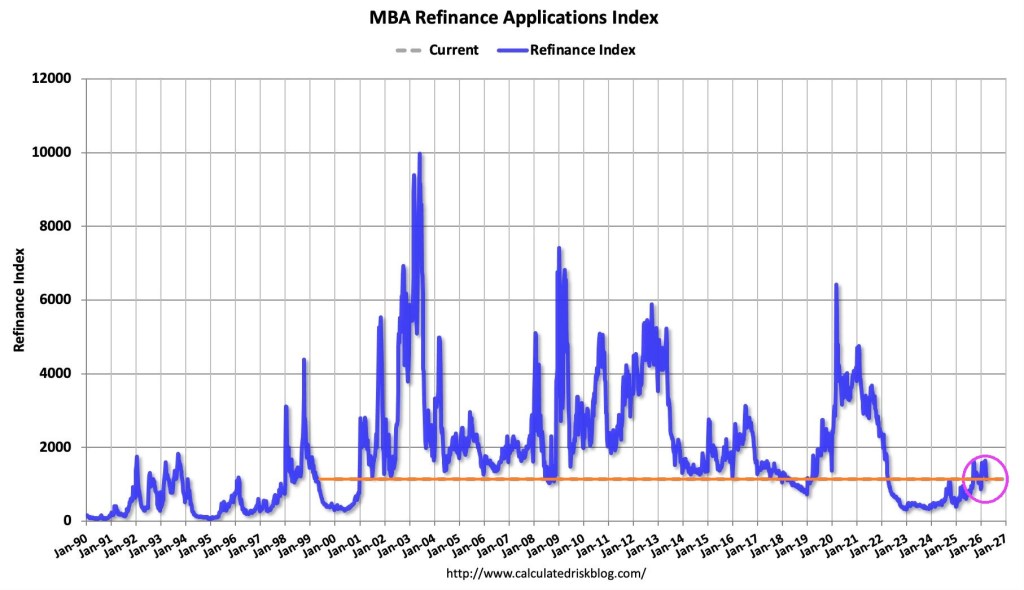
The Refinance Index decreased 15 percent from the previous week and was 52 percent higher than the same week one year ago.
Nothing has been the same since Covid outbreak in 2020 and the resulting Federal government spemding spree.
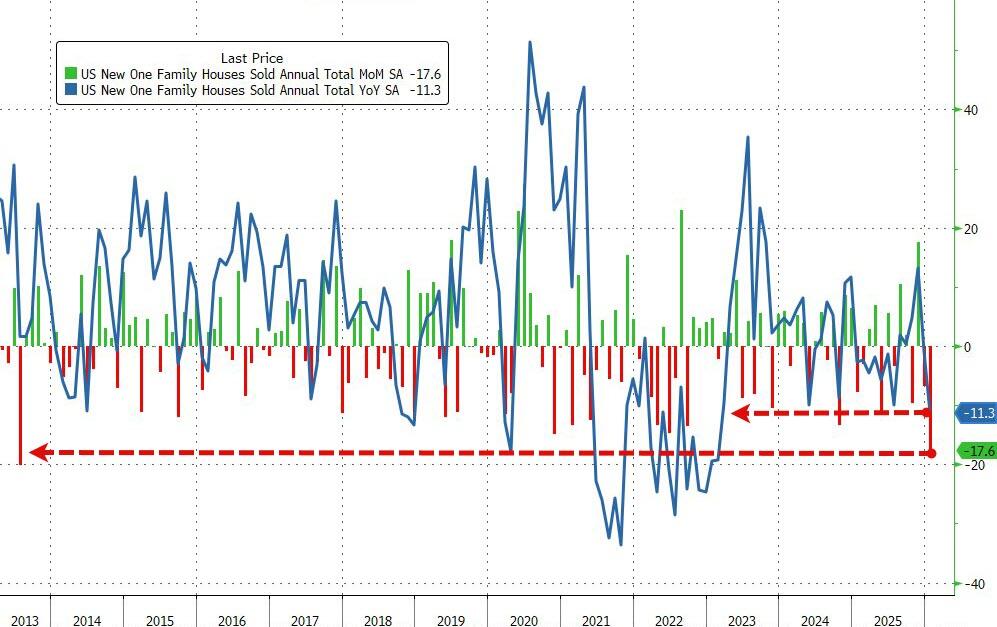
Despite falling mortgage rates, analysts expected December’s drop in new home sales to accelerate in January… and accelerate they did… crashing a stunning 17.6% MoM (-2.7% MoM exp) – the biggest MoM drop since July 2013.
This huge MoM drop dragged sales down 11.3% YoY – the worst slide in three years.
Source: Bloomberg
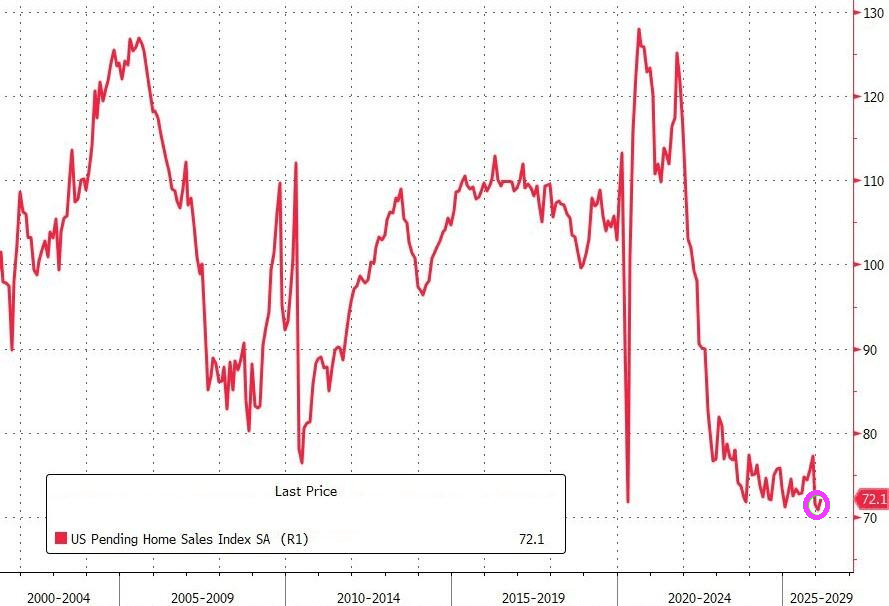
This huge drop dragged the new home sales SAAR down to its lowest since 2022, catching down to existing and pending sales…
Inventories are up (Houses for sale in Jan. rose 0.4% m/m to 476,000), prices are down (Median down 6.8% YoY at $400k – lowest since 2024)…
…and remember these deals were signed in January – meaning this is not mortgage related (some suggesting weather impact – Northeast sales down 44.7% MoM, MidWest -33.9% MoM, but the scale is immense).
Moral of the story: US home prices are too high for millions of households to afford.
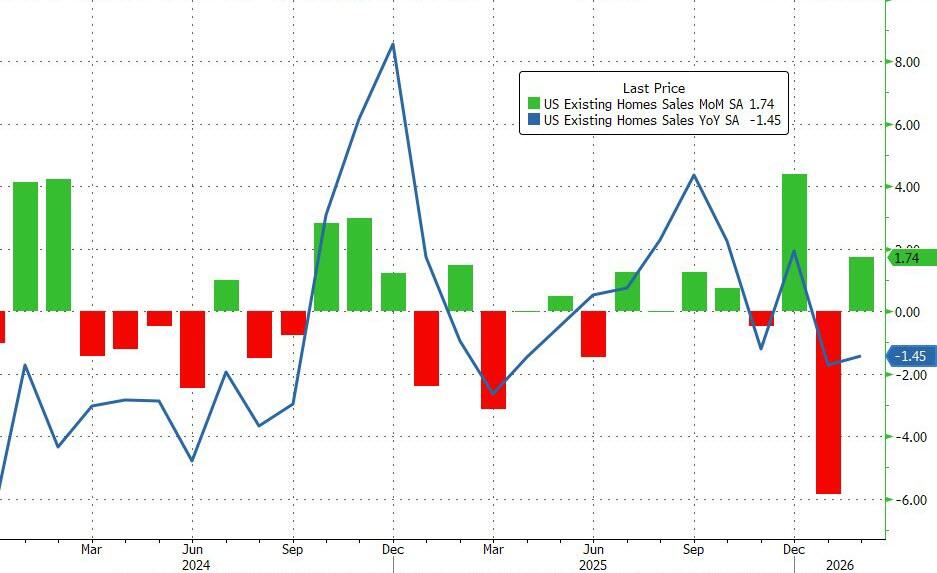
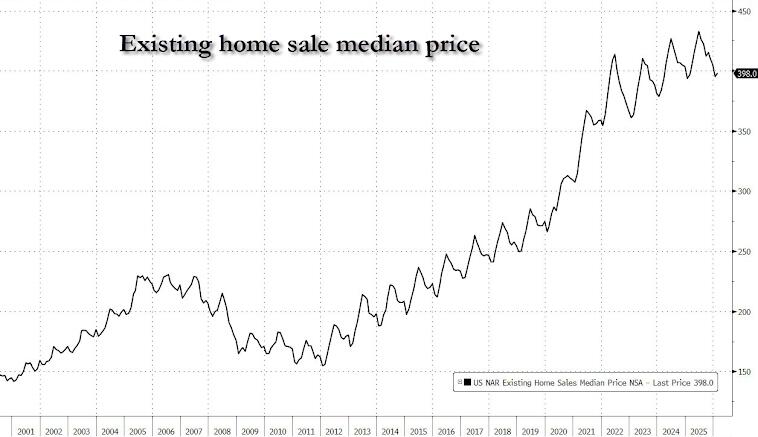
Existing homesales actually surprised to the upside, rising 1.7% MoM in February. Perhaps even more notably, January’s 8.4% MoM plunge was revised up to a slightly less crazy 5.9% MoM drop.
With the beat and upward revision, existing home sales were down just 1.45% YoY but SAAR topped 4mm (4.09mm) once again.
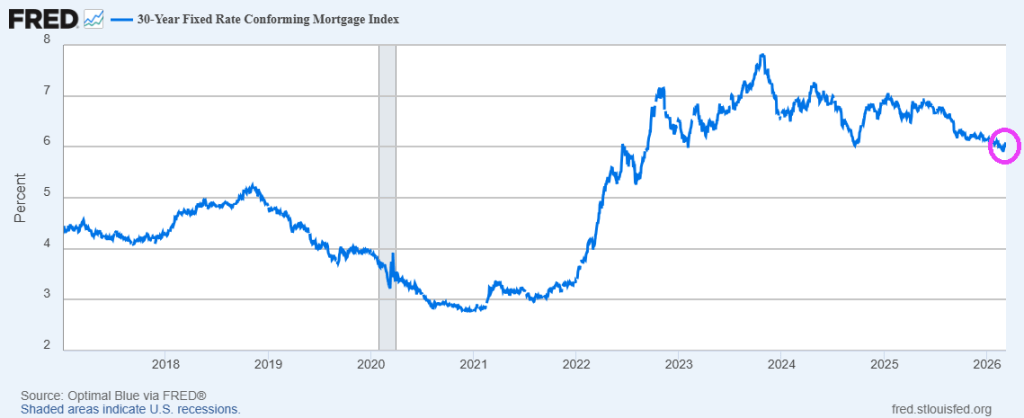
On the bright side, with mortgage rates at their lowest since 2022, existing home sales look set to continue to improve (unless Trump’s war triggers more panic in rates).
The NAR report showed the median selling price rose 0.3% from a year earlier — one of the smallest advances since the pandemic housing frenzy — to $398,000 last month.
The inventory of previously owned homes increased 4.9% from a year ago to 1.29 million — the most for any February since 2020.
Mortgage rates? Up yesterday, but near lowest since 2023.
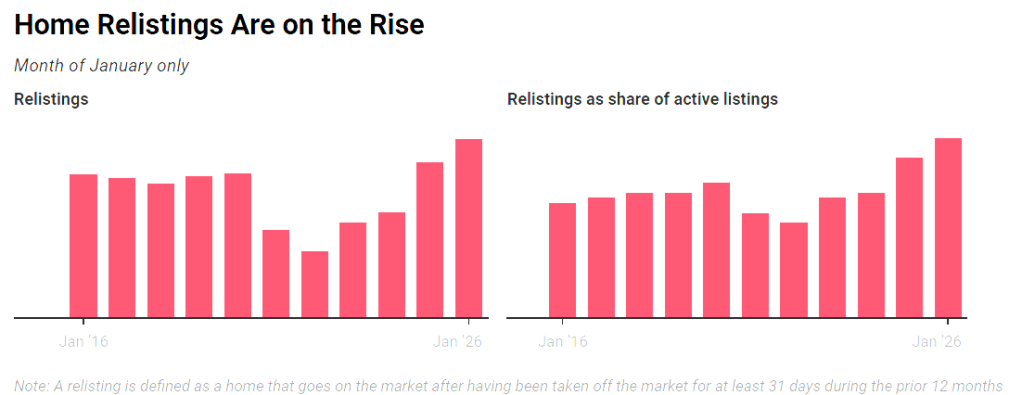
Delistings soared in 2025 after sellers began to outnumber buyers, and decided to take their homes off the market to take another bite at the apple this spring. Overall delistings hit a record high of 112,788 in December, while relistings this year represented 3.6% of all homes on the market.
Supply gains have been concentrated in the South and West, particularly among homes priced under $500,000. While the Northeast and Midwest have seen some growth, they are still lagging behind the other regions.
As of February, active listings climbed by 7.9 percent year over year, reaching 914,860 homes across the nation for sale. A little more than 7 percent of those listings resulted in contract cancellations—down slightly from the same time in 2025.
An analysis of the country’s 50 largest markets showed sharp increases in inventory in Seattle, with a 38.5 percent hike, as well as Louisville, Kentucky, 27.3 percent higher, and San Jose, with nearly 25 percent more homes on the market.
On the other side, Hartford, Connecticut, experienced the deepest drop in inventory at over 82 percent, as well as Providence, Rhode Island, at 61.1 percent.
Overall, homes spent a median of 70 days on the market in February, four days longer than a year earlier.
We are seeing the aftermath of the Federal government’s fiscal response to the Covid outbreak of 2020. Home prices exploded following The Federal government’s spending spree. The end result? US housing is simply unaffordable for millions of households.
Not really surprising given the soaring home prices following the Covid Federal spending spree.


You must be logged in to post a comment.