Housing thunder? Or housing lightning!
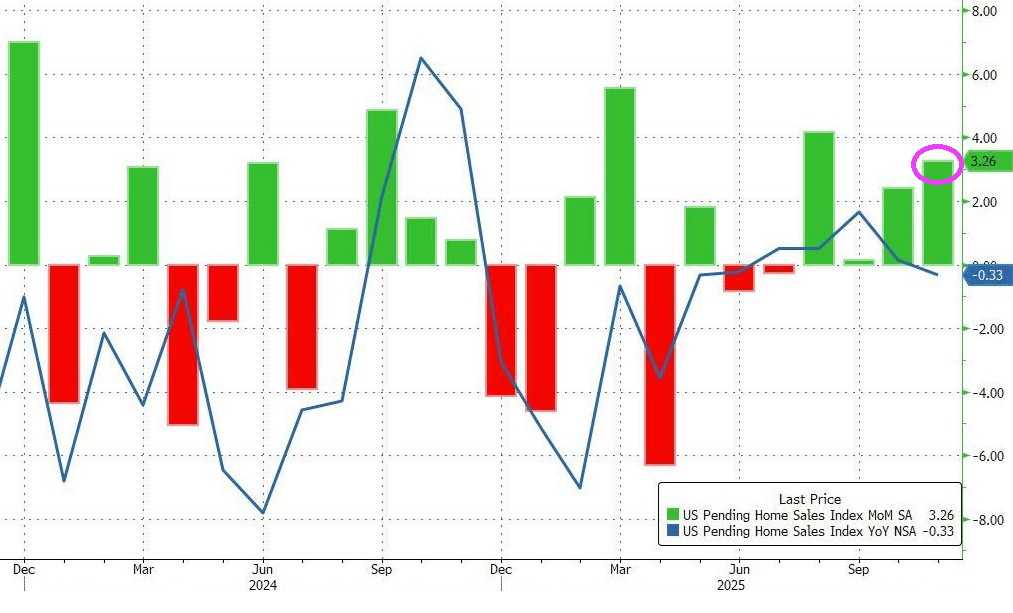
Pending sales of existing homes in the US surged 3.3% MoM (more than the expected 0.9% MoM move) in November as a modest improvement in prices and mortgage rates encouraged buyers.
The gain was broad-based across regions and exceeded all but one estimate in a Bloomberg survey of economists, but left the YoY change in sales somewhat stagnant on an NSA basis.
Signings have now increased for four straight months, matching a streak seen during the frenzied housing market of the pandemic.
The trade association’s report on Monday showed contract signings rose in each US region last month to their highest levels of the year. The West posted the largest increase, followed by the South, the nation’s largest home-selling region.
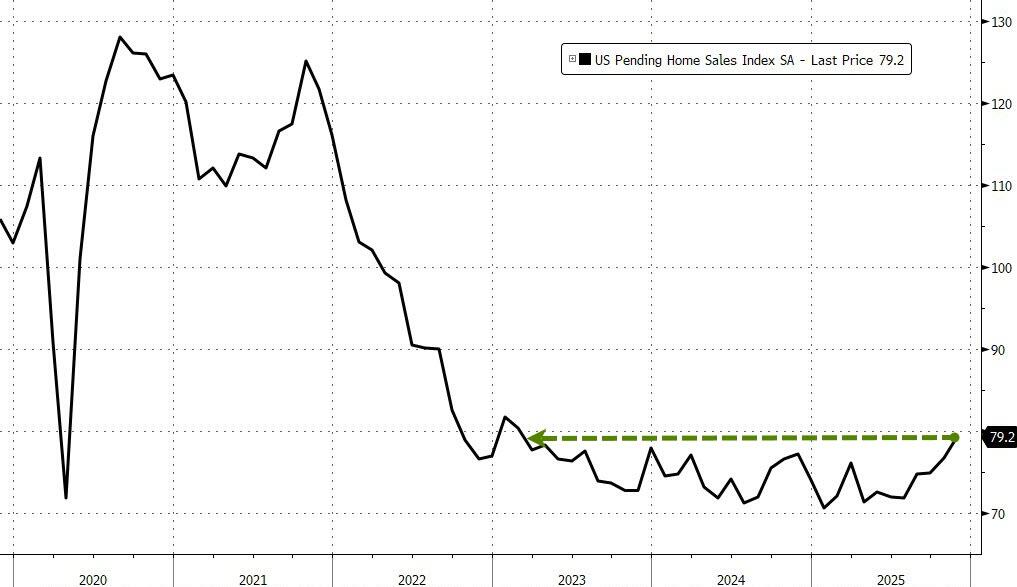
November’s surge dragged the Pending Home Sales Index to its highest since Feb 2023…
Bloomberg reports that the recent data point to the gradual improvement many economists see for the housing market into 2026.
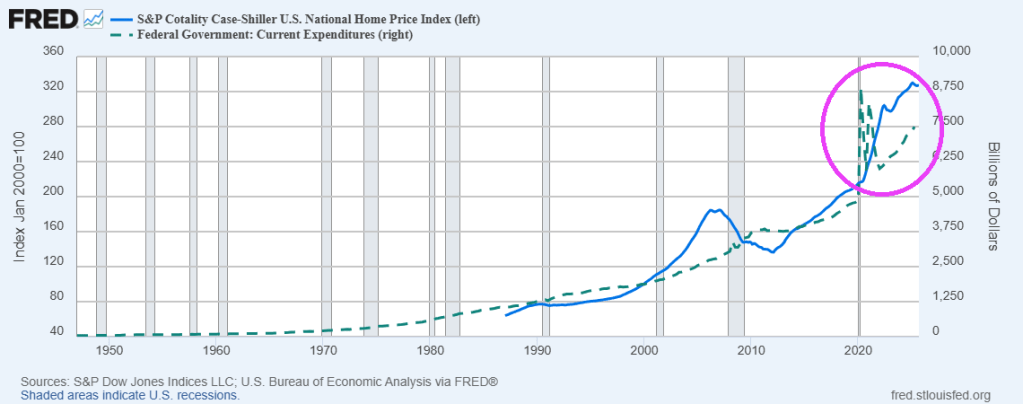
Mortgage rates that were close to 7% in May have since settled in the 6.3% to 6.4% range, and home prices are growing at a much slower rate compared to last year.
That’s helped fuel small gains in contract closings in recent months. However, economists and industry experts have widely different expectations for next year.
In a recent survey of nine market analysts, estimates for the home resale market ranged from 1.7% to 14% sales growth, with the rosiest projection coming from NAR’s Yun.
Pending-homes sales tend to be a leading indicator for previously owned homes, as houses typically go under contract a month or two before they’re sold.


You must be logged in to post a comment.