Biden is out and so are the crazy job preferences of his administration (e.g., green energy). There is a new sheriff in town (Donald Trump).
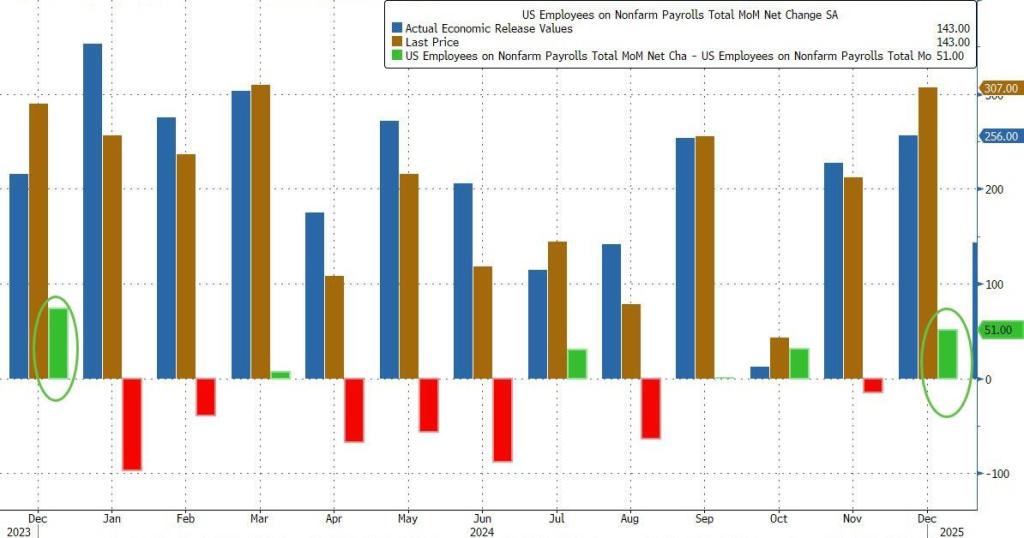
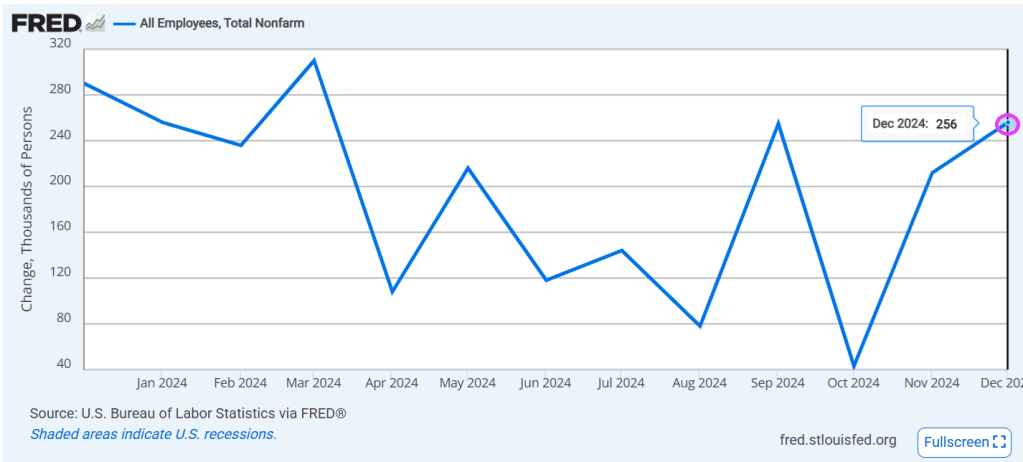
Here’s what the BLS reported in Trump’s first official jobs report since he returned to the White House: total payrolls printed at 143K.
down sharply from an upward revised 307K (256K originally) and missing estimates of 175K.
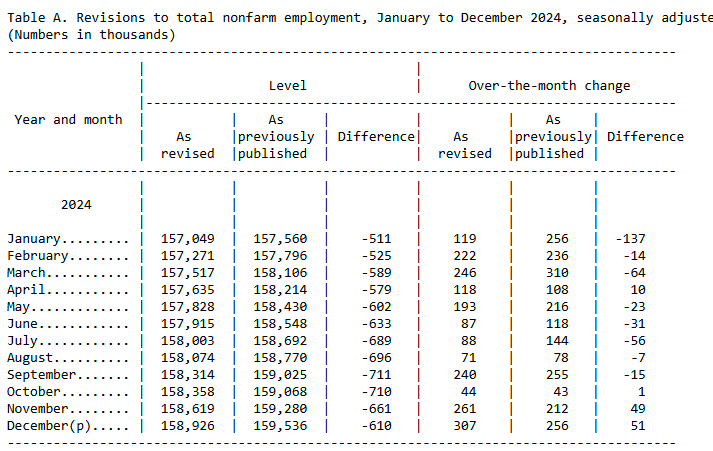
Looking further back, the change in total nonfarm payroll employment for November was revised up by 49,000, from +212,000 to +261,000, and when adding the +51,000 revision to December employment in November and December combined is 100,000 higher than previously reported
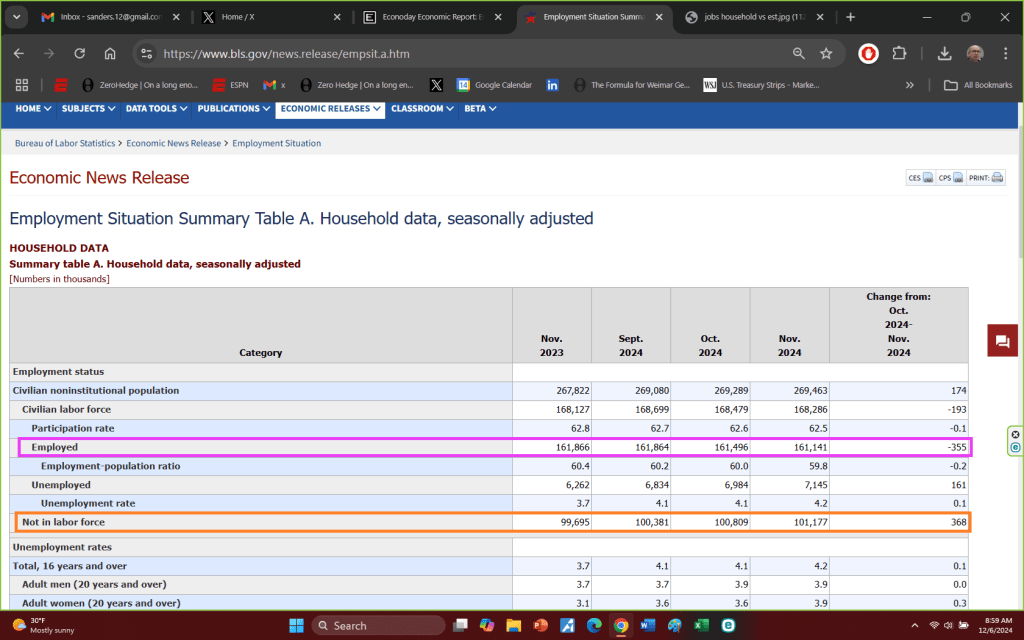
But while the sequential change in the Establishment survey was notable, what was far more remarkable was the Household survey where we saw massive population related revisions (discussed last night), which pushed the civilian labor force higher by 2.2 million to 170.744 million, while the number of employed workers also increased by over 2.2 million to 163.895 million. As a result, the Household survey has finally caught up to Establishment survey.
I can’t wait for Billions Biden, The DC parasite who selectively shoves billions of dollars to his friends and nothing for the others. For example, bailing out the LA wildfires but stiffing the people of North Carolina and Florida for hurricane/flood damage. And funding Ukraine while real wage growth is negative. And heavy investment in green energy, the ultimate fool’s errand.
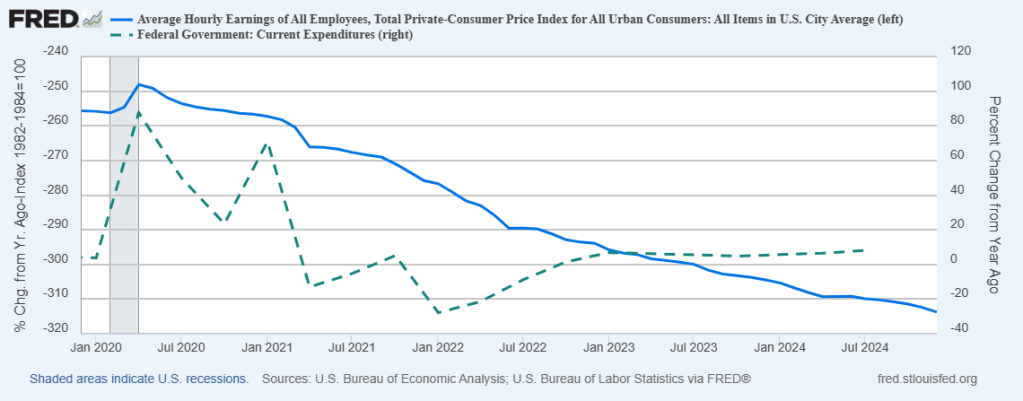
Let’s start with declining real wage growth under Biden/Harris (blue line). Meanwhile, Federal government spending (dashed green line) continues to grow causing inflation.
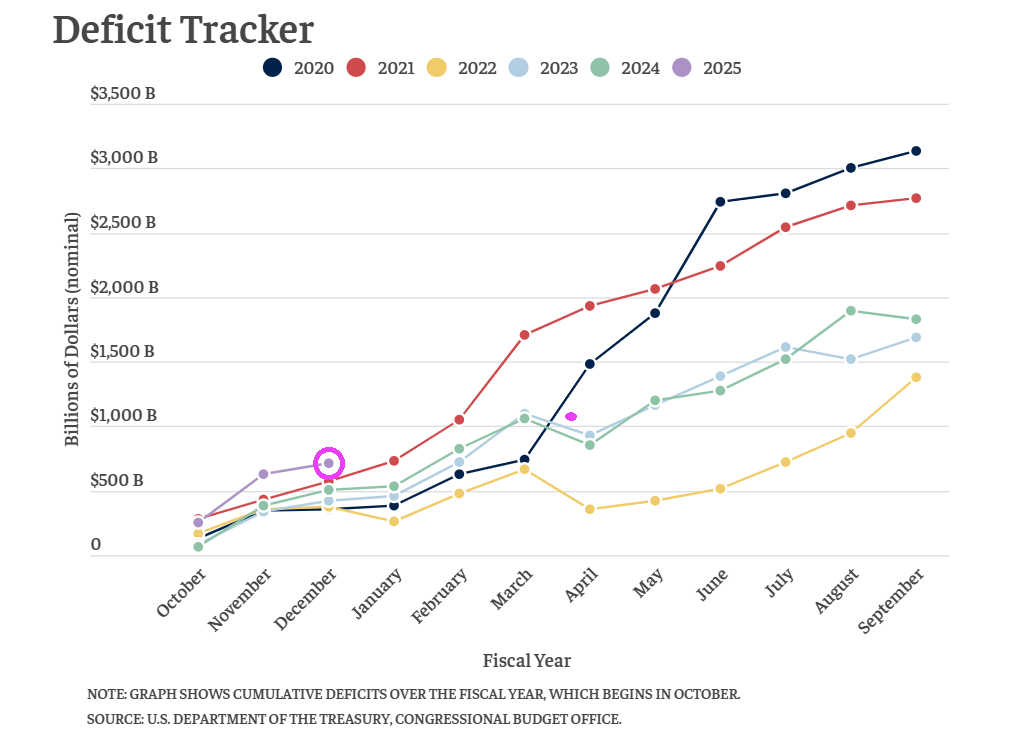
Meanwhile, Biden/Harris and Congress left Trump with the largest budget deficit in history. Like endlessly funding Ukraine and illegal immigration.
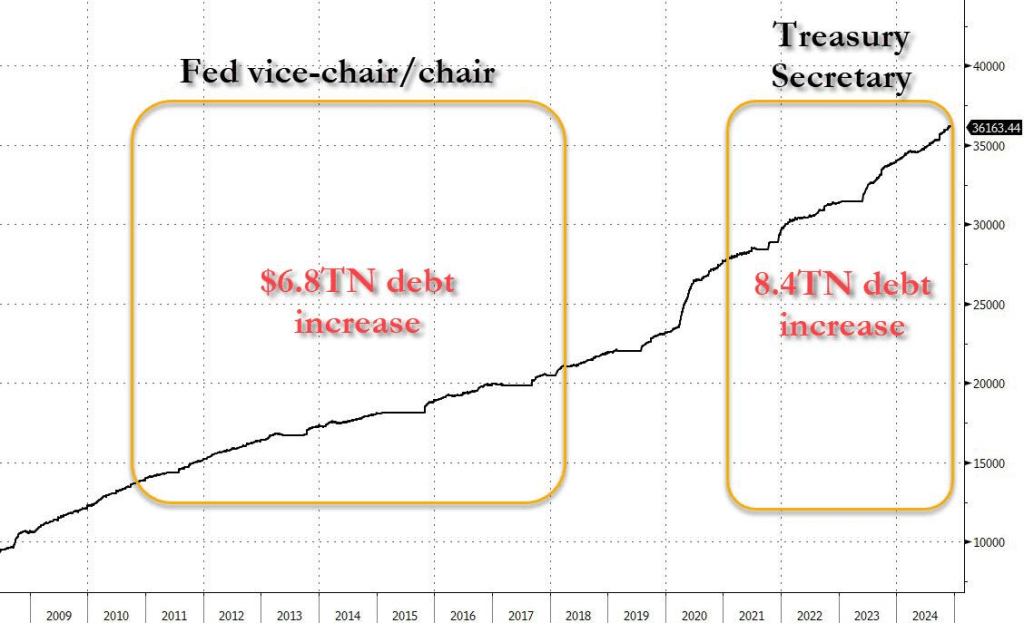
Leaving American taxpayers with growing Federal debt of $36+ trillion. And unfunded liabilities of $226 trillion, over 6 times the national debt.
The US will hit its debt ceiling the day after President Trump is inaugurated, and Yellen said that the Treasury will launch “extraordinary measures” to stave off the threat of a national default. Bear in mind, Janet Yellen personally oversaw total debt increase by a staggering $15 trillion. Way to go, Janet!
I wonder how Trump’s Treasury secretary will handle this? At least better than Janet Yellen, I hope!
The latest jobs report was like the Cornell Hurd song, “It’s just the whiskey talking.” Except that this time it’s just the Biden Administration talking … and their jobs reports have been corrected/revised repeatedly.
The latest jobs report saw Nonfarm Payrolls rise by 256k and mortgage rates (conforming) rose above 7%. But what happens when the recent jobs report is revised downwards?
It is a brave new world as the US attempts an Argentina-like shift from an over-regulated, corrupt economy to a more free economy. While Argentina has Javier Milei, the US is stuck with greedy Democrats and RINOs and their bloated spending sinking any attempt to cut wasteful spending.
So as we transition from woefully corrupt and demented Joe Biden to Donald Trump, the labor market is … terrible. The job finding rate of unemployed workers has collapsed.
This occurred as the Philly Fed Business Outlook plummeted.
Here is Javier Milei of Argentina and The View’s image of a libertarian leader, Javier Bardem from No Country For Old Men.
Like a Great White Shark, Bitcoin has breached $100k!
Gold, a competitor to the US Dollar, is down a bit today, but has been rising with the prospect of Trump deregulating the hamstrung US economy. Gold rose under Biden/Harris (and McConnel/Schumer’s) gross fiscal mismanagemment.
Here is a picture of Bitcoin breaching the surface. And why it pays not to surf near seals or sea lions.
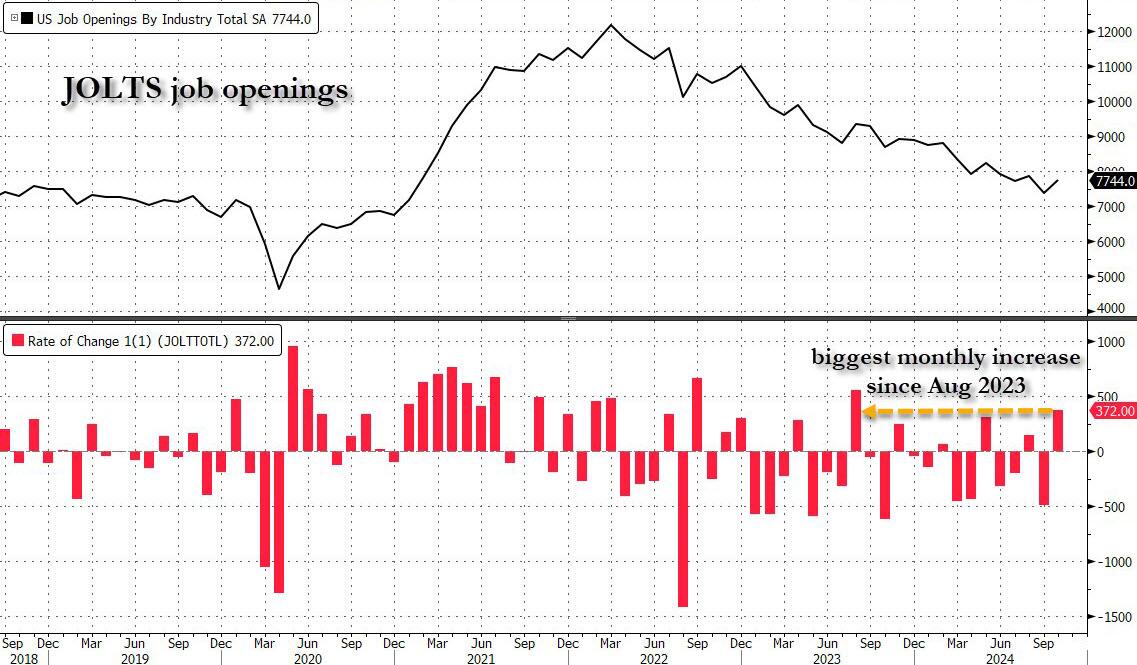
After last month’s catastrophic JOLTS report, which was a disaster across the board, and which was meant to give the Fed a green light to cut rates more after Biden won the election (which he didn’t, but the Fed still had to cut even if Trump is now in control), some speculated that Biden’s Department of Labor will do everything in its power to sabotage further rate cuts by the Fed, most notably the upcoming December decision in two weeks time, by pushing out much stronger than expected economic data. That’s precisely what happened moments ago when the DOL reported that in October, the number of job openings in the US soared by a whopping 372K, the biggest monthly increase since August 2023, to 7.744 million from 7.372 million.
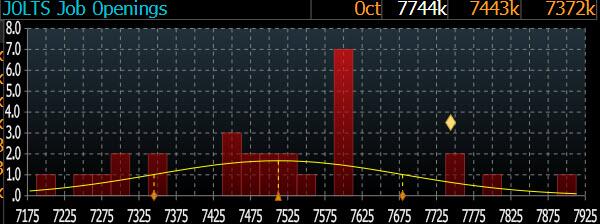
The JOLTS print smashed the median estimate of 7.519 million by 225K…
… with just 4 analysts (out of 28) predicting a higher job openings number.
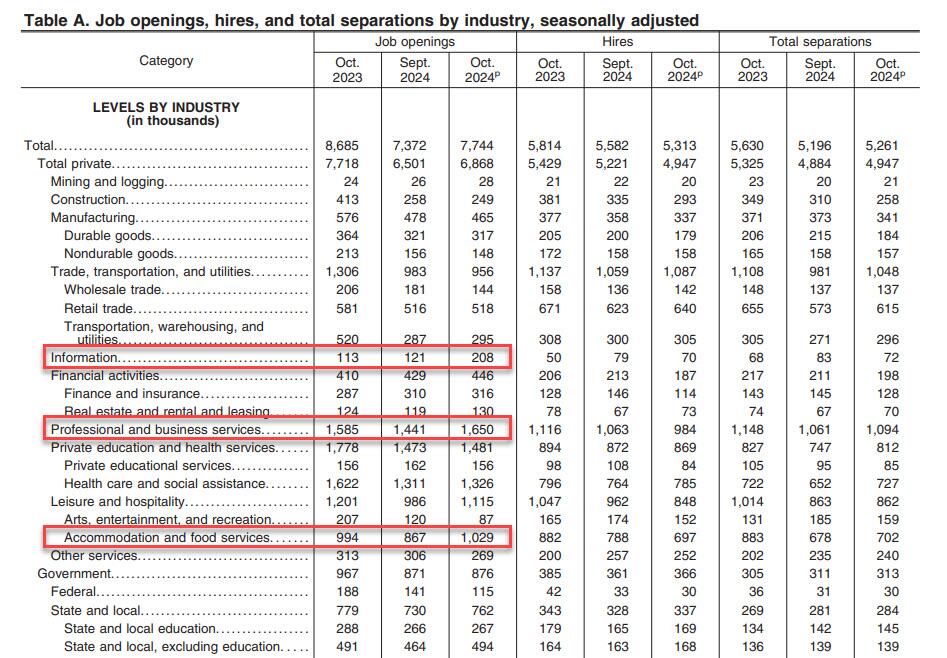
According to the DOL, the job openings rate, at 4.6 percent, changed little over the month. The number of job openings increased in professional and business services (+209,000), accommodation and food services (+162,000), and information (+87,000) but decreased in federal government (-26,000).
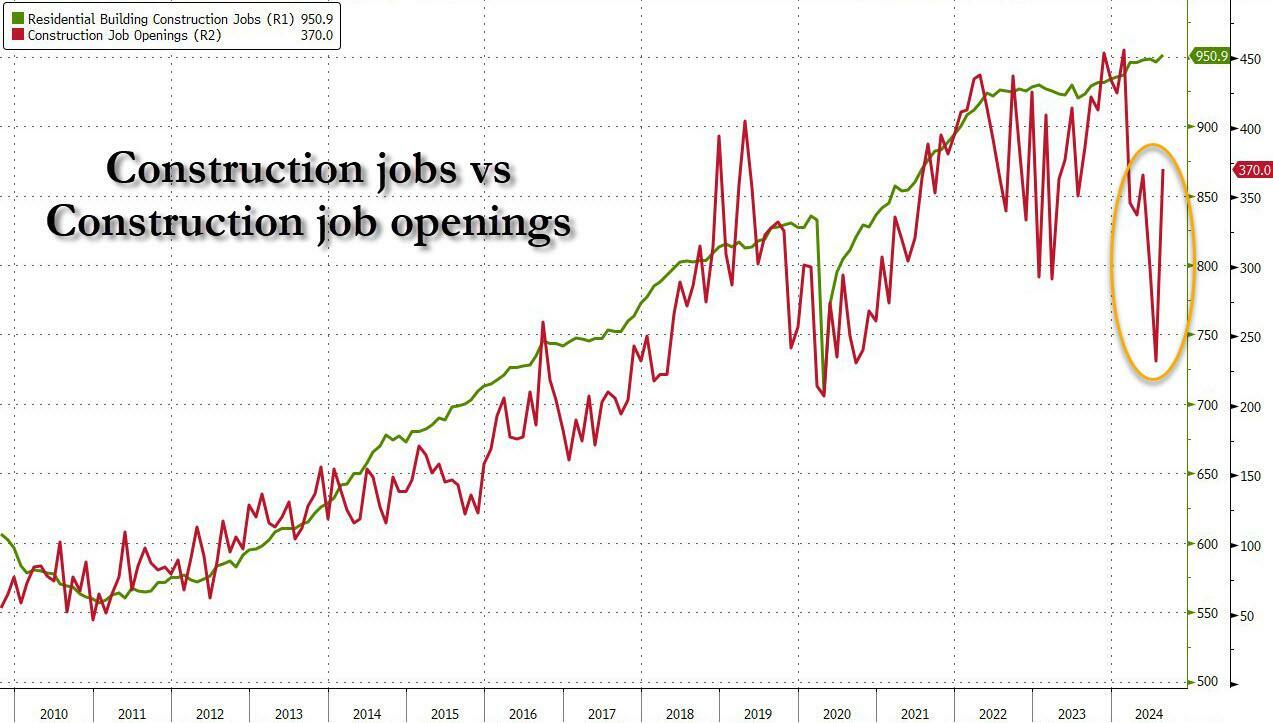
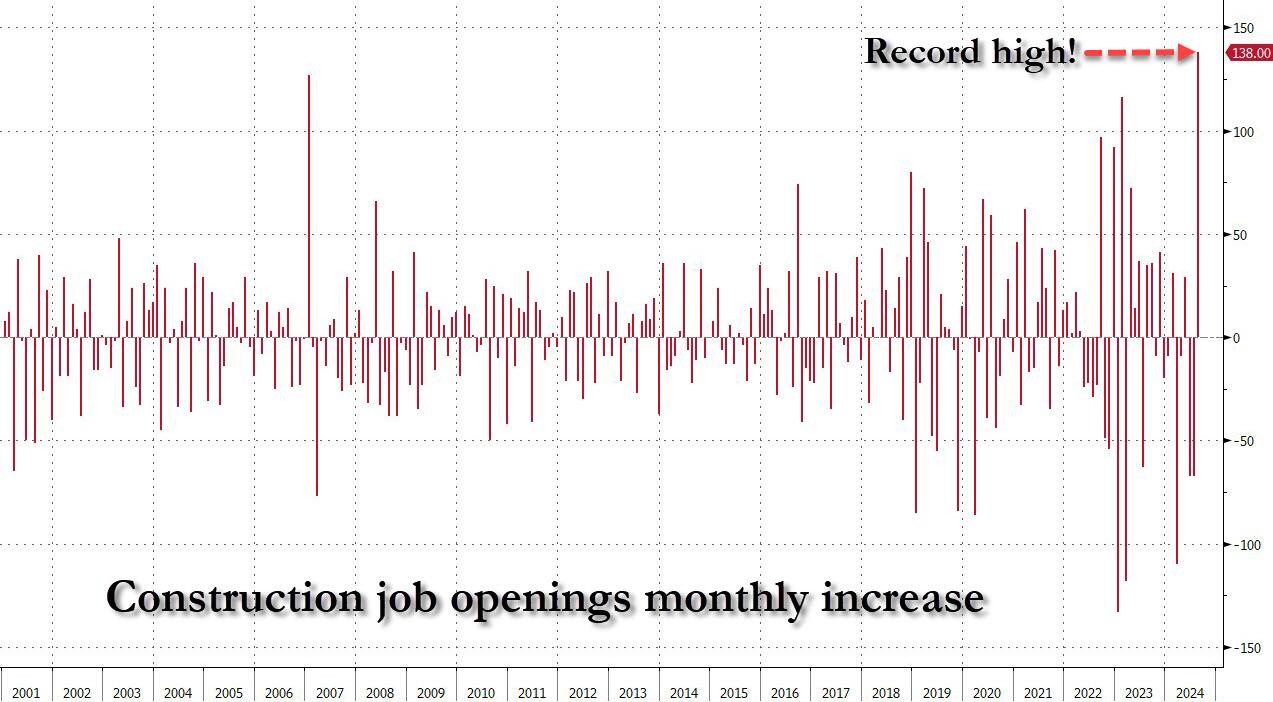
Amusingly, after we mocked two months ago the stunning surge in construction job openings just as a record chasm had opened between the manipulated number of construction jobs and openings…
… which meant the biggest monthly surge in construction job openings on record at a time when the housing market has effectively frozen thanks to sky high interest rates, a simply glorious paradox of manipulated bullshit data…
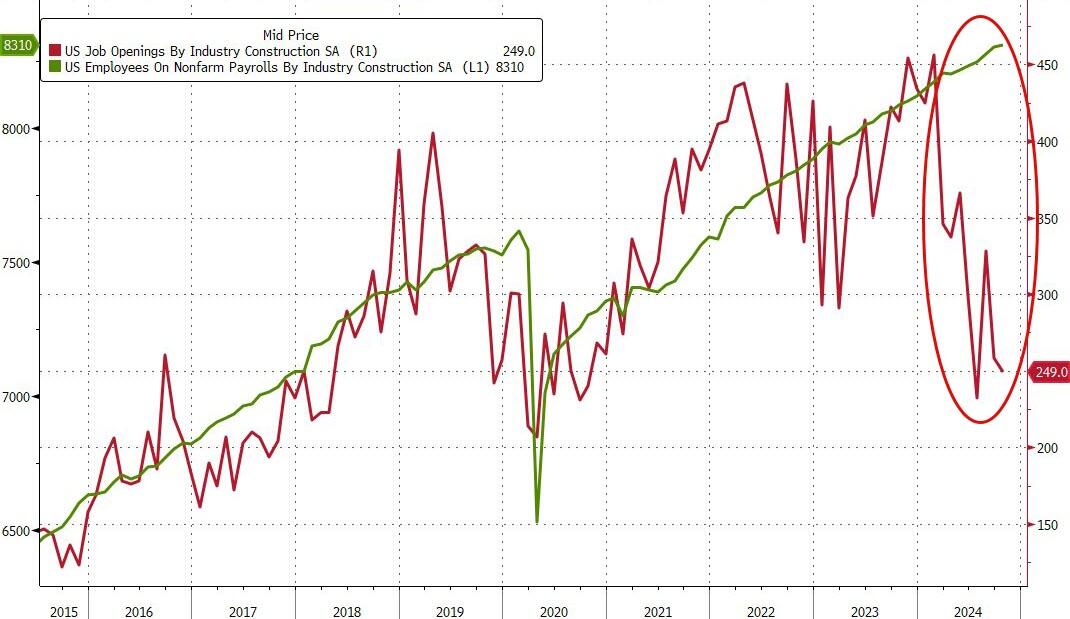
… the BLS realized that it had to make an adjustment after getting called out, and Construction Job openings dropped by another 9K to 249K and back to post-covid lows. Oh, and yes, the number of “construction jobs” is about to fall off a cliff just as soon as Orange Man Bad enters the White House.
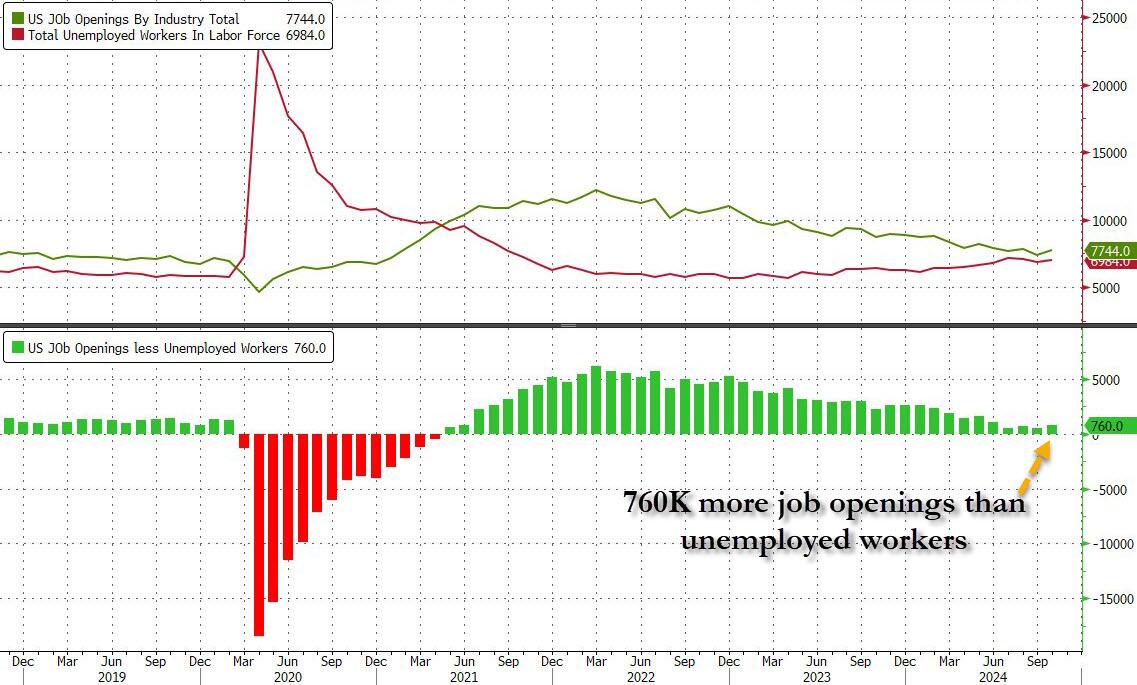
Setting the glaring data manipulation aside, in the context of the broader jobs report, in October the number of job openings was 770K more than the number of unemployed workers, an increase from the previous month and not too far from inverting once again, similar to what happened during the covid crash.
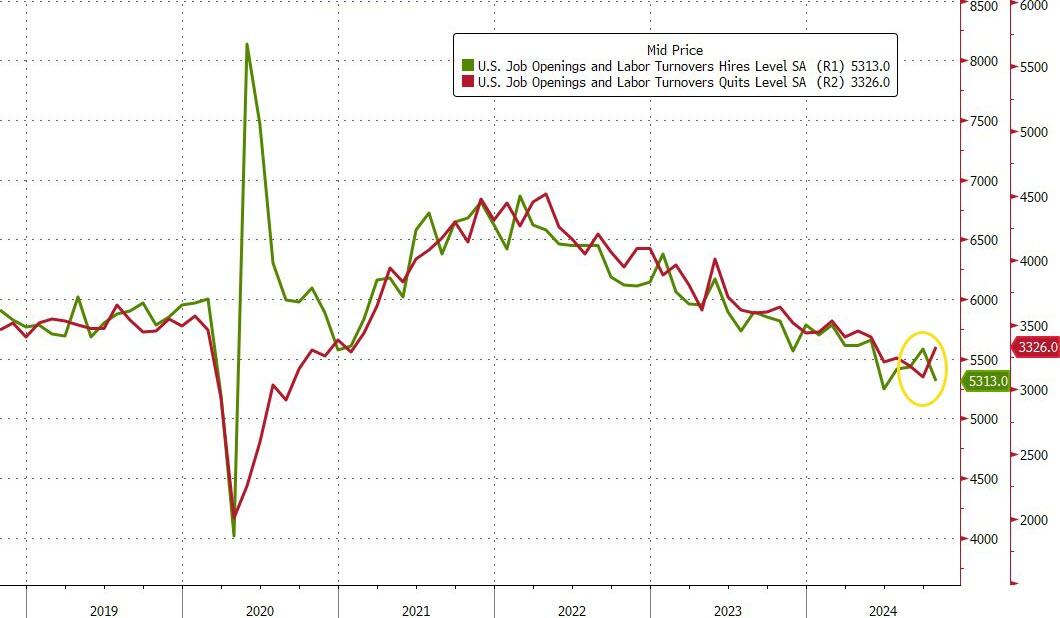
But while the job openings surge was a surprising reversal of the deteriorating trend observed for much of 2024, where even the DOL was stumped was the number of hires, which tumbled from 5.582 million to 5.313 million, a new post-covid low.
Commenting on the plunge, SouthBay Research notes that “hiring was weak in October and the last time hiring was this low was June and NFP slowed to 118K. But remember that this data aligns with the October Payroll data – not November’s. Both October NFP and the latest October JOLTS Hiring data cover the same period (through mid-October).” Furthermore, there were an additional 4 weeks since this JOLTS survey and hurricane recovery (aka hiring) rebounded. In addition, as the Job Openings indicate, employer intent to hire was already underway when this survey was completed.
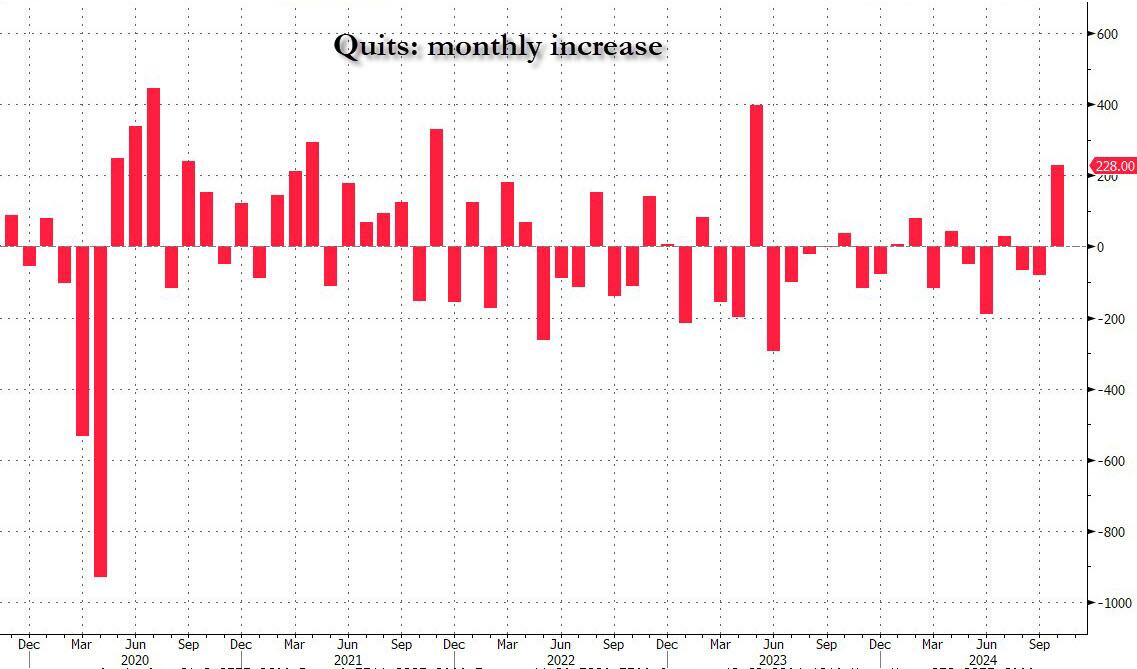
Meanwhile, the drop in hiring was offset by a surprise spike in the number of Quits, which rose by 228K from 3.098MM to 3.326MM, the biggest increase since May 2023, with quits increasing in accommodation and food services (+90,000).
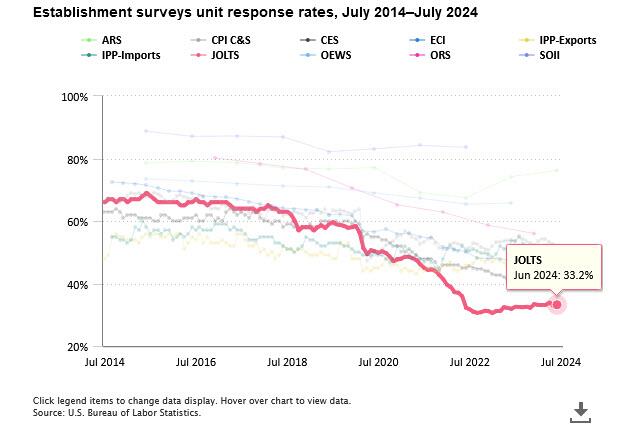
Finally, no matter what the “data” shows, let’s not forget that it is all just estimated, and it is safe to say that the real number of job openings remains still far lower since half of it – or some 70% to be specific – is guesswork. As the BLS itself admits, while the response rate to most of its various labor (and other) surveys has collapsed in recent years, nothing is as bad as the JOLTS report where the actual response rate remains near a record low 33%
In other words, more than two thirds, or 67% of the final number of job openings, is made up!
Looking ahead to Friday’s November Nonfarm Payrolls, the report will be driven by hurricane recovery, with the JOLTS data pointing to a lot of weakness in exactly the areas October Payrolls slipped. As for organic hiring, there have been no anecdotal signs of hiring pullback heading into November. On the contrary: businesses seem to be inclined to ramp up a bit, now that Trump is president and promises a dramatic easing of regulations.
Congress went wild spending on Covid relief and related wasteful spending. Notice that the impetus for job openings (spending) occurred before “Angry Joe” Biden and Commie-la Harris were sworn in. So, the job creation claims by Biden/Harris were put into motion before they assumed office.
The lag in job openings growth after the surge in spending is clearly visible in the following chart, as is the BURNOUT in job openings growth after Covid spending burned out.
Harris is promising explosive spending if elected. And she is promising MORE regulations! And the regulatory burden will grow.


You must be logged in to post a comment.