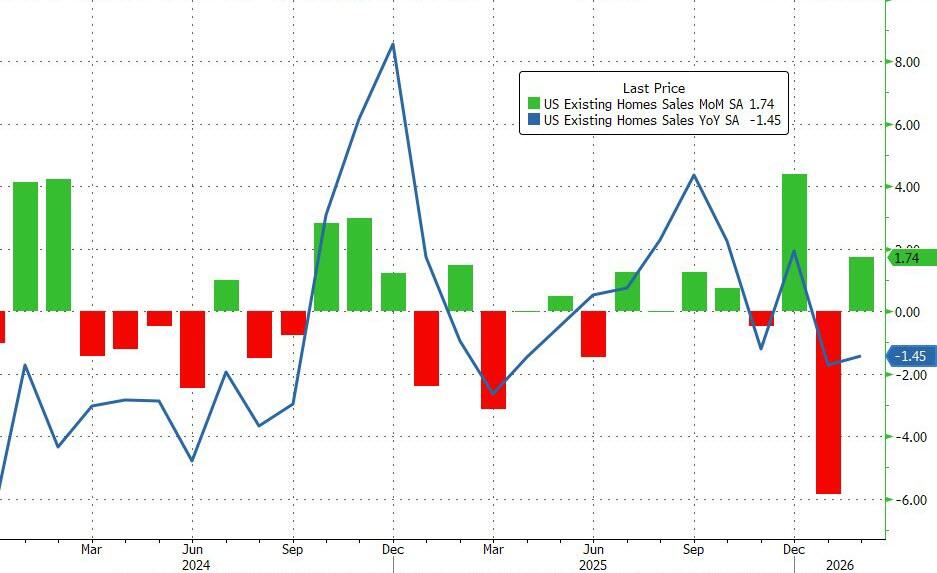
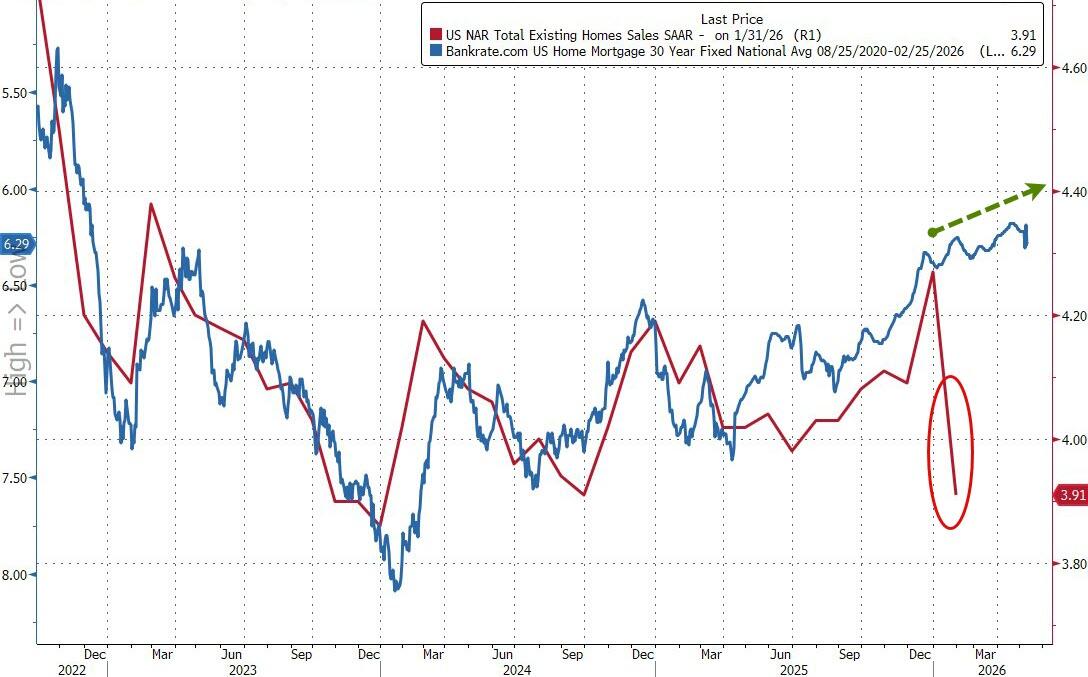
Existing homesales actually surprised to the upside, rising 1.7% MoM in February. Perhaps even more notably, January’s 8.4% MoM plunge was revised up to a slightly less crazy 5.9% MoM drop.
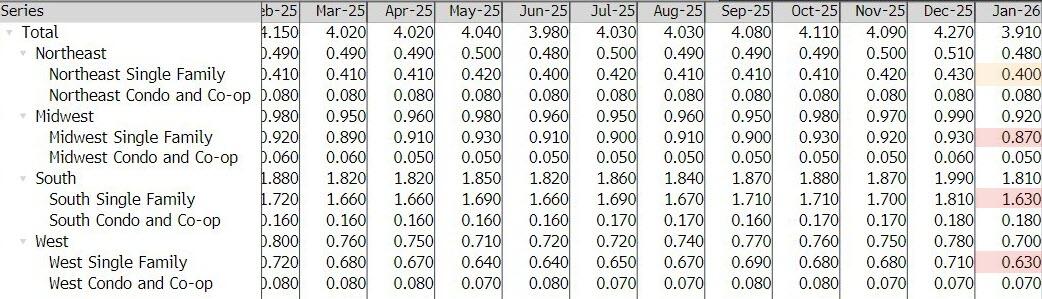
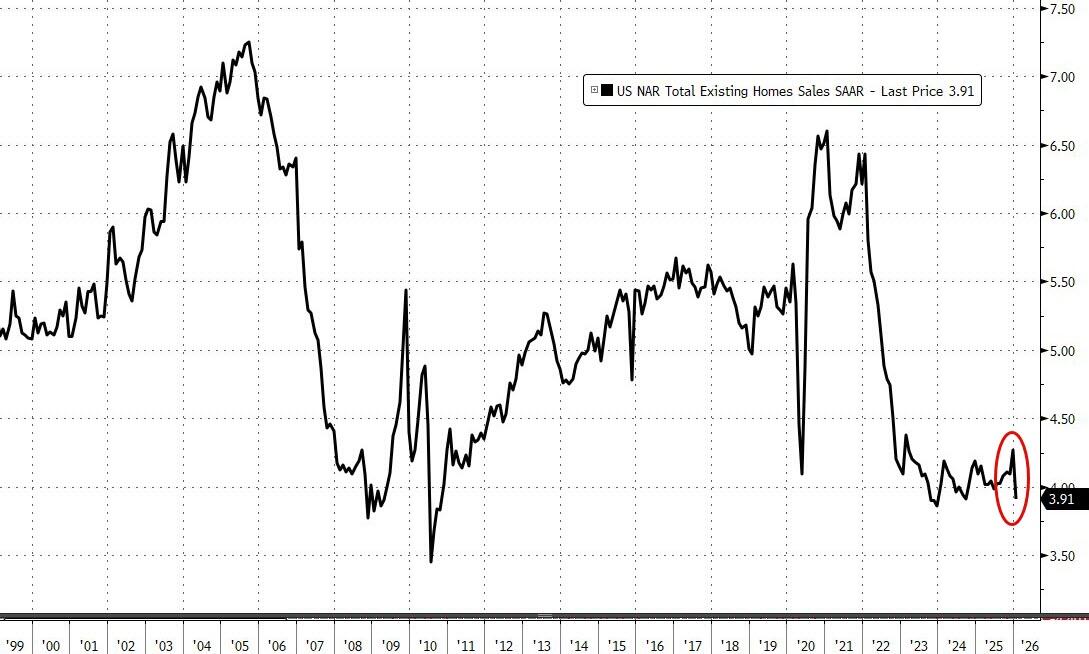
With the beat and upward revision, existing home sales were down just 1.45% YoY but SAAR topped 4mm (4.09mm) once again.
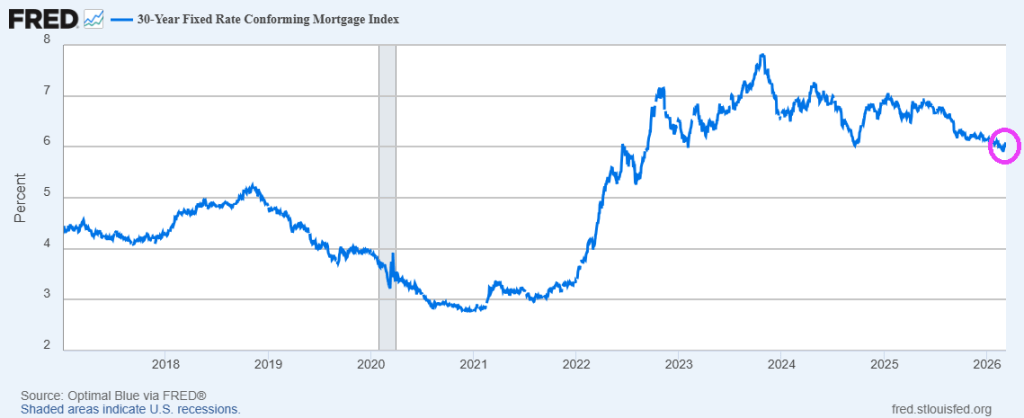
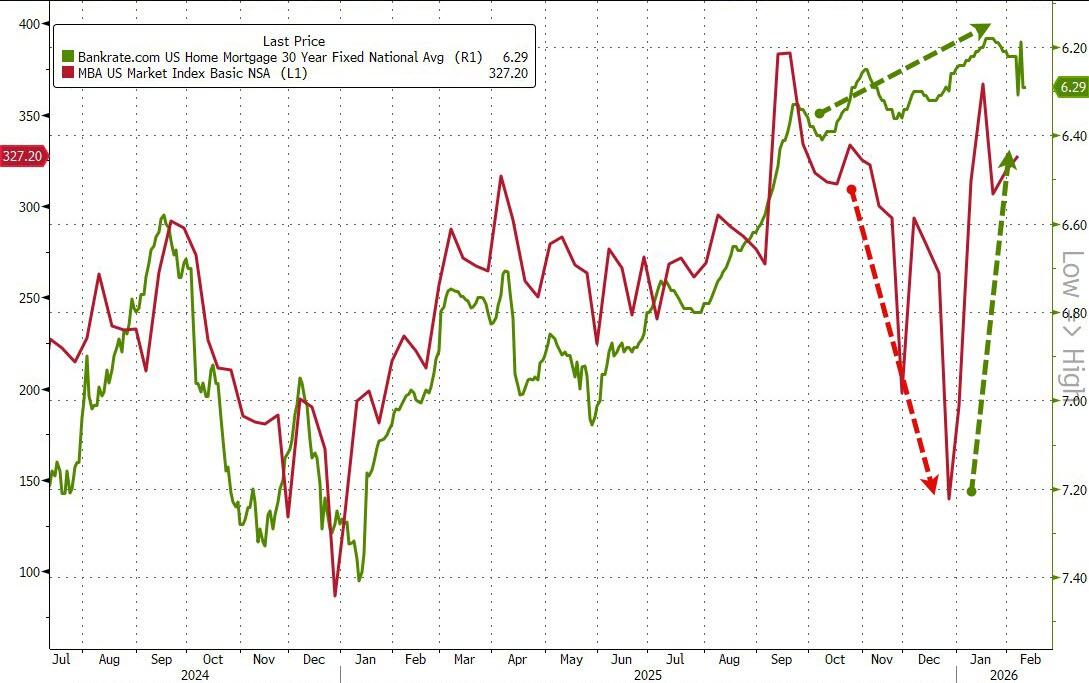
On the bright side, with mortgage rates at their lowest since 2022, existing home sales look set to continue to improve (unless Trump’s war triggers more panic in rates).
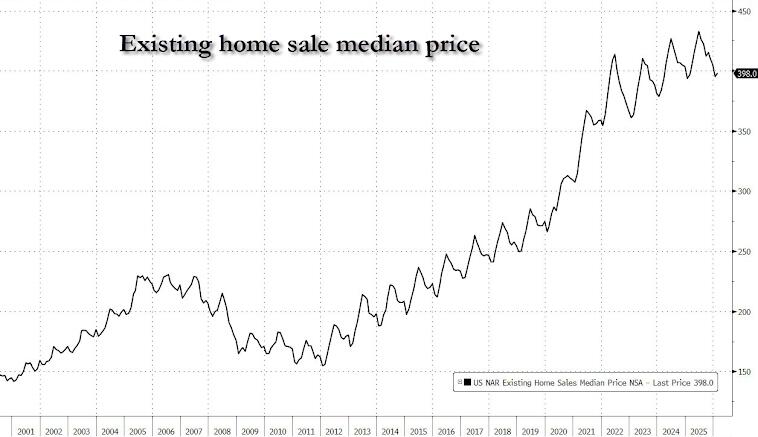
The NAR report showed the median selling price rose 0.3% from a year earlier — one of the smallest advances since the pandemic housing frenzy — to $398,000 last month.
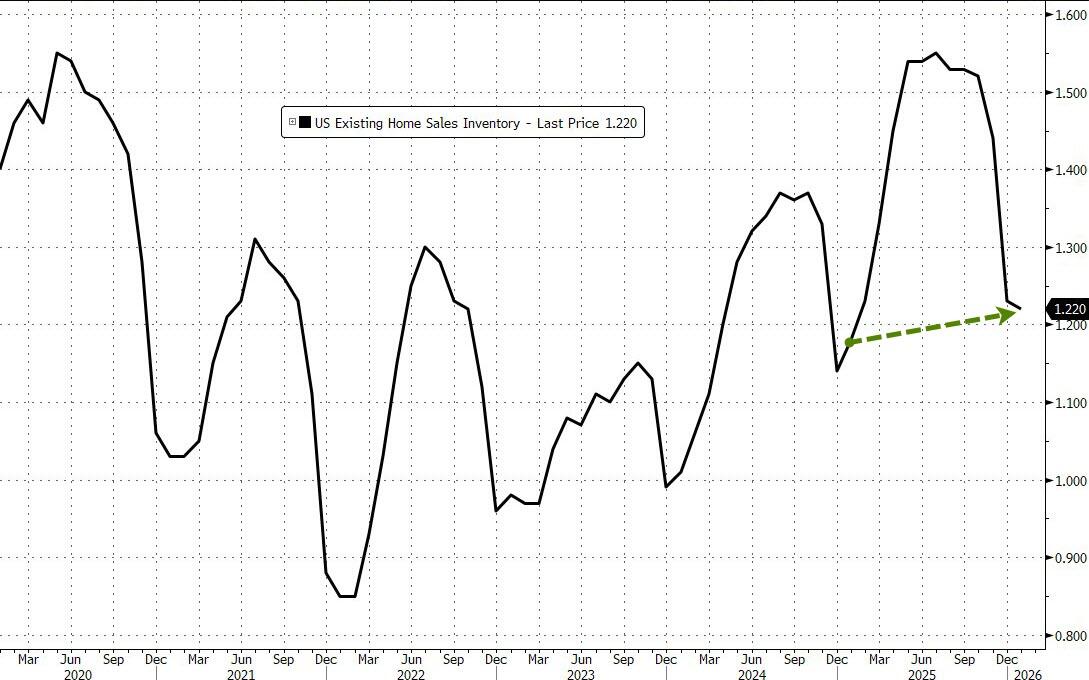
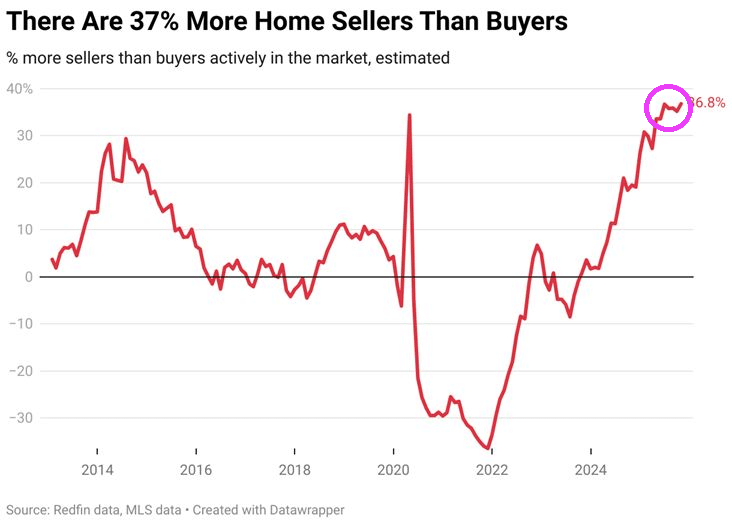
The inventory of previously owned homes increased 4.9% from a year ago to 1.29 million — the most for any February since 2020.
Mortgage rates? Up yesterday, but near lowest since 2023.
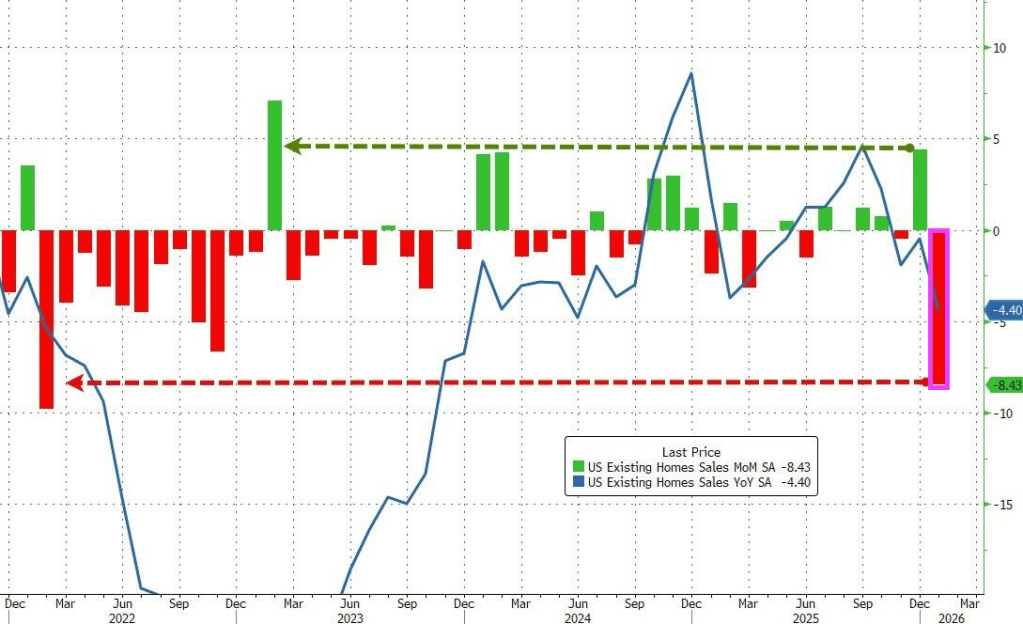
The analysts were correct on the direction but wrong on the scale as existing home sales plunged 8.4% MoM in January from a downwardly revised +4.4% MoM in December. That is the biggest MoM drop since February 2022.
While some suggested this could be impacted by the Winter Storms, this is based on contracts signed in November/December… and the biggest decline was in The West (which had zero weather impact)
Nevertheless, realtors gonna realtor:
“The below-normal temperatures and above-normal precipitation this January make it harder than usual to assess the underlying driver of the decrease and determine if this month’s numbers are an aberration,” NAR Chief Economist Lawrence Yun said in a statement.
That MoM plunge pulled the total SAAR down near 15 year lows…
Without an extended period of improved affordability, the recovery in the housing market is likely to be prolonged.
The NAR report showed the median selling price rose 0.9% from a year earlier to $396,800 last month.
First-time buyers represented 31% of buyers of existing homes in January, up slightly from 29% in the prior month and higher than a year ago.
The inventory of previously owned homes increased 3.4% in January from a year ago to 1.22 million.
A pickup in supply through 2025 has helped to tame price growth, though Yun said on a call with reporters that listings need to increase much more to help improve sales.
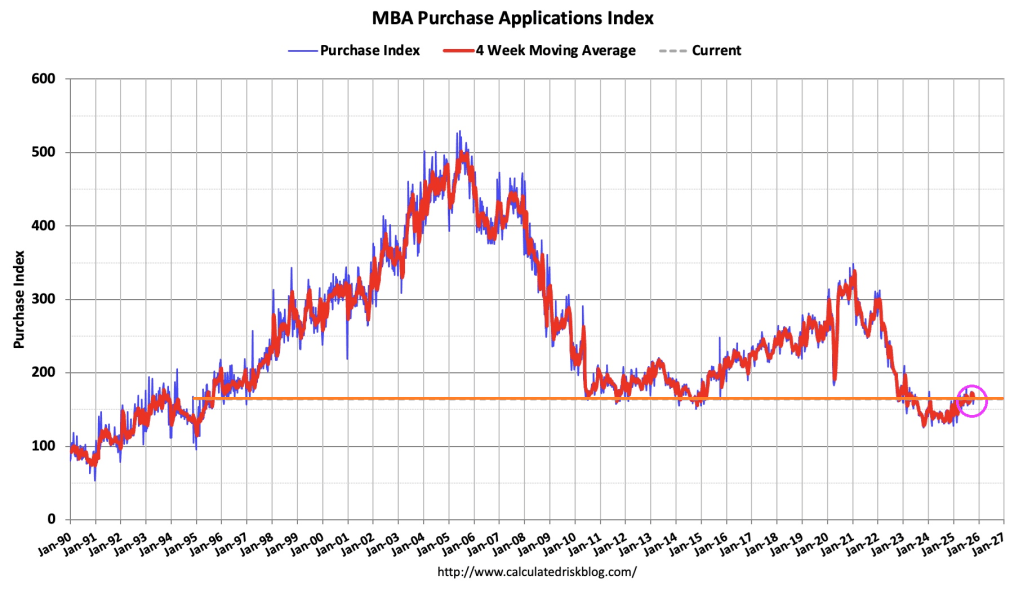
On the bright side, it appears mortgage applications are rebounding as the year started with lower rates…
Source: Bloomberg
Arguably, existing home sales have much further to go to the upside as the lagged mortgage rate has continued to decline… so what triggered this collapse?
Source: Bloomberg
Finally, circling back to where we started, NAR expects home sales to rise a stunning 14% this year, higher than most other forecasts but a figure that NAR Chief Economist Lawrence Yun said he feels “confident” in. That assumes more inventory will come on the market, mortgage rates will hover around 6% and the Fed will cut interest rates another two times, compared to policymakers’ median projection for one.
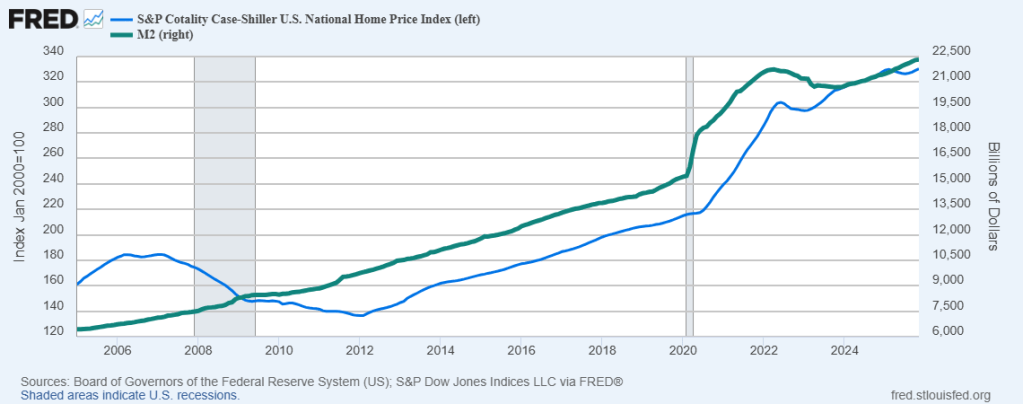
Keep on printing money. It seems that home price growth requires The Fed to keep printing money.
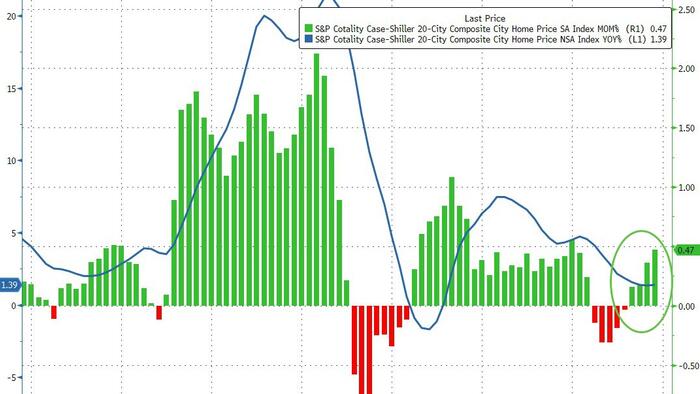
S&P/Case-Shiller released the monthly Home Price Indices for November (“November” is a 3-month average of September, October and November closing prices). September closing prices include some contracts signed in July, so there is a significant lag to this data. Here is a graph of the month-over-month (MoM) change in the Case-Shiller National Index Seasonally Adjusted (SA).
The S&P Cotality Case-Shiller U.S. National Home Price NSA Index posted a 1.4% annual gain for November, in line with the previous month.
Real home values declined as consumer inflation (2.7%) outpaced the National Index gain (1.4%) by 1.3 percentage points.
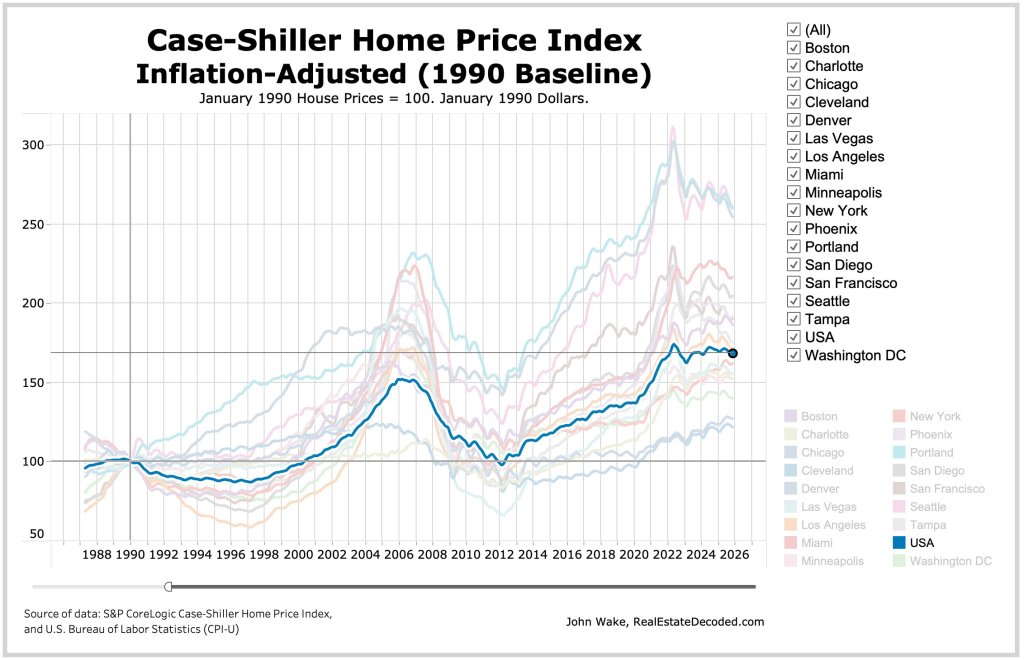
Regional divergence persisted: Midwestern and Northeastern markets led by Chicago (+5.7%) and New York (+5.0%) posted gains, while Sun Belt cities including Tampa (–3.9%), Phoenix (–1.4%), Dallas (–1.4%), and Miami (–1.0%) saw declines. … “Regional patterns continue to illustrate a stark divergence. Chicago leads all cities for a second consecutive month with a 5.7% year-over-year price increase, followed by New York at 5.0% and Cleveland at 3.4%. These historically steady Midwestern and Northeastern markets have maintained respectable gains even as overall conditions cool. By contrast, Tampa home prices are 3.9% lower than a year ago – the steepest decline among the 20 cities, extending that market’s 13-month streak of annual drops. Other Sun Belt boomtowns remain under pressure as well: Phoenix (-1.4%), Dallas (-1.4%), and Miami (-1.0%) each continue to see year-over-year declines, a dramatic turnaround from their pandemic-era strength.
“Monthly price changes were mixed but leaned negative in November, underscoring persistent softness. On a non-seasonally adjusted basis, 15 of the 20 major metro areas saw prices decline from October (versus 16 declines in the previous month). Only a handful of markets – including Los Angeles, San Diego, Miami, New York, and Phoenix – eked out slight gains before seasonal adjustment. After accounting for typical seasonal slowing, the National Index inched up just 0.4% for the month, indicating that price momentum remains muted. … The S&P Cotality Case-Shiller U.S. National Home Price NSA Index, covering all nine U.S. census divisions, reported a 1.4% annual gain for November. The 10-City Composite showed an annual increase of 2.0%, up from a 1.9% increase in the previous month. The 20-City Composite posted a year-over-year increase of 1.4%, up from a 1.3% increase in the previous month. … The pre-seasonally adjusted U.S. National Index saw a drop of 0.1% and the 20-City Composite Index fell 0.03%, while the 10-City Composite Index increased 0.1%.
After seasonal adjustment, the U.S. National Index reported a monthly increase of 0.4%, and both the 10-City Composite and 20-City Composite Indices posted month-over-month gains of 0.5%.
The Market Composite Index, a measure of mortgage loan application volume, decreased 5.0 percent on a seasonally adjusted basis from one week earlier. On an unadjusted basis, the Index decreased 6 percent compared with the previous week. The seasonally adjusted Purchase Index decreased 4 percent from one week earlier. The unadjusted Purchase Index decreased 6 percent compared with the previous week and was 16 percent higher than the same week one year ago.
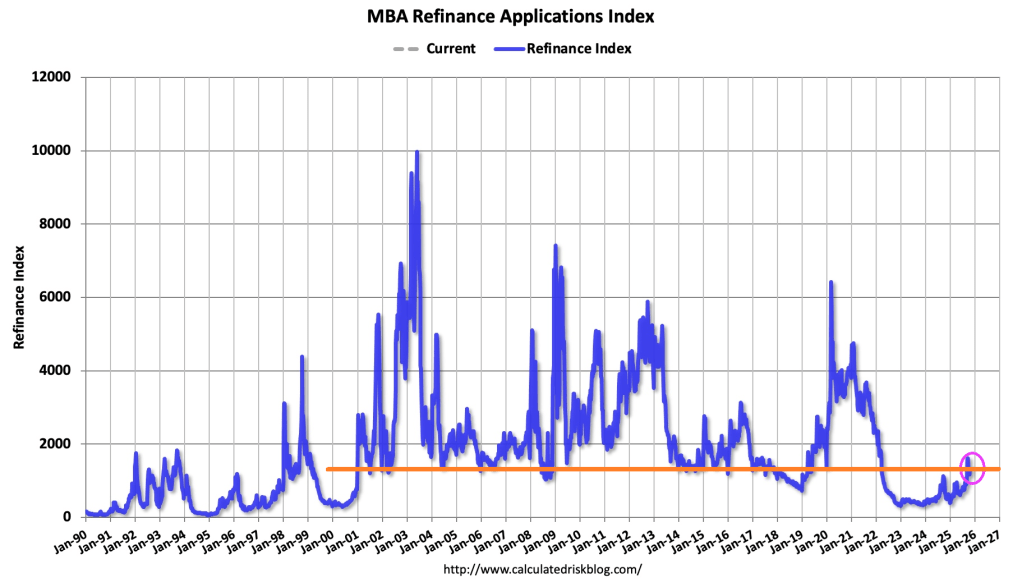
The Refinance Index decreased 6 percent from the previous week and was 110 percent higher than the same week one year ago.
Overall mortgage application volume fell last week, despite the slight decline in mortgage rates. I expect the trends of a softening job market, sticky inflation, elevated home inventories, and steady mortgage rates will persist into the new year.
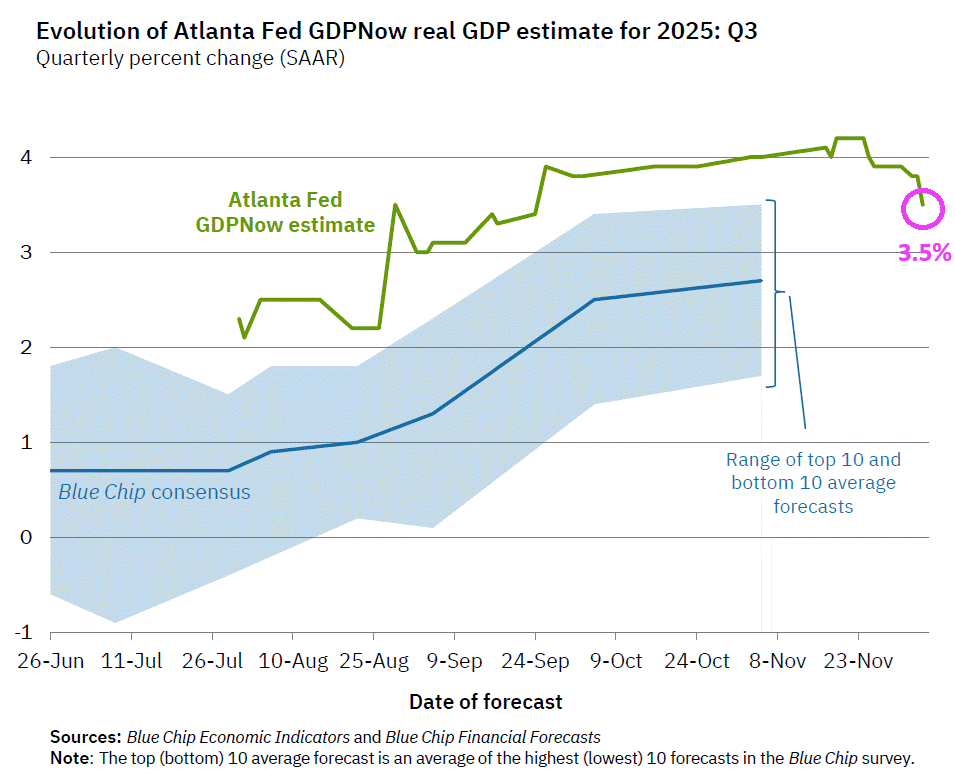
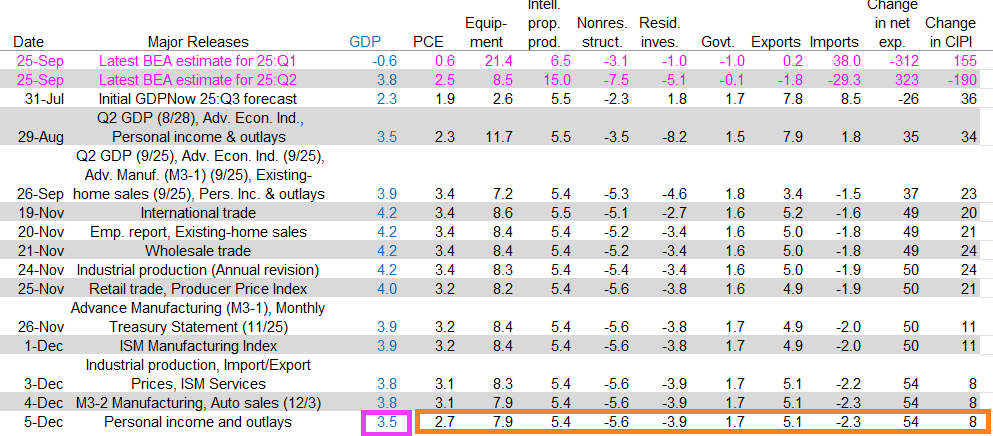
The GDPNow model estimate for real GDP growth (seasonally adjusted annual rate) in the third quarter of 2025 is 3.5 percent on December 5, down from 3.8 percent on December 4. After this morning’s personal income and outlays release from the US Bureau of Economic Analysis, the nowcast for third-quarter real personal consumption expenditures growth declined from 3.1 percent to 2.7 percent.
Unfortunately, residential and non-residential construction are negative as are imports.
The US mortgage market is “livin’ on a prayer.” As a result, former homebuilder and current FHFA Director Bill Pulter has suggested 2 mortgage products to make US homes more “affordable”, adding to the legacy of stupid government policies to increase homeownership.
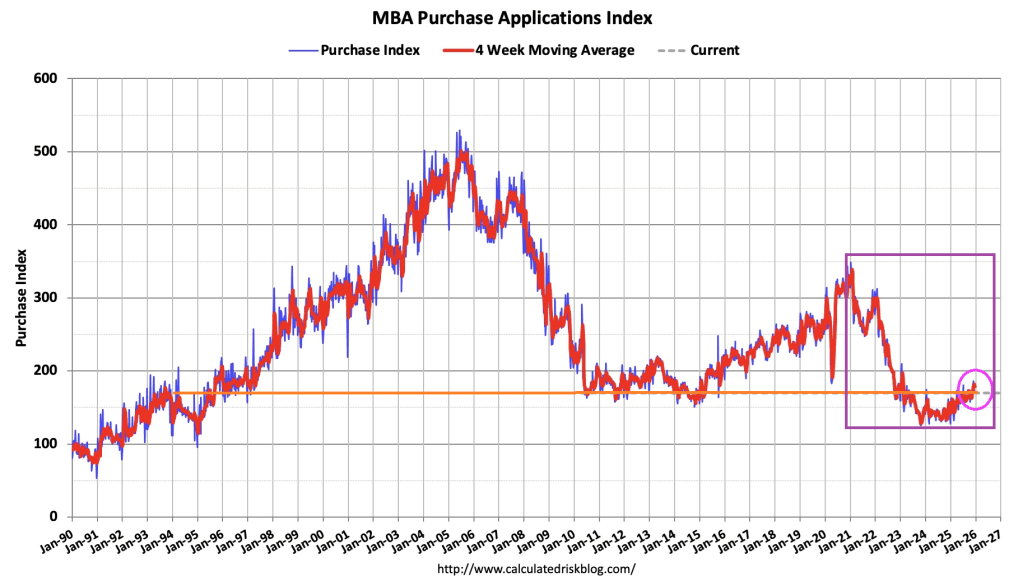
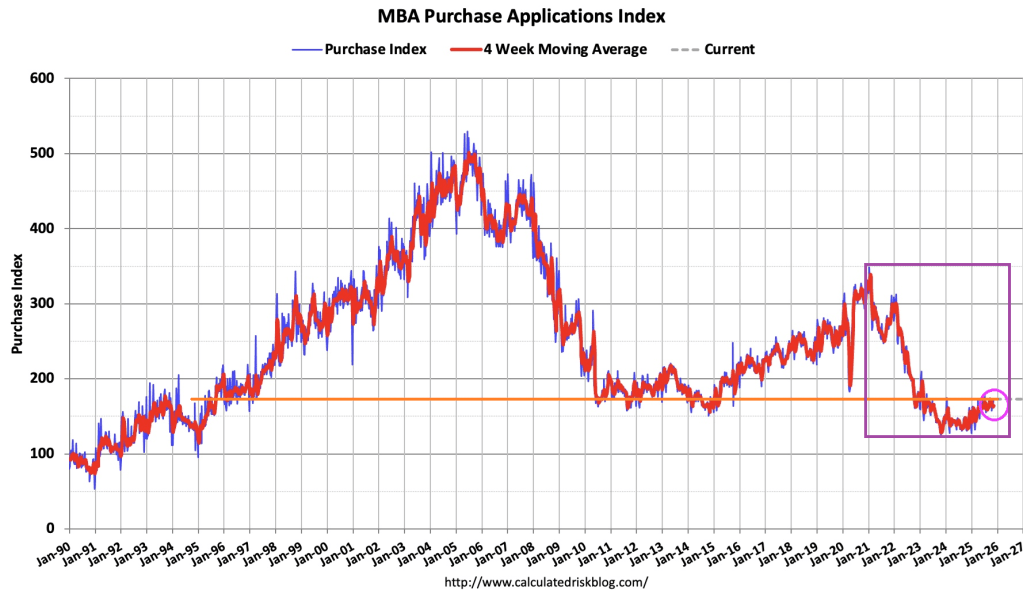
But first, current mortgage demand. Mortgage applications increased 0.6 percent from one week earlier, according to data from the Mortgage Bankers Association’s (MBA) Weekly Mortgage Applications Survey for the week ending November 7, 2025.
The Market Composite Index, a measure of mortgage loan application volume, increased 0.6 percent on a seasonally adjusted basis from one week earlier. On an unadjusted basis, the Index decreased 1 percent compared with the previous week. The seasonally adjusted Purchase Index increased 6 percent from one week earlier. The unadjusted Purchase Index increased 3 percent compared with the previous week and was 31 percent higher than the same week one year ago.
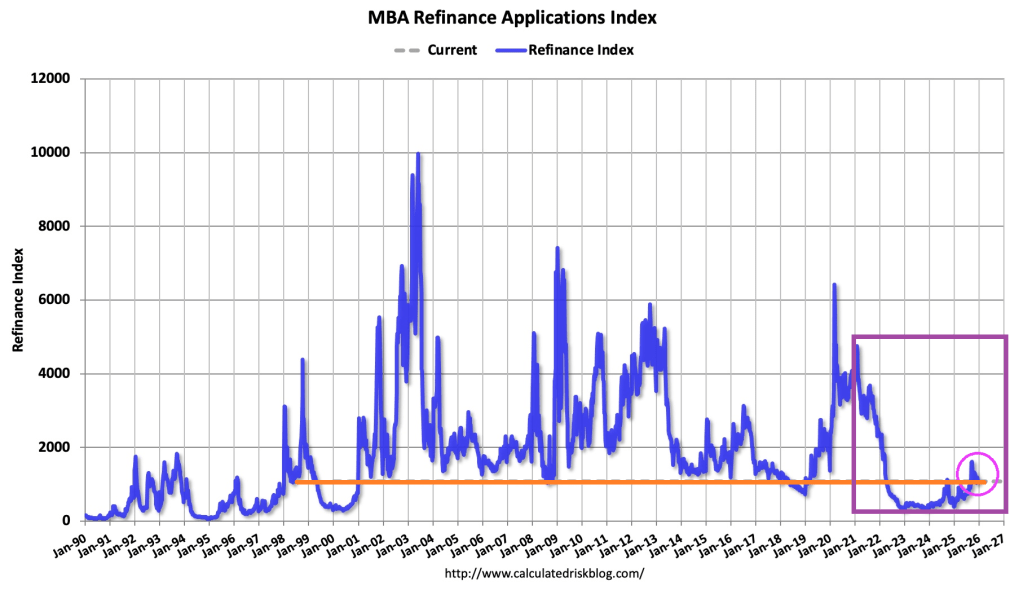
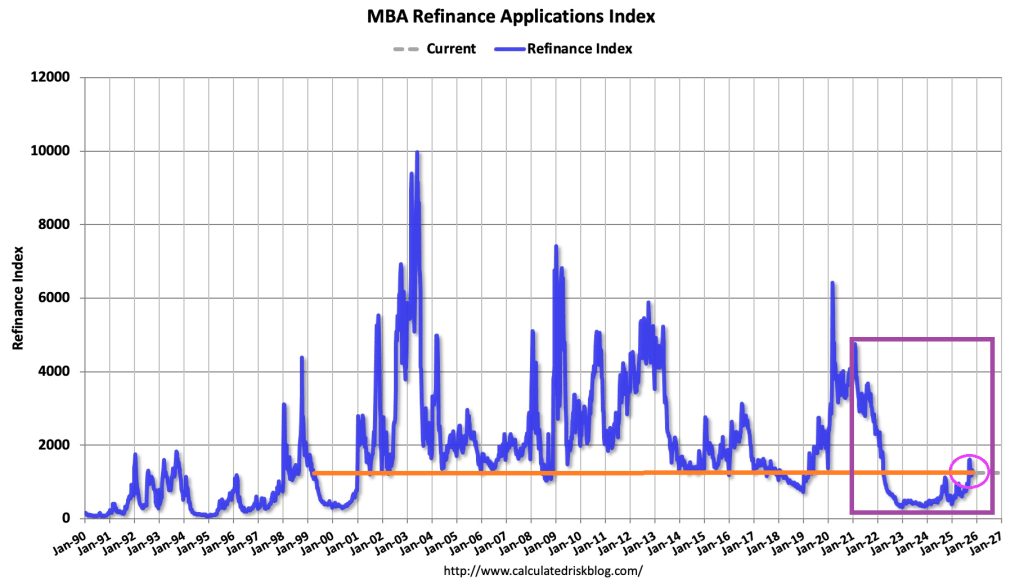
The Refinance Index decreased 3 percent from the previous week and was 147 percent higher than the same week one year ago.
Now on to Pulte’s stupid mortgage proposals.
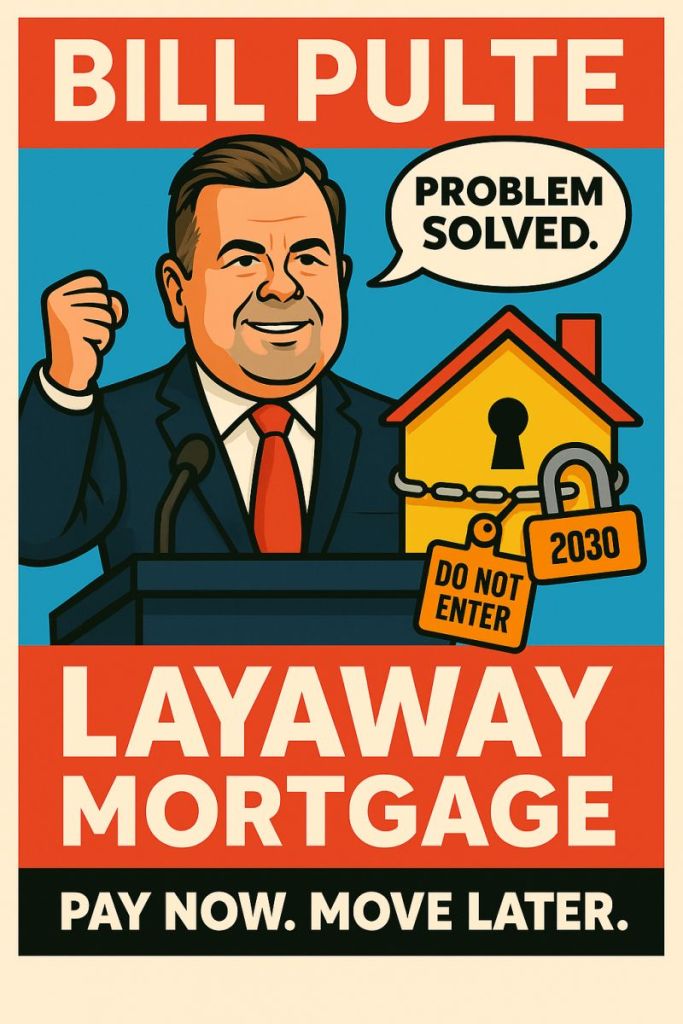
Pulte Doubles Down After 50-Year Backlash, Proposes “Layaway Mortgage”
The 50-year mortgage is a stupid idea. True, it can reduce the monthly mortgage payment by several hundred dollars. But it extends the life of the mortgage from 30 to 50 years, keeping the outstanding mortgage balance elevated for longer, exposing the lender (or mortgage owner) to greater losses in the case of default. Not surprising since the duration risk of a 50-year mortgage is greater than on a 30-year mortgage. Who is going to hold these mortgages??
So, Pulte hearing that the mortgage market thinks this is a stupid idea, introduced another stupid mortgage idea: the “layaway mortgage” where buyers make payments for 5-10 years before they’re allowed to move into the home. This is a variation of “rent to own.”
Under Pulte’s Layaway Mortgage program:
▪️ Buyers select a home and begin making monthly payments immediately ▪️ They continue paying for 5-10 years (the “layaway period”) ▪️ During this time, they cannot live in the home, modify it, or even visit without an appointment ▪️ After the layaway period ends, buyers can move in and begin their 40-year mortgage ▪️ If they miss a payment during layaway, they forfeit everything and the home goes back on the market.
So, in other word, a 50-year mortgage (40+10 layaway).
Note: Japan used to offer 100-year mortgages during their housing bubble, but now 35-year mortgages are more common.
Mortgage applications increased 7.1 percent from one week earlier, according to data from the Mortgage Bankers Association’s (MBA) Weekly Mortgage Applications Survey for the week ending October 24, 2025.
The Market Composite Index, a measure of mortgage loan application volume, increased 7.1 percent on a seasonally adjusted basis from one week earlier. On an unadjusted basis, the Index increased 7 percent compared with the previous week. The seasonally adjusted Purchase Index increased 5 percent from one week earlier. The unadjusted Purchase Index increased 4 percent compared with the previous week and was 20 percent higher than the same week one year ago.
The Refinance Index increased 9 percent from the previous week and was 111 percent higher than the same week one year ago.
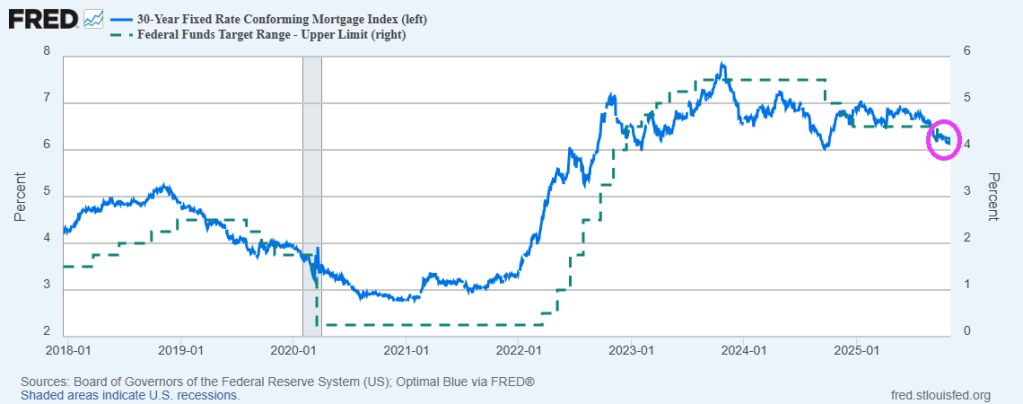
The average contract interest rate for 30-year fixed-rate mortgages with conforming loan balances ($806,500 or less) decreased to 6.30 percent from 6.37 percent, with points decreasing to 0.58 from 0.59 (including the origination fee) for 80 percent loan-to-value ratio (LTV) loans.
Yesterday, The Fed lowered their target rate by 25 basis points. And the 30-year conforming rate index fell by 0.037 basis points to 6.155%.
On the government shutdown side, USDA applications fell more than 26 percent.
Fed Chair Jerome Powell at The Federal Reserve Building in Washington DC.
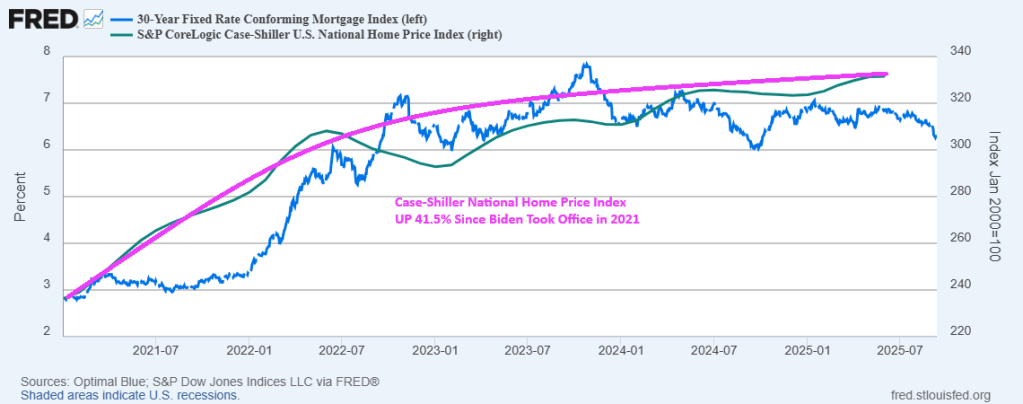
Mortgage rates remain elevated since the Biden Administration took control in 2021. Although under Trump, the rise in the 30-year mortgage rate has slowed. But the 30-year mortgage rate is up 126% since the beginning of 2021 and the “Joe The Boss” Biden administration.
Mortgage originations at large banks declined a whopping 74% under “Joe The Boss” Biden.
Between mortgage rates rising by 126% and house prices rising by 41.5% under “Joe The Boss” Biden.


You must be logged in to post a comment.