Wow! Gold just had its best quarterly performance since the 1980s!

Meanwhile, the volatility of gold ETFs remains subdued.

Confounded Interest – Anthony B. Sanders
Financial Markets And Real Estate
Wow! Gold just had its best quarterly performance since the 1980s!
Meanwhile, the volatility of gold ETFs remains subdued.
Soothe me? As we move further away from Sleepy Joe’s horrid economic policies, we should see an improvement in GDP from the current Atlanta Fed GDP Now Q1 Forecast of -2.8%.
The GDPNow model estimate for real GDP growth (seasonally adjusted annual rate) in the first quarter of 2025 is -2.8 percent on March 28, down from -1.8 percent on March 26.

The alternative model forecast, which adjusts for imports and exports of gold as described here, is -0.5 percent. After recent releases from the US Census Bureau and the US Bureau of Economic Analysis, the nowcast of the contribution of net exports to first-quarter real GDP growth declined from -3.95 percentage points to -4.79 percentage points in the standard model and from -1.92 percentage points to -2.53 percentage points in the alternative model.
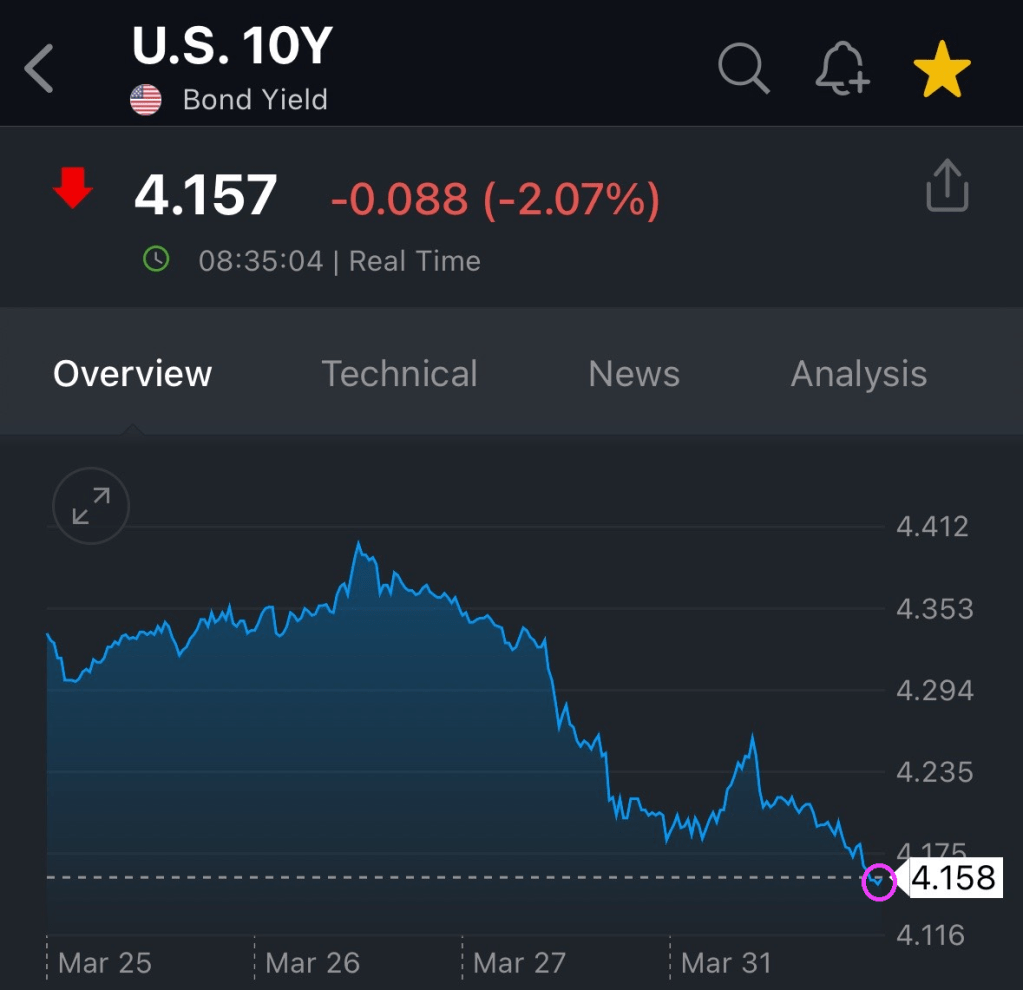
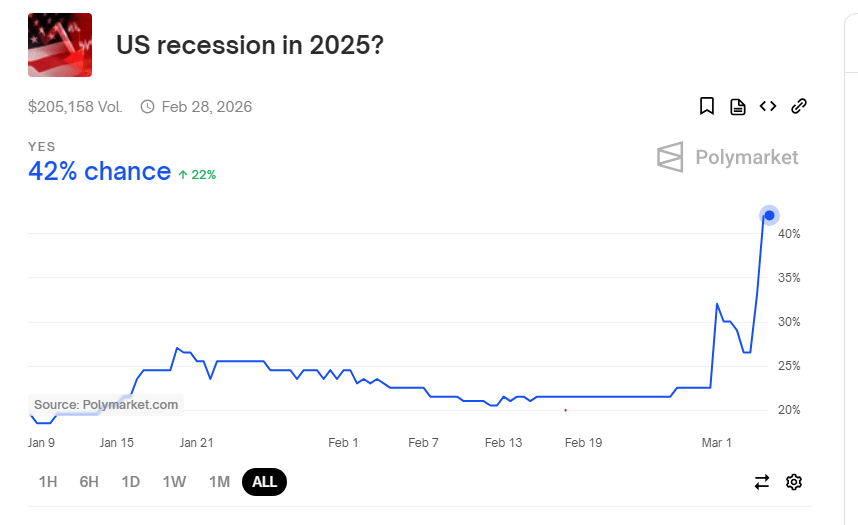
The US Treasury 10Y yield has fallen to 4.157% as recession fears mount.
Housing and rental properties are simply unaffordable.
Freddie Mac Serious Delinquency Rate on Multifamily (Apartment) loans soared to highest rate since 2000. Since it is as of January 31, 2025, you can’t blame this on Donald Trump (although I am sure they will try).

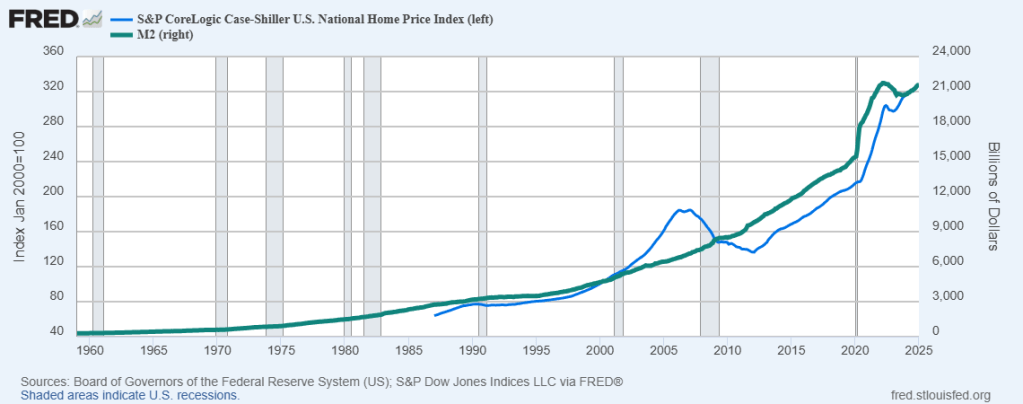
Of course, home prices and rents soared under Biden. Home prices rose 37% under Biden and rents rose 25%. Simply unaffordable.

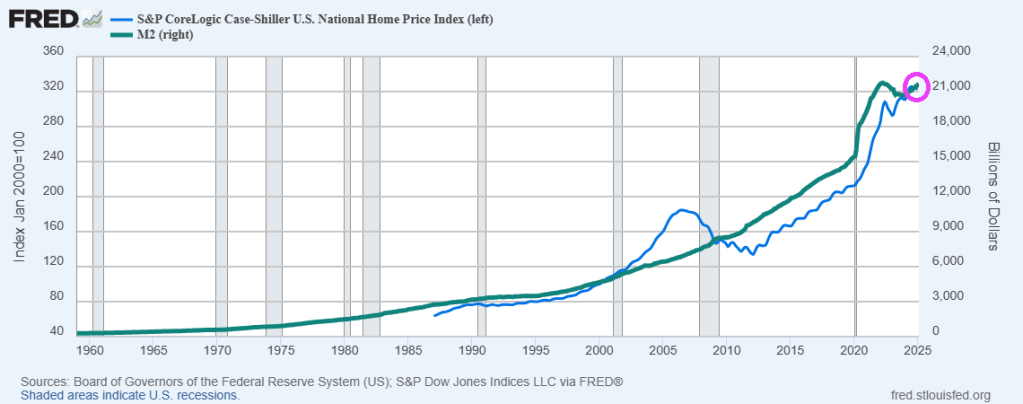
And The Fed will keep on printing money!

Credit has been deteriorating.

Apparently, we DID get fooled again. In February, there were 500,000 new homes for sale.

While new home inventory hit 500k, existing home inventory rose to 1.24 million homes.

Cause? Home prices are too damn high. Thanks to Powell and The Fed.
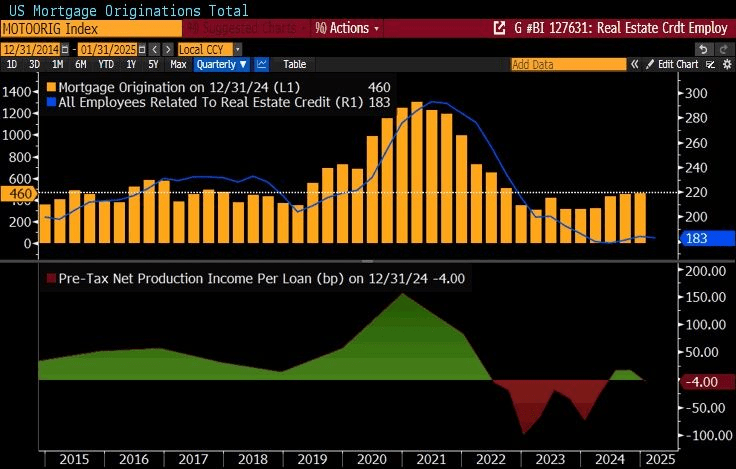
Mortgage originations have dwindled under Biden/Harris.
Jerome Powell and the Blackhearts.

The Imperial March from Star Wars should have been the theme for Bidenomics, the top-down government-directed economy (mainly to political donors). It will take a while for the economy to recover from its addiction to Federal government spending.
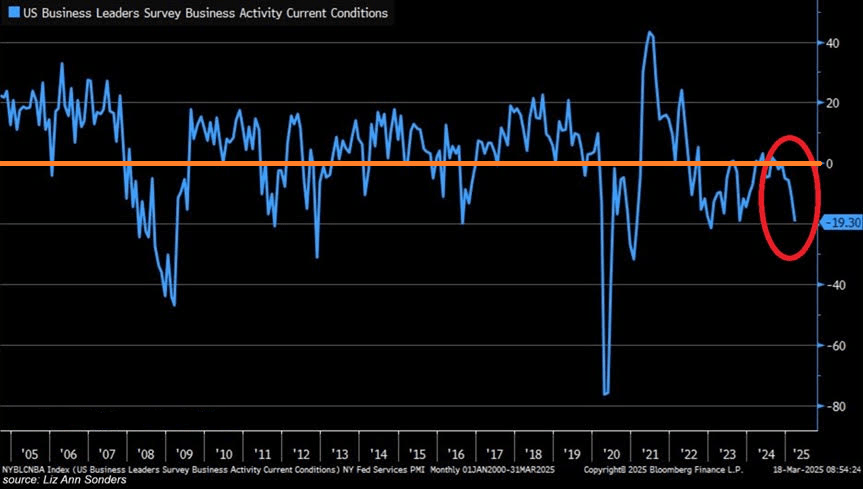
Speaking of The Empire, the New York Fed’s Empire State business activity survey declined to -19.30. Would Jerome Powell and The Fed have cut rates had they known about the Empire activity survey yesterday?
Emperor Palpatine. Aka, 10% Joe.

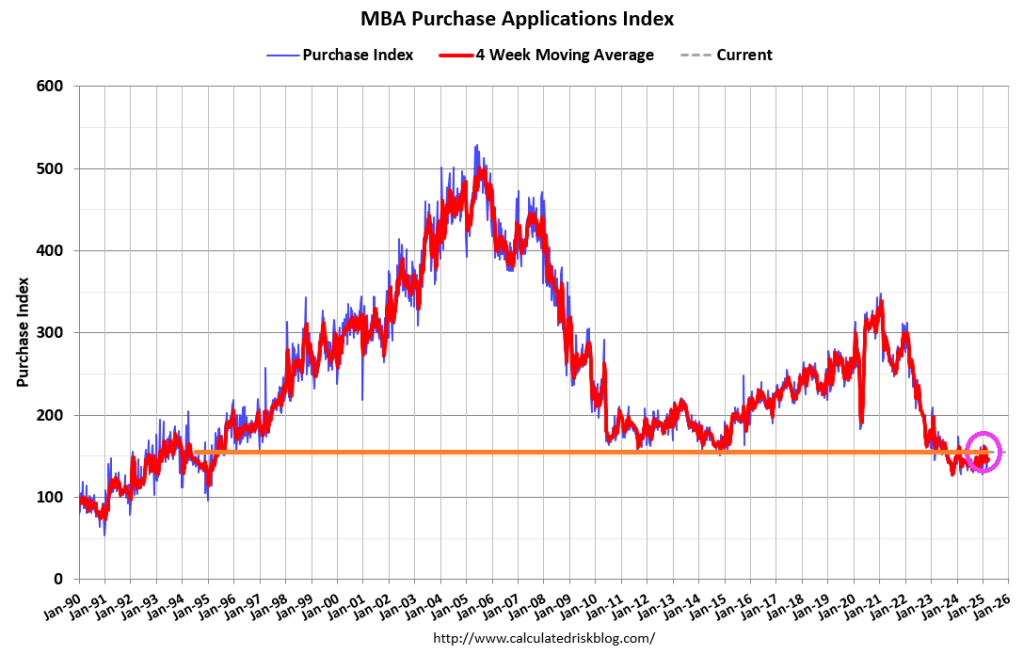
Mortgage applications decreased 6.2 percent from one week earlier, according to data from the Mortgage Bankers Association’s (MBA) Weekly Mortgage Applications Survey for the week ending March 14, 2025.
The Market Composite Index, a measure of mortgage loan application volume, decreased 6.2 percent on a seasonally adjusted basis from one week earlier. On an unadjusted basis, the Index decreased 6 percent compared with the previous week. The seasonally adjusted Purchase Index increased 0.1 percent from one week earlier. The unadjusted Purchase Index increased 1 percent compared with the previous week and was 6 percent higher than the same week one year ago.
The Refinance Index decreased 13 percent from the previous week and was 70 percent higher than the same week one year ago.
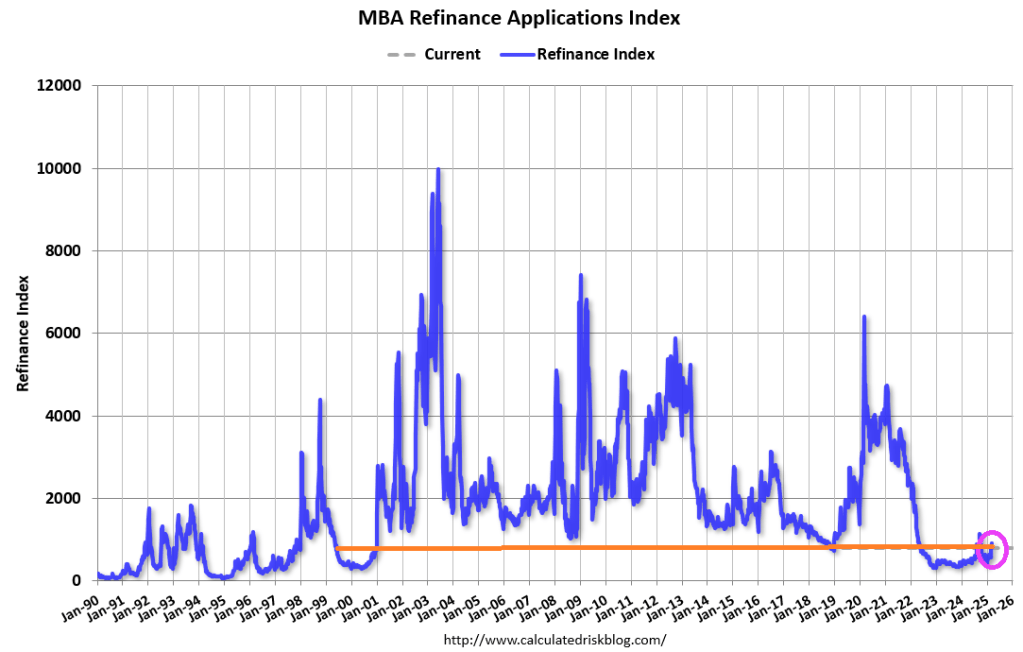
Mortgage rates increased for the first time in nine weeks, with the 30-year fixed rate rising to 6.72 percent. This increase in rates led to a decrease in refinance volume. However, purchase application volume inched up to its highest level in six weeks, led by a 3 percent increase in FHA purchase applications. Overall, purchase application volume is up 6 percent compared to last year at this time. Growing inventories of homes on the market and steadier mortgage rates are supporting homebuying activity thus far this spring.
The US economy is gradually recovering from Bidenomics (government/donor dictated spending). Mortgage applications increased 11.2 percent from one week earlier, according to data from the Mortgage Bankers Association’s (MBA) Weekly Mortgage Applications Survey for the week ending March 7, 2025.
The Market Composite Index, a measure of mortgage loan application volume, increased 11.2 percent on a seasonally adjusted basis from one week earlier. On an unadjusted basis, the Index increased 12 percent compared with the previous week. The seasonally adjusted Purchase Index increased 7 percent from one week earlier. The unadjusted Purchase Index increased 8 percent compared with the previous week and was 4 percent higher than the same week one year ago.

The Refinance Index increased 16 percent from the previous week and was 90 percent higher than the same week one year ago.

Mortgage rates declined for the sixth consecutive week, with the 30-year fixed rate dropping to 6.67 percent, the lowest level since October 2024. As a result, applications increased over the week and were up 31 percent from a year ago.
Turnover speeds are arisin’!

Trump inherited a brittle economy from “The Fool” Joe Biden. And it is shown up.
The Trump Administration is fighting the remnants of Biden’s policies by cutting spending (DOGE) and deregulation.
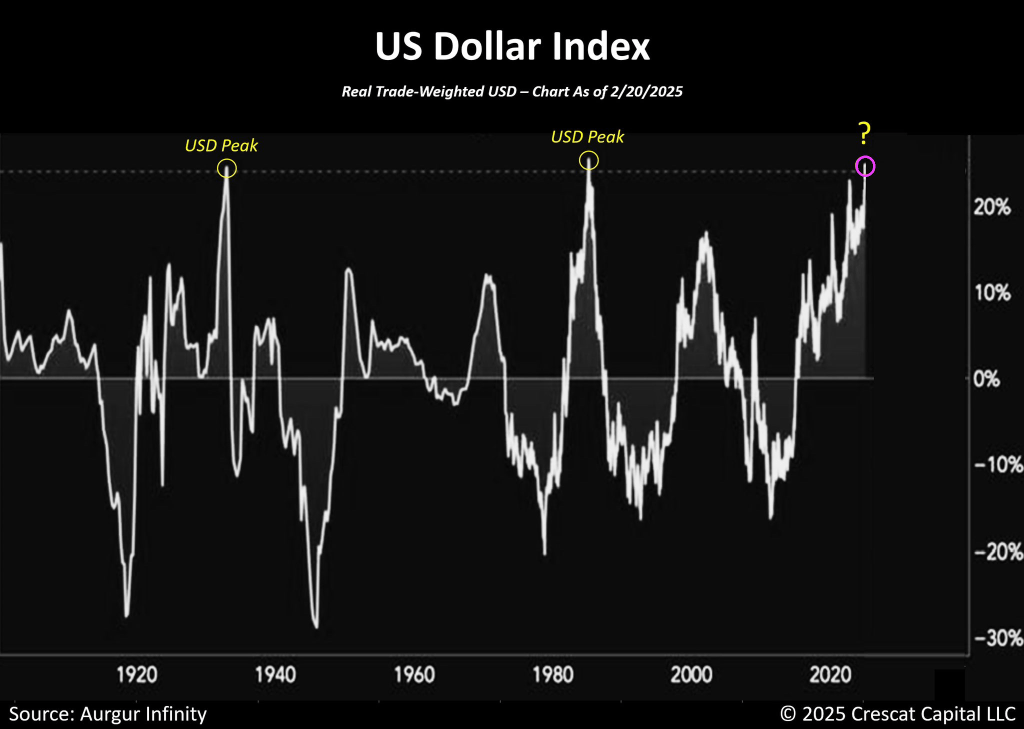
All this has resulted in a soaring US Dollar.
Tarot cards have officially renamed “The Fool” card as “The Biden.” Although in Washington DC, there is no shortage of fools (see Maxine Waters (D-CA) and Rashida Talib (D-MI).

We are now seeing the aftermath of Biden’s failed, top-down, Soviet-style economic policies (or follicies). And it is grim. Bidenomics is now fully exposed like The Fully Month. Except this is The Full Joe!
The GDPNow model estimate for real GDP growth (seasonally adjusted annual rate) in the first quarter of 2025 is -1.5 percent on February 28, down from 2.3 percent on February 19. After recent releases from the US Bureau of Economic Analysis and the US Census Bureau, the nowcast of the contribution of net exports to first-quarter real GDP growth fell from -0.41 percentage points to -3.70 percentage points while the nowcast of first-quarter real personal consumption expenditures growth fell from 2.3 percent to 1.3 percent.

Another sign of Biden’s failed, top-down cronynomics is housing. Pending home sales fell to 70.6.

Little did we know that Biden’s falling on Air Force One’s stairs was symbolic of what was to come.
High housing prices, high commodity prices, high interest rates. All thanks to Biden’s horrible top-down economic policies. Its as is Biden was humming “I’m going to take prices higher” while he was President.
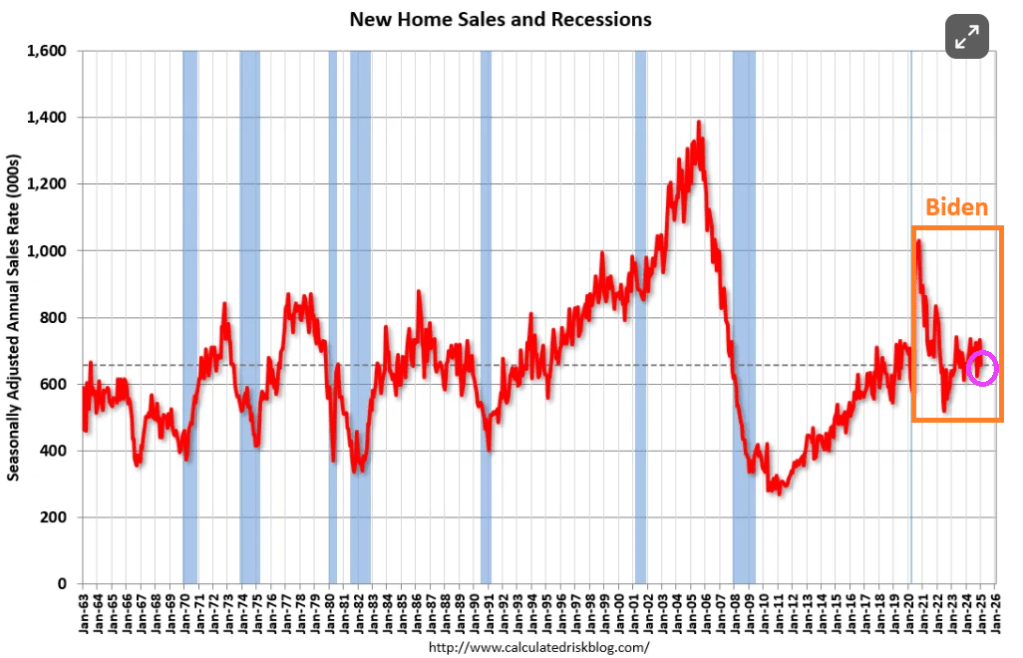
Sales of new single-family houses in January 2025 were at a seasonally adjusted annual rate of 657,000, according to estimates released jointly today by the U.S. Census Bureau and the Department of Housing and Urban Development. This is 10.5 percent below the revised December rate of 734,000 and is 1.1 percent below the January 2024 estimate of 664,000.

You must be logged in to post a comment.