Housing Prices! Chicago Leads All Major Markets With 5.8% Annual Gain (Followed By New York At 5.0% And Cleveland At 4.1%, Tampa Recorded 4.2% Decline)

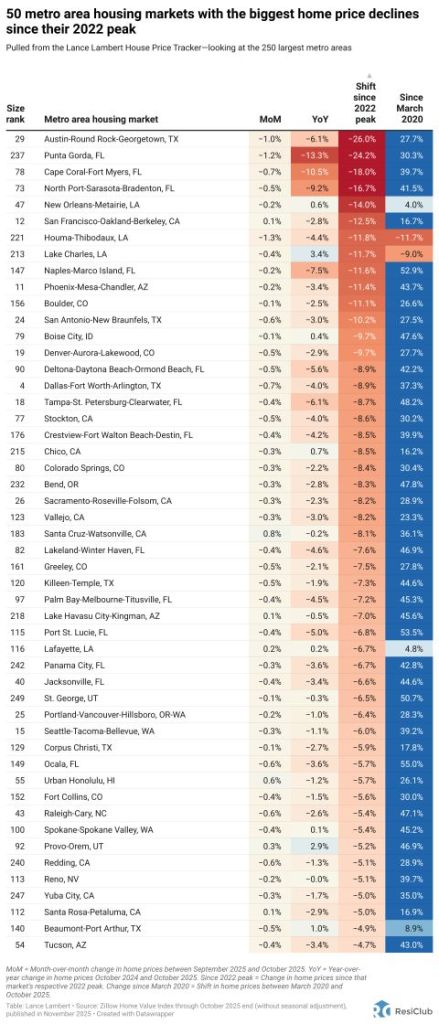
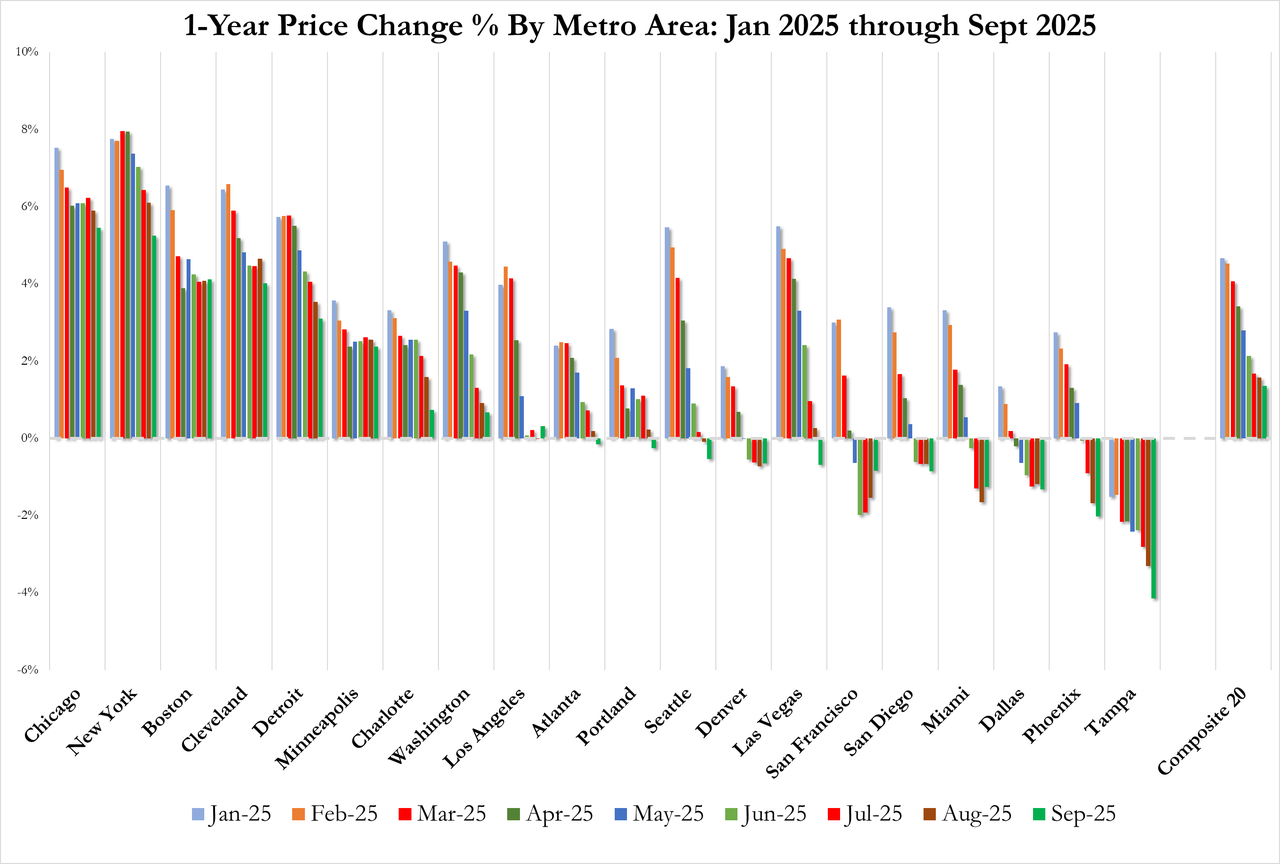
This is the opposite of the housing bubble from The Big Short where home prices in Phoenix, Las Vegas, Los Angeles and Florida rose then crashed. Instead, the fastest growing cities are in the northeast and midwest.

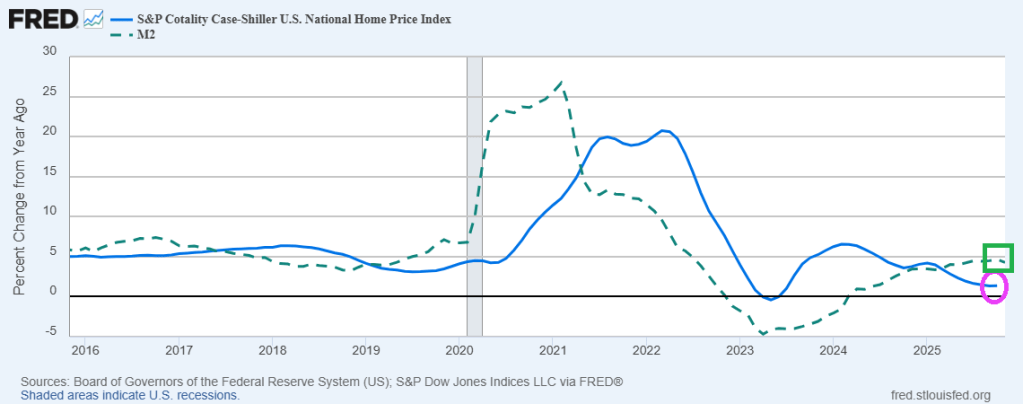
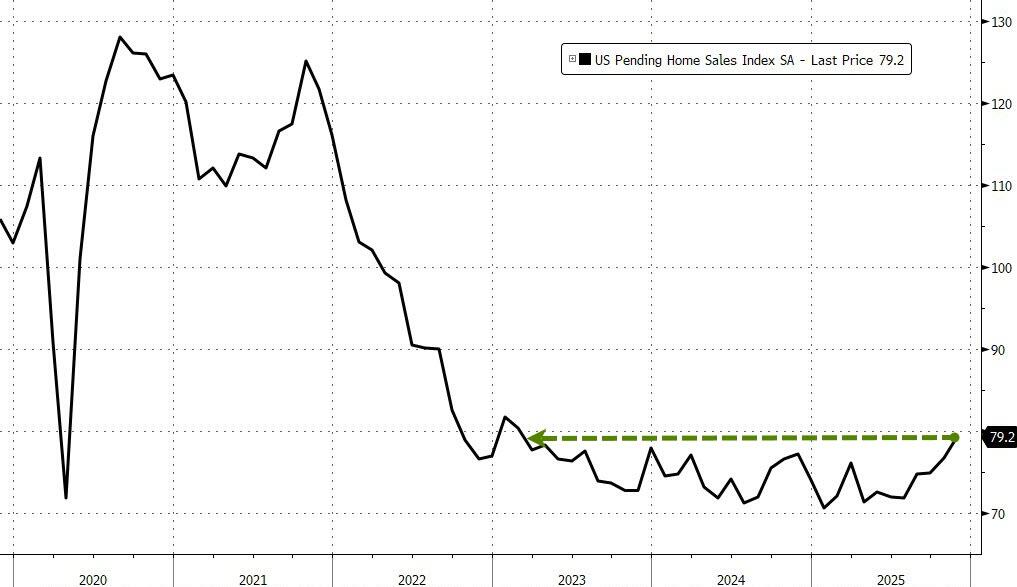
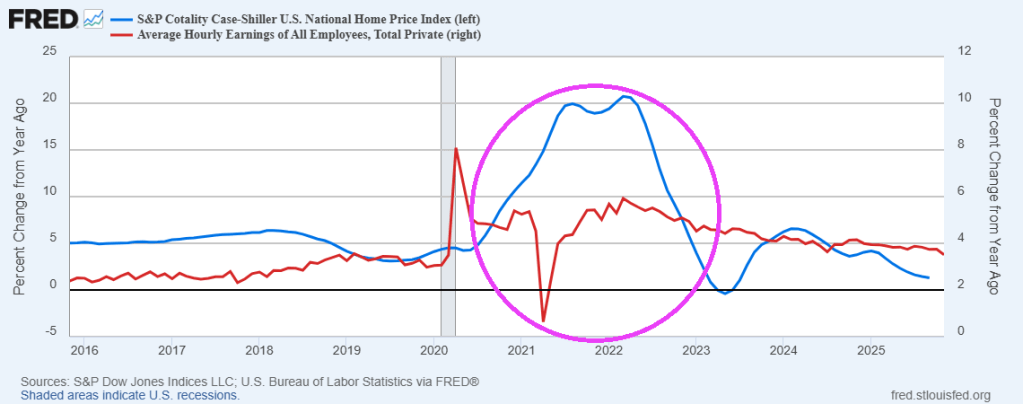
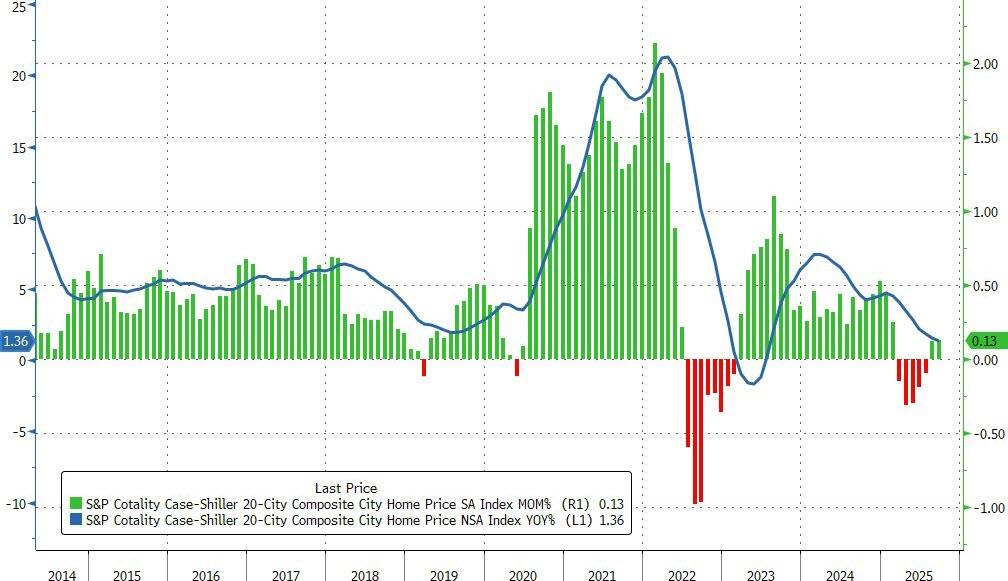
The Case-Shiller 20-City Home Price Index rose 1.3% year over year in October 2025, easing from a 1.4% increase in September and coming in slightly above market expectations of a 1.1% gain. This represents the smallest annual increase since July 2023, reinforcing signs that the US housing market is settling into a much slower growth phase. Home price appreciation continues to trail consumer inflation. With October CPI estimated at around 3.1%, inflation-adjusted home values appear to have edged modestly lower over the past year.

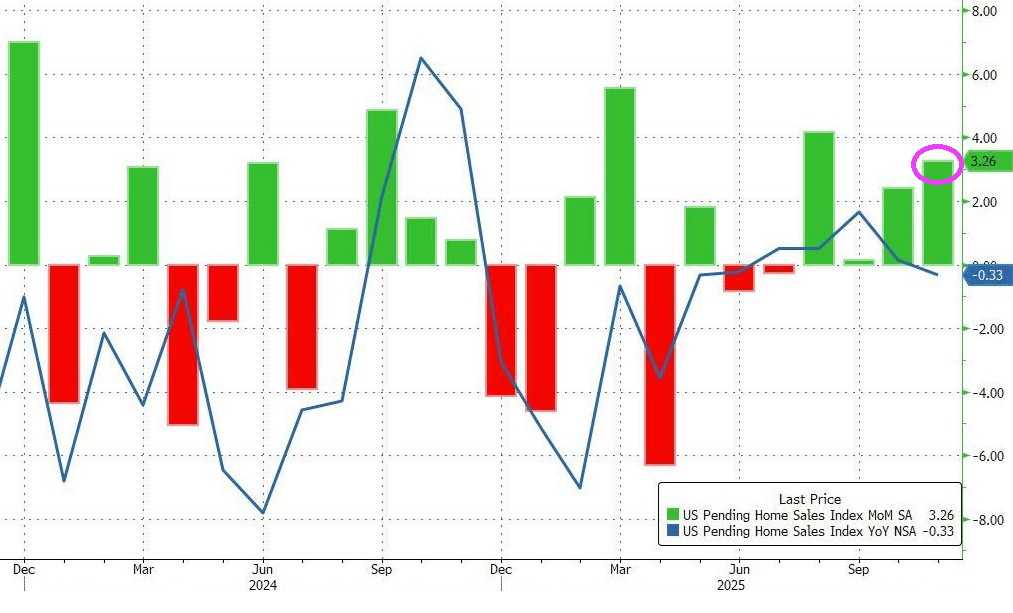
Regional data point to a pronounced geographic rotation. Chicago now leads all major markets with a 5.8% annual gain, followed by New York at 5.0% and Cleveland at 4.1%. In contrast, Tampa recorded a 4.2% decline, the steepest among the 20 cities, and its 12th consecutive month of falling annual prices. Other former pandemic boom markets, especially in the Sun Belt, are seeing the sharpest declines, led by Phoenix (-1.5%), Dallas (-1.5%), and Miami (-1.1%).

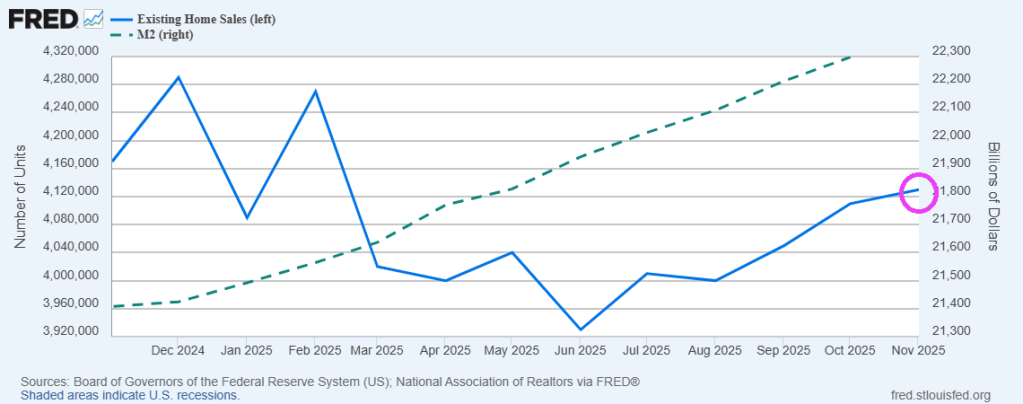
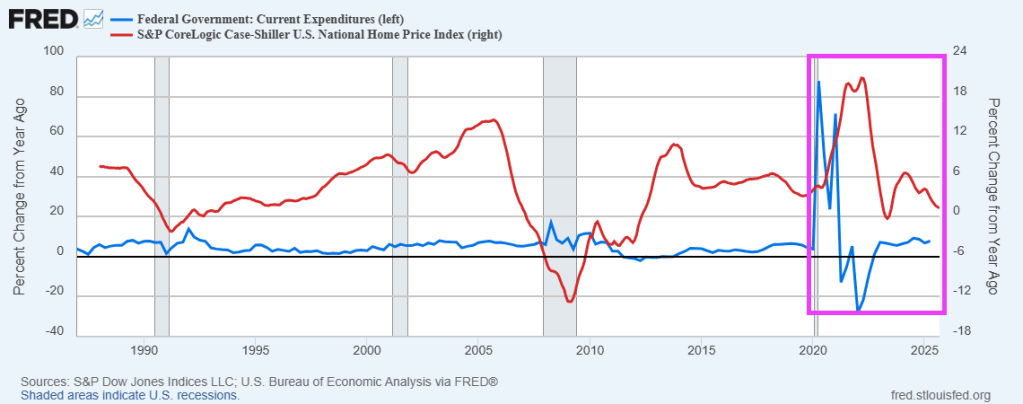
Housing price growth has stalled even though M2 money growth is higher YoY.

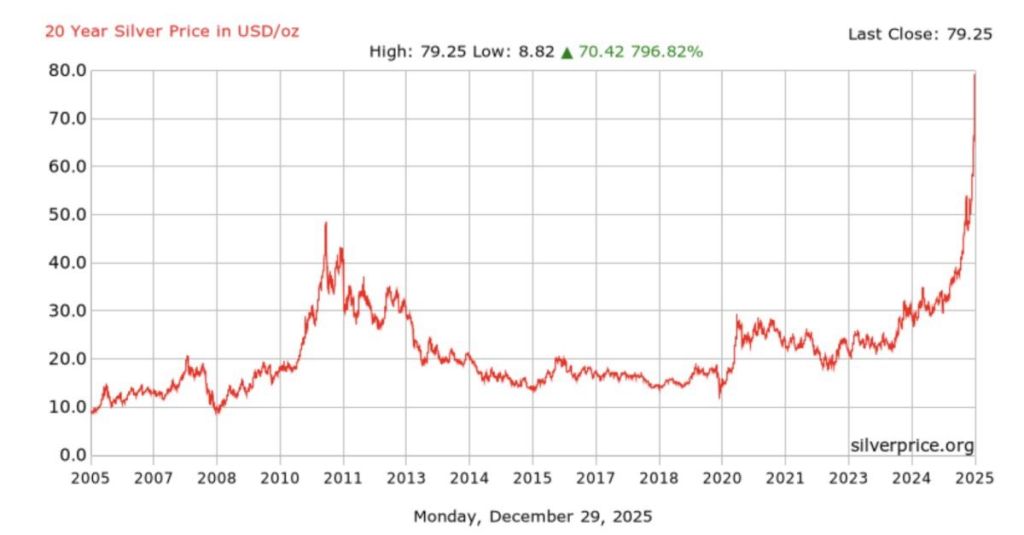
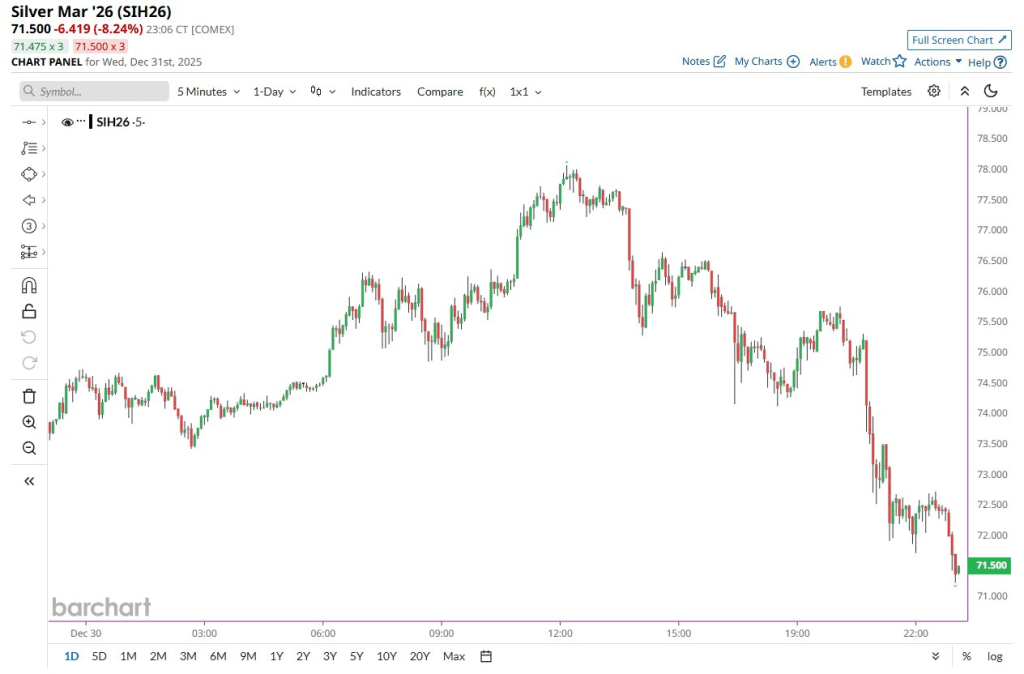
On the silver front, silver regained losses yesterday, but increased margin requirements are causing losses again.

Today.

Housing Thunder? Pending Home Sales Surge 3.3% MoM (Highest Since Feb 2023)

Housing thunder? Or housing lightning!

Pending sales of existing homes in the US surged 3.3% MoM (more than the expected 0.9% MoM move) in November as a modest improvement in prices and mortgage rates encouraged buyers.

The gain was broad-based across regions and exceeded all but one estimate in a Bloomberg survey of economists, but left the YoY change in sales somewhat stagnant on an NSA basis.

Signings have now increased for four straight months, matching a streak seen during the frenzied housing market of the pandemic.

The trade association’s report on Monday showed contract signings rose in each US region last month to their highest levels of the year. The West posted the largest increase, followed by the South, the nation’s largest home-selling region.

November’s surge dragged the Pending Home Sales Index to its highest since Feb 2023

Bloomberg reports that the recent data point to the gradual improvement many economists see for the housing market into 2026.

Mortgage rates that were close to 7% in May have since settled in the 6.3% to 6.4% range, and home prices are growing at a much slower rate compared to last year.

That’s helped fuel small gains in contract closings in recent months. However, economists and industry experts have widely different expectations for next year.

In a recent survey of nine market analysts, estimates for the home resale market ranged from 1.7% to 14% sales growth, with the rosiest projection coming from NAR’s Yun.

Pending-homes sales tend to be a leading indicator for previously owned homes, as houses typically go under contract a month or two before they’re sold.

Mortgage Demand Decreased 5.0 Percent From One Week Earlier (Purchase Index Decreased 6 Percent, Refinance Index Decreased 6 Percent)

Twas the end of the year and mortgage demand is poor, but the new year is just around the corner and mortgage demand will rise.

Mortgage applications decreased 5.0 percent from one week earlier, according to data from the Mortgage Bankers Association’s (MBA) Weekly Mortgage Applications Survey for the week ending December 19, 2025.

The Market Composite Index, a measure of mortgage loan application volume, decreased 5.0 percent on a seasonally adjusted basis from one week earlier. On an unadjusted basis, the Index decreased 6 percent compared with the previous week. The seasonally adjusted Purchase Index decreased 4 percent from one week earlier. The unadjusted Purchase Index decreased 6 percent compared with the previous week and was 16 percent higher than the same week one year ago.

The Refinance Index decreased 6 percent from the previous week and was 110 percent higher than the same week one year ago.

Overall mortgage application volume fell last week, despite the slight decline in mortgage rates. I expect the trends of a softening job market, sticky inflation, elevated home inventories, and steady mortgage rates will persist into the new year.

Simply Unaffordable? A Different View Of US Housing Prices (Gov’t Needs To Stop Manipulating The Housing Market)

Politicians love to scream about housing being simply unaffordable. Like mayor-elected Mandami in New York City. But the reality is that housing prices vary by city and there are more affordable cities than New York City to choose from. Federal policies should not be focused on letting people staying a particular city.

When we look at housing prices compared to average hourly earnings, we see housing prices rising with average hourly earnings … as expected.

If we look at year-over-year changes, we see the Covid bump in housing prices corresponding with the surge in Federal spending. But things have simmered down since the bump in 2020-2023.

My suggestion is for the Federal government to stop interfering in the housing market.

US Treasury Yield Curve Steepens As 30Y Mortgage Rate Hovers Around 6.30% (Existing Home Sales Rise 0.5% In November)

Housing price growth has slowed due to high housing prices caused, in part, by Covid-era Federal spending.

Not helping is The Federal Reserve, helping to keeps rates relatively high. The US Treasury yield curve is steepening.

While 30-year mortgage rates hover around 6.30%.

Existing home sales rose 0.5% in November.

And as The Fed keeps on printing money (M2), we will see existing home sales increase.

Hallelujah! Mortgage Demand Increased 4.8% From Previous Week (Purchase Demand Increased 32%, Refi Demand Increased 14%)

Hallelujah, I love this economy so! Of course, former First Lady Jill Biden is on the national tour trashing the economy saying it was “perfect” under Joe Biden.

Mortgage applications increased 4.8 percent from one week earlier, according to data from the Mortgage Bankers Association’s (MBA) Weekly Mortgage Applications Survey for the week ending December 5, 2025. Last week’s results included an adjustment for the Thanksgiving holiday.

The Market Composite Index, a measure of mortgage loan application volume, increased 4.8 percent on a seasonally adjusted basis from one week earlier. On an unadjusted basis, the Index increased 49 percent compared with the previous week. The seasonally adjusted Purchase Index decreased 2 percent from one week earlier. The unadjusted Purchase Index increased 32 percent compared with the previous week and was 19 percent higher than the same week one year ago.

The Refinance Index increased 14 percent from the previous week and was 88 percent higher than the same week one year ago.

Compared to the prior week’s data, which included an adjustment for the Thanksgiving holiday, mortgage application activity increased last week, driven by an uptick in refinance applications,” said Joel Kan, MBA’s Vice President and Deputy Chief Economist. “Conventional refinance applications were up almost 8 percent and government refinances were up 24 percent as the FHA rate dipped to its lowest level since September 2024. Conventional purchase applications were down for the week, but there was a 5 percent increase in FHA purchase applications as prospective homebuyers continue to seek lower downpayment loans. Overall purchase applications continued to run ahead of 2024’s pace as broader housing inventory and affordability conditions improve gradually.

The average contract interest rate for 30-year fixed-rate mortgages with conforming loan balances ($806,500 or less) increased to 6.33 percent from 6.32 percent, with points increasing to 0.60 from 0.58 (including the origination fee) for 80 percent loan-to-value ratio (LTV) loans.

Little Tariff Effects! US Q3 Real GDP Growth At 3.5%, Real Estate Construction Growth Remains Negative

The US economy is goin’ home! The hysteria about tariffs is nonexistant.

Latest estimate: 3.5 percent — December 05, 2025

The GDPNow model estimate for real GDP growth (seasonally adjusted annual rate) in the third quarter of 2025 is 3.5 percent on December 5, down from 3.8 percent on December 4. After this morning’s personal income and outlays release from the US Bureau of Economic Analysis, the nowcast for third-quarter real personal consumption expenditures growth declined from 3.1 percent to 2.7 percent.

Unfortunately, residential and non-residential construction are negative as are imports.

Since The Federal Government Spending Spree Associated With Covid Ended, Median Household Income Has Declined, But So Have Home Prices

Roll out the barrel! As in Fed money printing.

How can the current housing disaster be fixed? One answer is to build more homes (made difficult by local government zoning and building policies). Another is increase household income. But Fed money printing is the easiest way to increase home prices.

Since the Federal government spending spree associated with Covid ended, median household income has declined. But so have home prices.

But in terms of home price growth compared to median household income, you can see that home price growth has slowed after the Covid spending spike, but so did median household income.

Pray that The Fed doesn’t resort to trying to fix the housing market. They will only make things worse.

US Mortgage Demand Increased Slightly In Recent Survey (Hasn’t Been The Same Since 2021)

According to the Mortgage Bankers Association weekly survey,

The Market Composite Index, a measure of mortgage loan application volume, increased 0.2 percent on a seasonally adjusted basis from one week earlier.  On an unadjusted basis, the Index decreased 2 percent compared with the previous week.  The seasonally adjusted Purchase Index increased 8 percent from one week earlier. The unadjusted Purchase Index increased 2 percent compared with the previous week and was 20 percent higher than the same week one year ago.

The Refinance Index decreased 6 percent from the previous week and was 117 percent higher than the same week one year ago.

The refinance share of mortgage activity decreased to 53.4 percent of total applications from 55.4 percent the previous week. The adjustable-rate mortgage (ARM) share of activity increased to 7.9 percent of total applications.

The FHA share of total applications decreased to 18.8 percent from 19.9 percent the week prior. The VA share of total applications increased to 15.4 percent from 15.2 percent the week prior. The USDA share of total applications increased to 0.4 percent from 0.3 percent the week prior.

The average contract interest rate for 30-year fixed-rate mortgages with conforming loan balances ($806,500 or less) increased to 6.40 percent from 6.37 percent, with points decreasing to 0.60 from 0.62 (including the origination fee) for 80 percent loan-to-value ratio (LTV) loans.  The effective rate increased from last week.

But mortgage demand hasn’t been the same is 2021. Rates are higher, mortgage demand is lower. Higher home prices coupled with higher mortgage rates is bad news.

US Home Prices Are Falling In A Majority Of US Cities (Immigration?)

The good news / bad news for immigration enforcement is that home prices are declining as immigration enforcement keeps rolling. Good news for new homebuyers. Bad news for recent homeowners.

US home prices in the 20 largest cities rose 0.13% MoM in September (very slightly better than the 0.1% rise expected) and up for the second month in a row (after falling for five straight months before). This MoM rise left the average priers up just 1.36% YoY – the lowest since July 2023.

Source: Bloomberg

Declining mortgage rates suggest a rebound in aggregate prices could be looming…

Regional performance reveals a tale of two markets.

Chicago continues to lead with a 5.5% annual gain, followed by New York at 5.2% and Boston at 4.1%. These Northeastern and Midwestern metros have sustained momentum even as broader market conditions soften.

At the opposite extreme, Tampa posted a 4.1% annual decline – the sharpest drop among tracked metros and its 11th consecutive month of negative annual returns. Phoenix (-2.0%), Dallas (-1.3%), and Miami (-1.3%) likewise remained in negative territory, highlighting particular weakness in Sun Belt markets that experienced the most dramatic pandemic-era price surges.

Home Prices are now falling (YoY) in a majority (11/20) of America’s largest cities…

“The geographic rotation is striking,” said Nicholas Godec, CFA, CAIA, CIPM, Head of Fixed Income Tradables & Commodities at S&P Dow Jones Indices.

Meanwhile, traditionally stable metros in the Northeast and Midwest continue to post solid gains, suggesting a reversion to prepandemic patterns where job markets and urban fundamentals drive appreciation rather than migration trends and remote-work dynamics.”

Markets that were pandemic darlings—particularly in Florida, Arizona, and Texas—are now experiencing outright price declines.

And don’t forget the surge in home prices associated with increased M2 money printing around Covid.