Stay with the mortgage market! It is improving under Trump after a disastrous run under Biden.

But for last week, mortgage applications increased 9.2 percent from one week earlier, according to data from the Mortgage Bankers Association’s (MBA) Weekly Mortgage Applications Survey for the week ending September 5, 2025. This week’s results include an adjustment for the Labor Day holiday.
The Market Composite Index, a measure of mortgage loan application volume, increased 9.2 percent on a seasonally adjusted basis from one week earlier. On an unadjusted basis, the Index decreased 3 percent compared with the previous week. The seasonally adjusted Purchase Index increased 7 percent from one week earlier. The unadjusted Purchase Index decreased 6 percent compared with the previous week and was 23 percent higher than the same week one year ago.

The Refinance Index increased 12 percent from the previous week and was 34 percent higher than the same week one year ago.

The holiday-adjusted refinance index had its strongest week in a year and the average loan size for refinances also increased significantly, since borrowers with large loans are more sensitive to bigger rate moves. Refinance applications accounted for almost 49 percent of all applications last week.
…
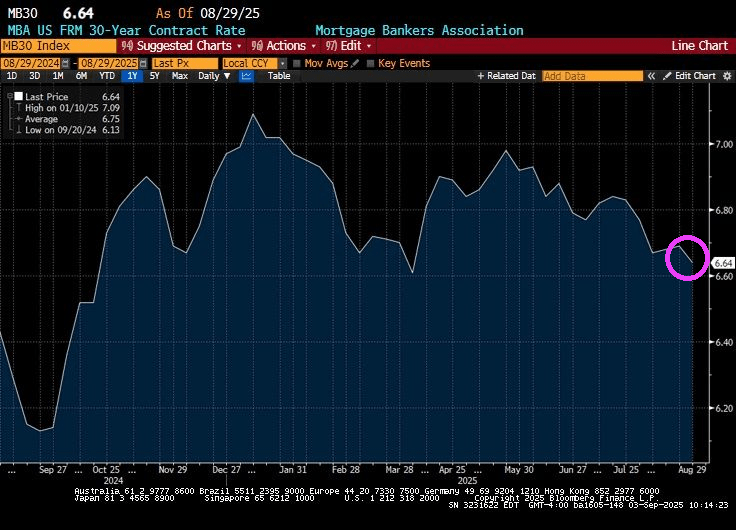
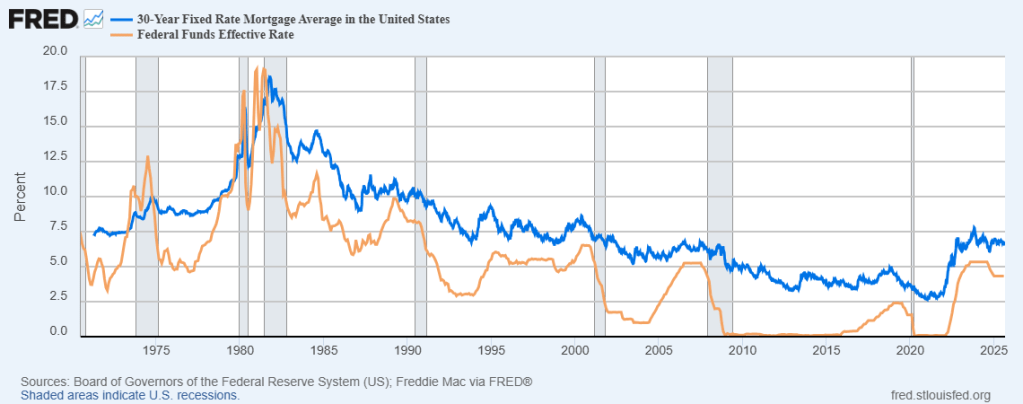
The average contract interest rate for 30-year fixed-rate mortgages with conforming loan balances ($806,500 or less) decreased to 6.49 percent from 6.64 percent, with points decreasing to 0.56 from 0.59 (including the origination fee) for 80 percent loan-to-value ratio (LTV) loans.


You must be logged in to post a comment.