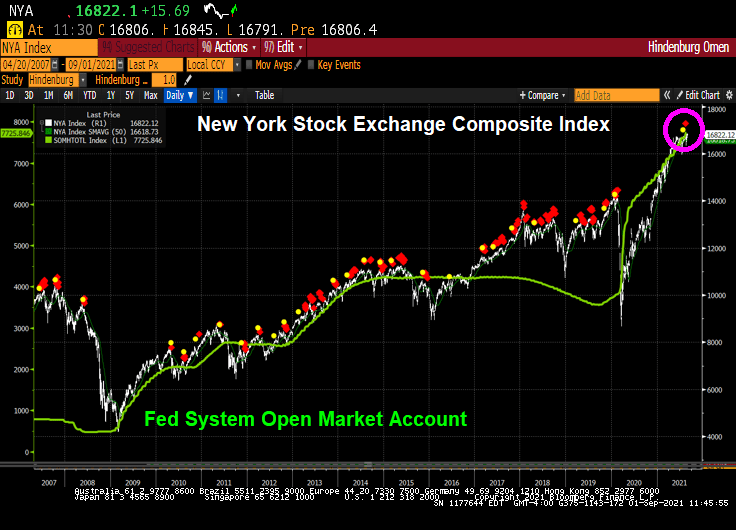
Well, the US stock market is raging along with Federal Reserve monetary stimulus, Federal government fiscal stimulus and a roaring economy.
A note of caution: the Hindenburg Omen chart is flashing … again. It forecast the stock market crash of 2008, but growing monetary stimulus from The Federal Reserve (green line) has helped prevent another correction.
The Shiller CAPE ratio is signalling a correction just like the Hindenburg Omen.
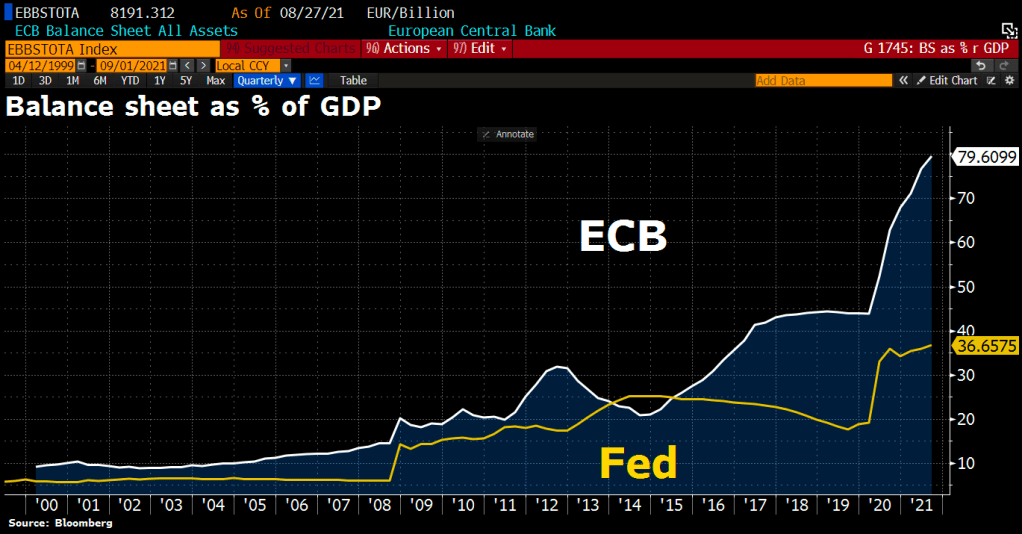
But Fed Chair Powell and Treasury Secretary Yellen along with our free-spending Congress and Administration have nothing on Europe where the ECB’s balance sheet is a whopping 79.51% of European Union GDP! The Fed’s balance sheet is “only” 36.66% of US GDP.
Here is the SS Powellenburg cruising over Wall Street.
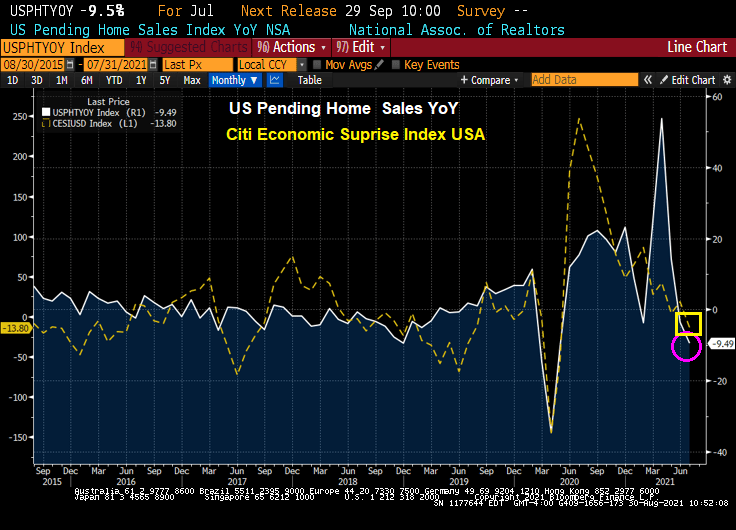
Even though home prices are skyrocketing (Case-Shiller 20 up 19% YoY in June), mortgage purchase applications are not growing at the speed of home price growth. Some of it is the rise in the S&P 500 and other stock market indices allowing some to pay cash for a home (30% according to Redfin).
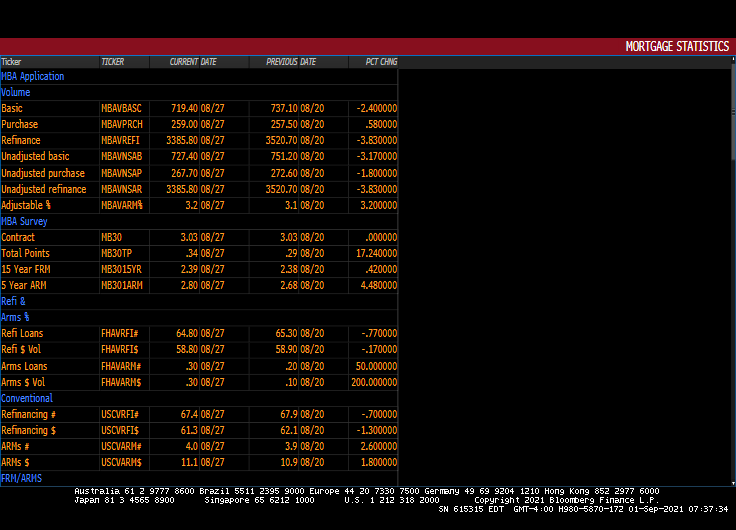
Mortgage applications decreased 2.4 percent from one week earlier, according to data from the Mortgage Bankers Association’s (MBA) Weekly Mortgage Applications Survey for the week ending August 27, 2021.
The Refinance Index decreased 4 percent from the previous week and was 2 percent higher than the same week one year ago. The seasonally adjusted Purchase Index increased 1 percent from one week earlier.
The unadjusted Purchase Index decreased 2 percent compared with the previous week and was 16 percent lower than the same week one year ago.
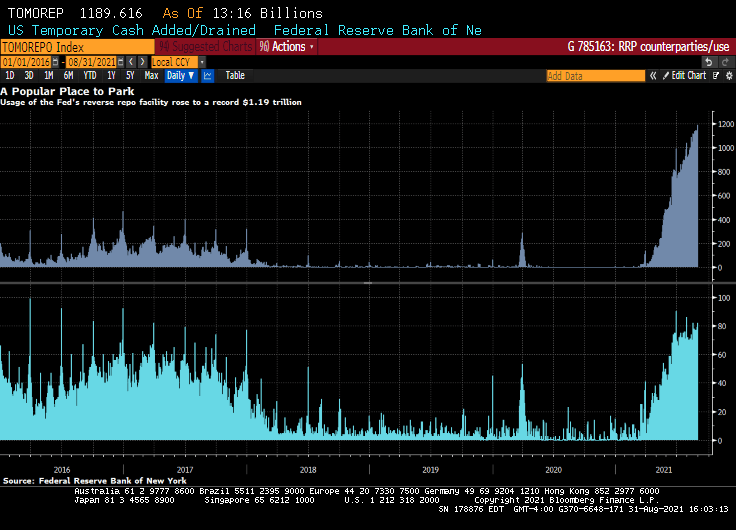
The glut of cash in U.S. interest-rate markets pushed the amount of money that investors are parking at a major central bank facility to yet another all-time high.
Eighty-two participants on Tuesday placed $1.19 trillion at the Federal Reserve’s overnight reverse repurchase agreement facility, in which counterparties like money-market funds can place cash with the central bank. That surpassed the previous record volume of $1.147 trillion from Aug. 25, New York Fed data show.
While usage is expected to recede on Wednesday since its the beginning of a new month, demand will eventually move higher as the deluge shows few signs of slowing.
The Fed’s ongoing asset purchases and Treasury’s drawdown of its cash balance are pushing more reserves into the system, causing liquidity to swell. These growing imbalances in front end markets have helped keep downward pressure on short-end rates, raising the likelihood that RRP usage will rise further.
In anticipation of the cash surge distorting funding markets, Federal Reserve policy makers this year have taken a series of steps to increase the capacity of the RRP, including boosting its per counterparty limits to $80 billion each, and adjusting the criteria to make the facility more accessible to more money funds. It even raised its administered rates at its June gathering by 5 basis points to help support the smooth functioning of short-term funding markets.
Home prices are now growing at 4.75x hourly earnings growth. And existing home sales inventory remains low by historic standards.
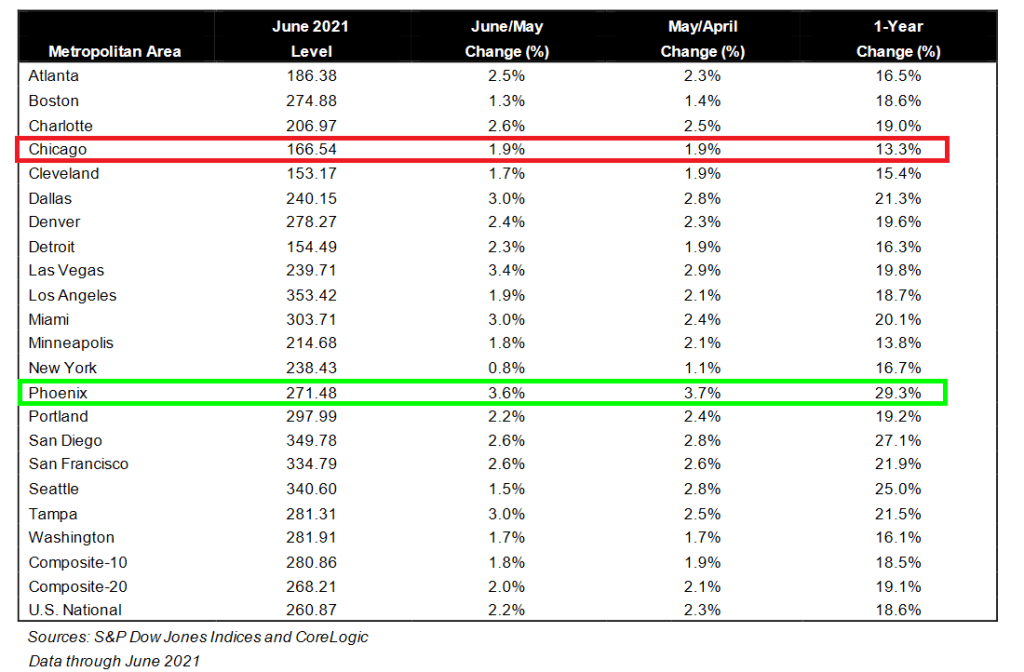
All of the Case-Shiller metro areas were above 13% with Phoenix, AZ leading at 29.3% YoY. The slowest growing metro area is Chicago, IL at 13.3%.
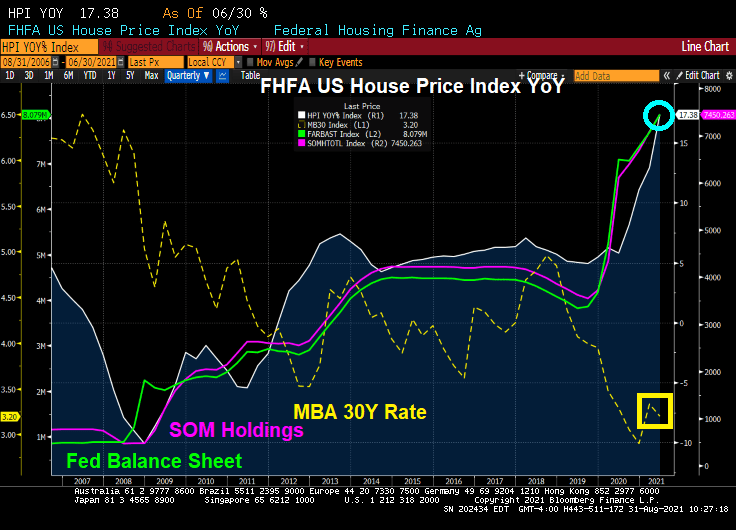
The FHFA’s house price growth hit 17.38% YoY in June. Mortgage rates being low and Fed’s Balance Sheet and The Fed’s System Open Market Holdings sky-high.
Are Fed Chair Jerome Powell and The Fed Board of Governors the Gods of Hellfire?
At the annual Jackson Hole (aka, J-Hole) Economic Symposium, Federal Reserve Chairman Jerome Powell reiterated that the Fed is in no hurry to either taper asset purchases immediately or aggressively. Additionally he made crystal clear that even when the Fed does eventually start tapering asset purchases (likely November or December), it should not be taken as signaling interest rate hikes will follow on some preset course. Indeed, Fed Chairman Powell continues to claim that inflation is transitory. Finally, he said that part of the mandate (employment) is still far from being achieved. So, expect more SNAKE JUICE.
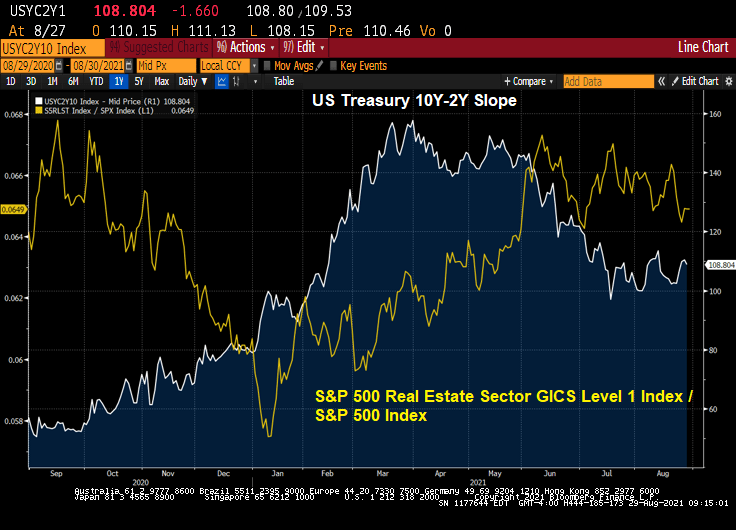
The shape of the yield curve has been highly influential recently in relative performance trends between various areas of the market. From last summer through May of this year, the steepening of the yield curve coincided with healthy outperformance of cyclical stocks. Since May, the flattening of the curve has coincided with more defensive (or at least high quality) leadership out of the tech and health care sectors. The logic goes, therefore, that a re-steepening of the curve should coincide with a shift back to cyclicals. Indeed, that shift may be in the early innings.
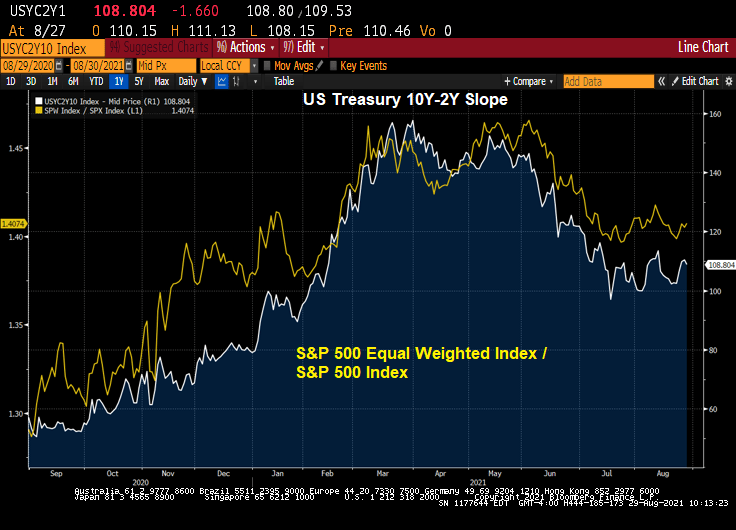
Let’s take a look at the US Treasury 10Y-2Y curve slope over the past twelve months against the Citi Economic Surprise Index for the US. You can see curve fatigue starting in April 2021 as the Citi Economic Surprise Index turns negative.
The the more cyclical and smaller skewed S&P 500 equal weight index has started to outperform the S&P 500 again, right on queue with the yield curve re-steepening.
Industrial stocks are under-performing the broader S&P 500 index as the curve flattens.
Real estate stocks? They are outperforming the broader S&P 500 index.
Mining stocks like gold mines? They are underperforming the broader S&P 500 index.
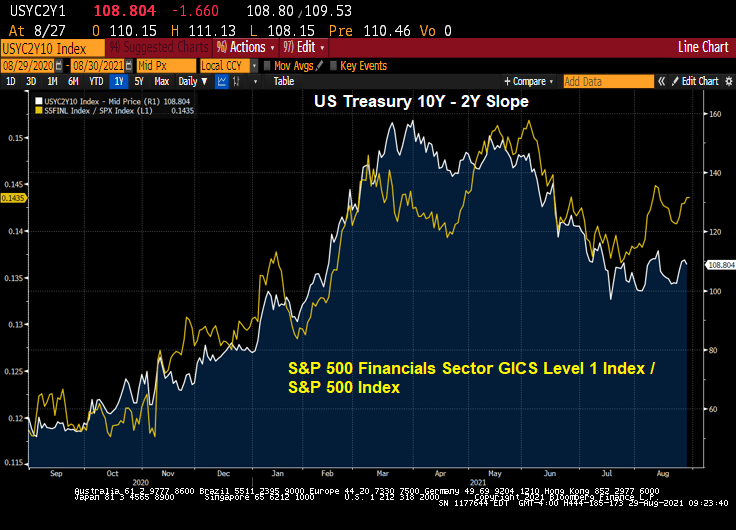
Financial stocks? Not surprisingly, The Fed’s dovish behavior is causing financial stocks to outperform the broader S&P index.
Likewise, information technology stocks are outperforming the broader S&P 500 index.
So, by Powell delaying any balance sheet slowdown and rate increases, we have clear winners (real estate, financials, information tech) and clear losers on a relative basis (industrials, retail, metals and mining).
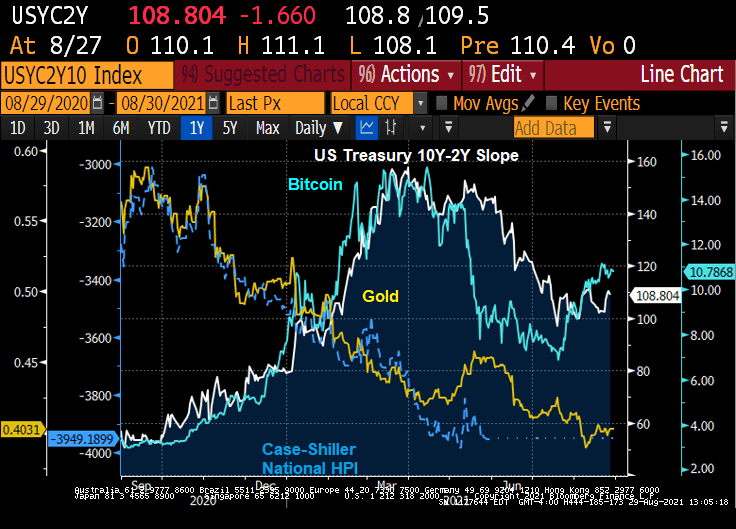
The Others! Due to volatility differences, I wouldn’t over-interpret this chart. But Bitcoin as a ratio of the S&P 500 index is “kicking ass!” Gold and housing as a ratio of the S&P 500 index seemingly can’t keep up with the S&P 500 index.
W. Scott Frame, Brian Greene, Cindy Hull and Joshua Zorsky August 26, 2021
The Federal Reserve quickly responded to significant financial market disruption at the onset of the COVID-19 pandemic in March 2020, providing stability in a variety of ways. This included large-scale purchases of U.S. Treasuries and agency mortgage-backed securities (MBS).
While market functioning improved in the subsequent months, the central bank has continued purchasing these assets to maintain smooth functioning as well as to help foster accommodative financial conditions. We explore the Federal Reserve’s purchases of agency MBS—mortgage bonds guaranteed by Ginnie Mae, Fannie Mae and Freddie Mac—and related market dynamics during the pandemic, including why mortgage rates fell to historic lows.
Agency MBS and Mortgage Prepayment
The market for agency MBS is among the largest fixed-income markets in the world ($7.6 trillion) and acts as the benchmark for pricing fixed-rate home mortgages eligible for agency guarantees.
These securities distribute monthly principal and interest payments due on underlying mortgages to investors. While agency MBS investors are shielded from credit risk by government guarantees, they do face prepayment risk.
Homeowners with fixed-rate mortgages make principal and interest payments each month based on a predetermined amortization schedule. However, the borrower has the option to pay down additional mortgage principal at any time. (This usually occurs when the borrower refinances the loan or sells the home.) The initial value of this prepayment option is reflected in the borrowers’ mortgage interest rate and is passed through to the agency MBS investor.
Large declines in mortgage rates can result in a sizeable swath of fixed-rate mortgage borrowers with refinancing options “in-the-money.” When this happens, there is an expectation of a rapid decline in existing higher coupon-rate agency MBS balances due to prepayments and a corresponding increase in the issuance of new securities with lower coupon rates.
Evolution of Federal Reserve Policy and Purchases
As the pandemic’s economic impact unfolded, the Federal Open Market Committee (FOMC) announced on March 15, 2020, it would increase agency MBS holdings by at least $200 billion, plus reinvest all principal payments received. This directive was amended a week later to uncap purchases.
The FOMC modified its approach at its June 2020 meeting, increasing agency MBS holdings to around $40 billion per month plus reinvestments, a policy that remains in place. (More information on FOMC directives during 2020 is summarized in the Federal Reserve Bank of New York’s Annual Report on Open Market Operations.) From March 2020 through June 2021, the Federal Reserve increased its agency MBS holdings from $1.4 trillion to $2.3 trillion.
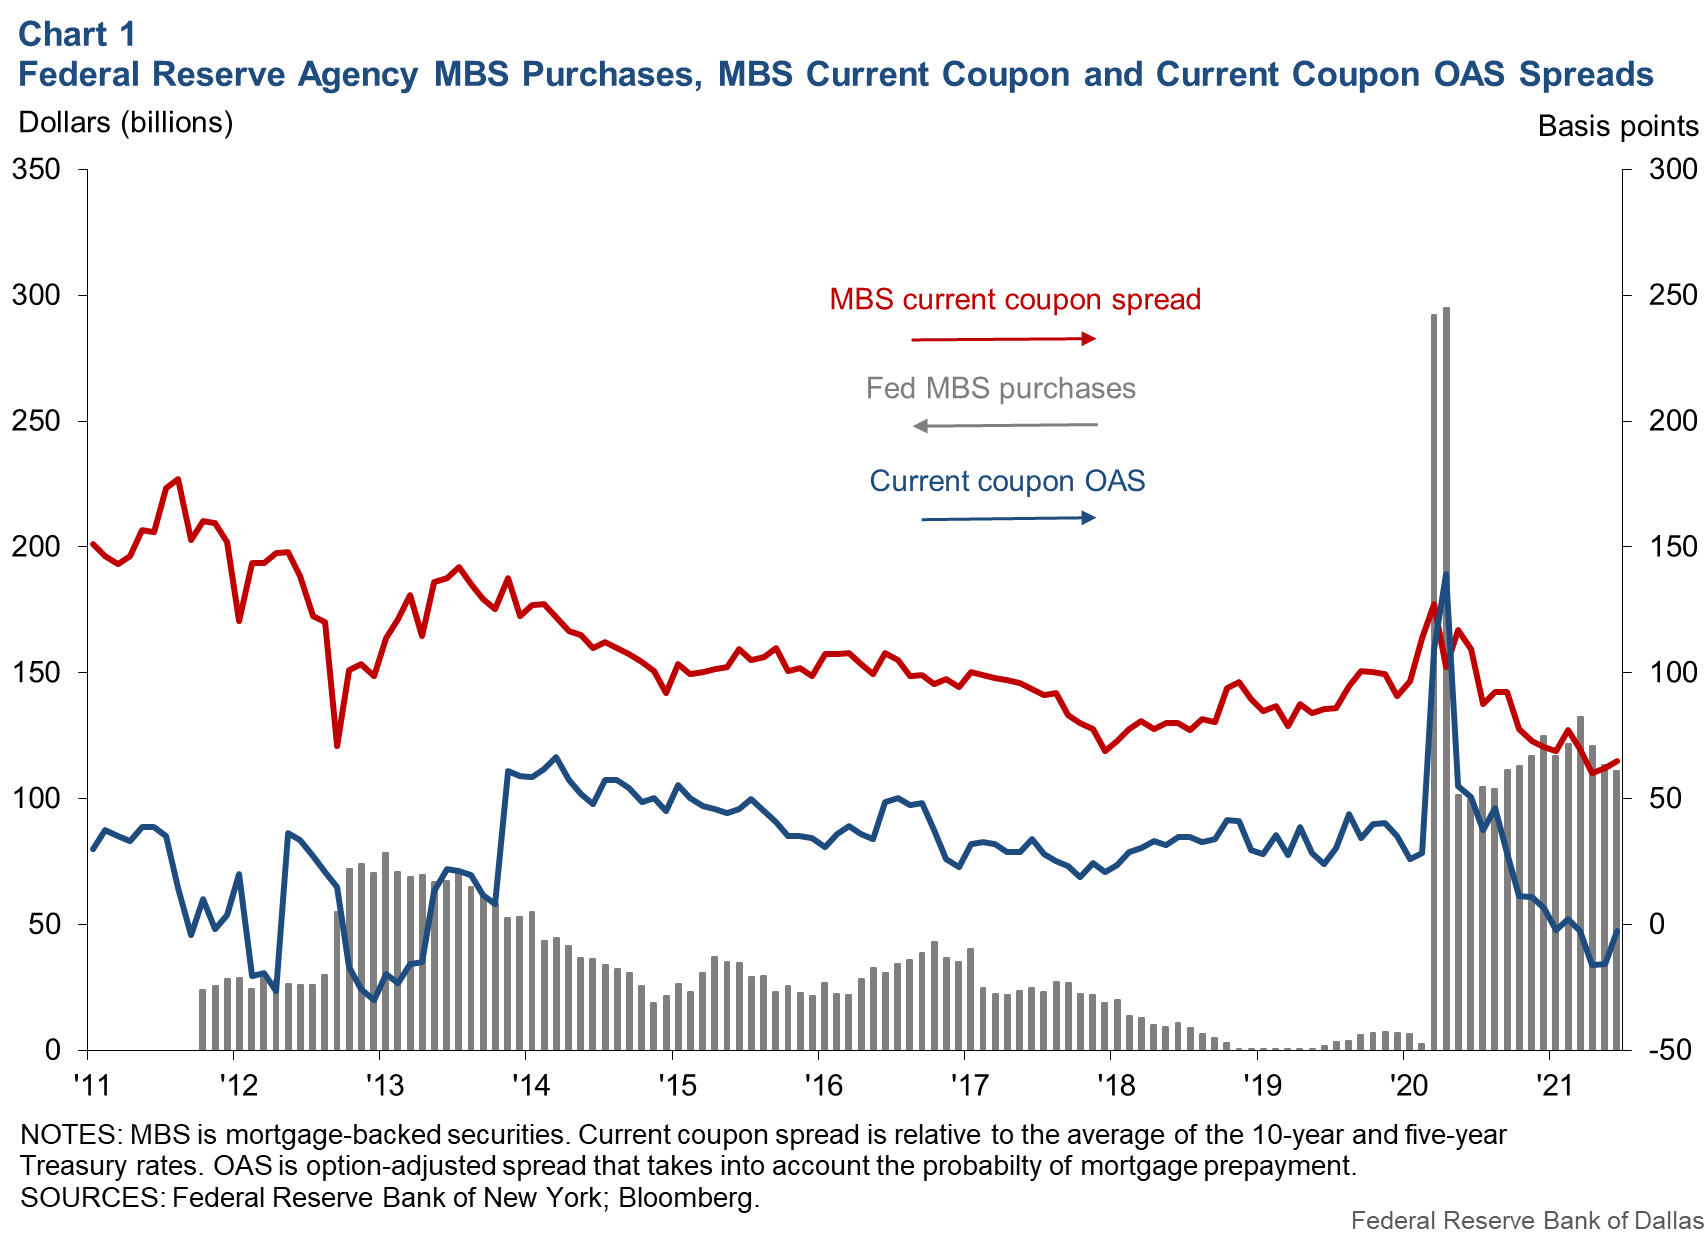
Chart 1 presents the Federal Reserve’s monthly gross purchases of agency MBS over the past decade and the MBS current coupon spread, or the yield consistent with a par value security, less the average of the five-year and 10-year Treasury yields.
The central bank purchased a total $580 billion in agency MBS during the two-month period of March–April 2020, and since has averaged about $114 billion per month including reinvestment of principal payments. During this time, the current coupon spread has steadily narrowed to its tightest levels in almost a decade (62 basis points, or 0.62 percentage points, in May 2021). Primary mortgage rates have similarly fallen during this time, according to Freddie Mac survey data.
Chart 1 also includes a metric known as the current coupon option-adjusted spread (OAS), which includes the likelihood of homeowners prepaying mortgages due to changes in interest rates. The OAS is a derived risk premium that equates model-based agency MBS values (using simulations of future interest rate paths) to prices observed in the market. By accounting for interest rate variability, OAS reflects the residual compensation earned by agency MBS holders arising from noninterest-rate factors, such as the characteristics of the underlying mortgages.
While OAS is typically positive, the measure shown here—produced by Bloomberg for a hypothetical MBS priced at par—has declined steadily since March 2020 and turned negative for the first time since 2013, the only other time in the series history that this has occurred.
Taken together, the data in Chart 1 suggest that the Federal Reserve’s recent large-scale purchases of agency MBS have contributed to historically tight spreads in the secondary market.
Federal Reserve Purchases Agency MBS in Forward Market
The Federal Reserve purchases agency MBS in the to-be-announced (TBA) market, a large and liquid forward market with contracts that settle once per month based on a calendar set by the Securities Industry and Financial Market Association. The central bank typically targets its purchases on the most widely traded coupons for settlement in the following month. This is done through prescheduled auctions conducted throughout the month.
Given the forward-settling nature of the market, the volume of TBA contracts sold for a particular settlement month may not match supply available for delivery when the settlement date arrives.
To manage this mismatch and to avoid delivery failures, market participants engage in “dollar roll” transactions. A dollar roll involves the simultaneous sale (purchase) of a TBA contract for one settlement month and purchase (sale) of a TBA contract for an adjacent month. In this way, a dollar roll allows market participants to delay (bring forward) settlement of TBA contracts. The cost of this trade is reflected by the price difference between TBA contracts settling in adjacent months.
When the price of the front-month TBA becomes greater than the fair value of holding that security over the next month, it is said to be trading “special.” This may be an indication of an expected collateral shortage for the month’s settlement. Dollar roll specialness can subside if the price signal entices market participants to deliver additional collateral into the TBA market for delivery.
Federal Reserve’s Dollar Roll Sales Activity
The Federal Reserve conducts dollar rolls to aid settlement of its TBA purchases if there is a notable level of specialness. The timing and volume of these transactions depend on an internal assessment of market conditions and movements in implied financing rates.
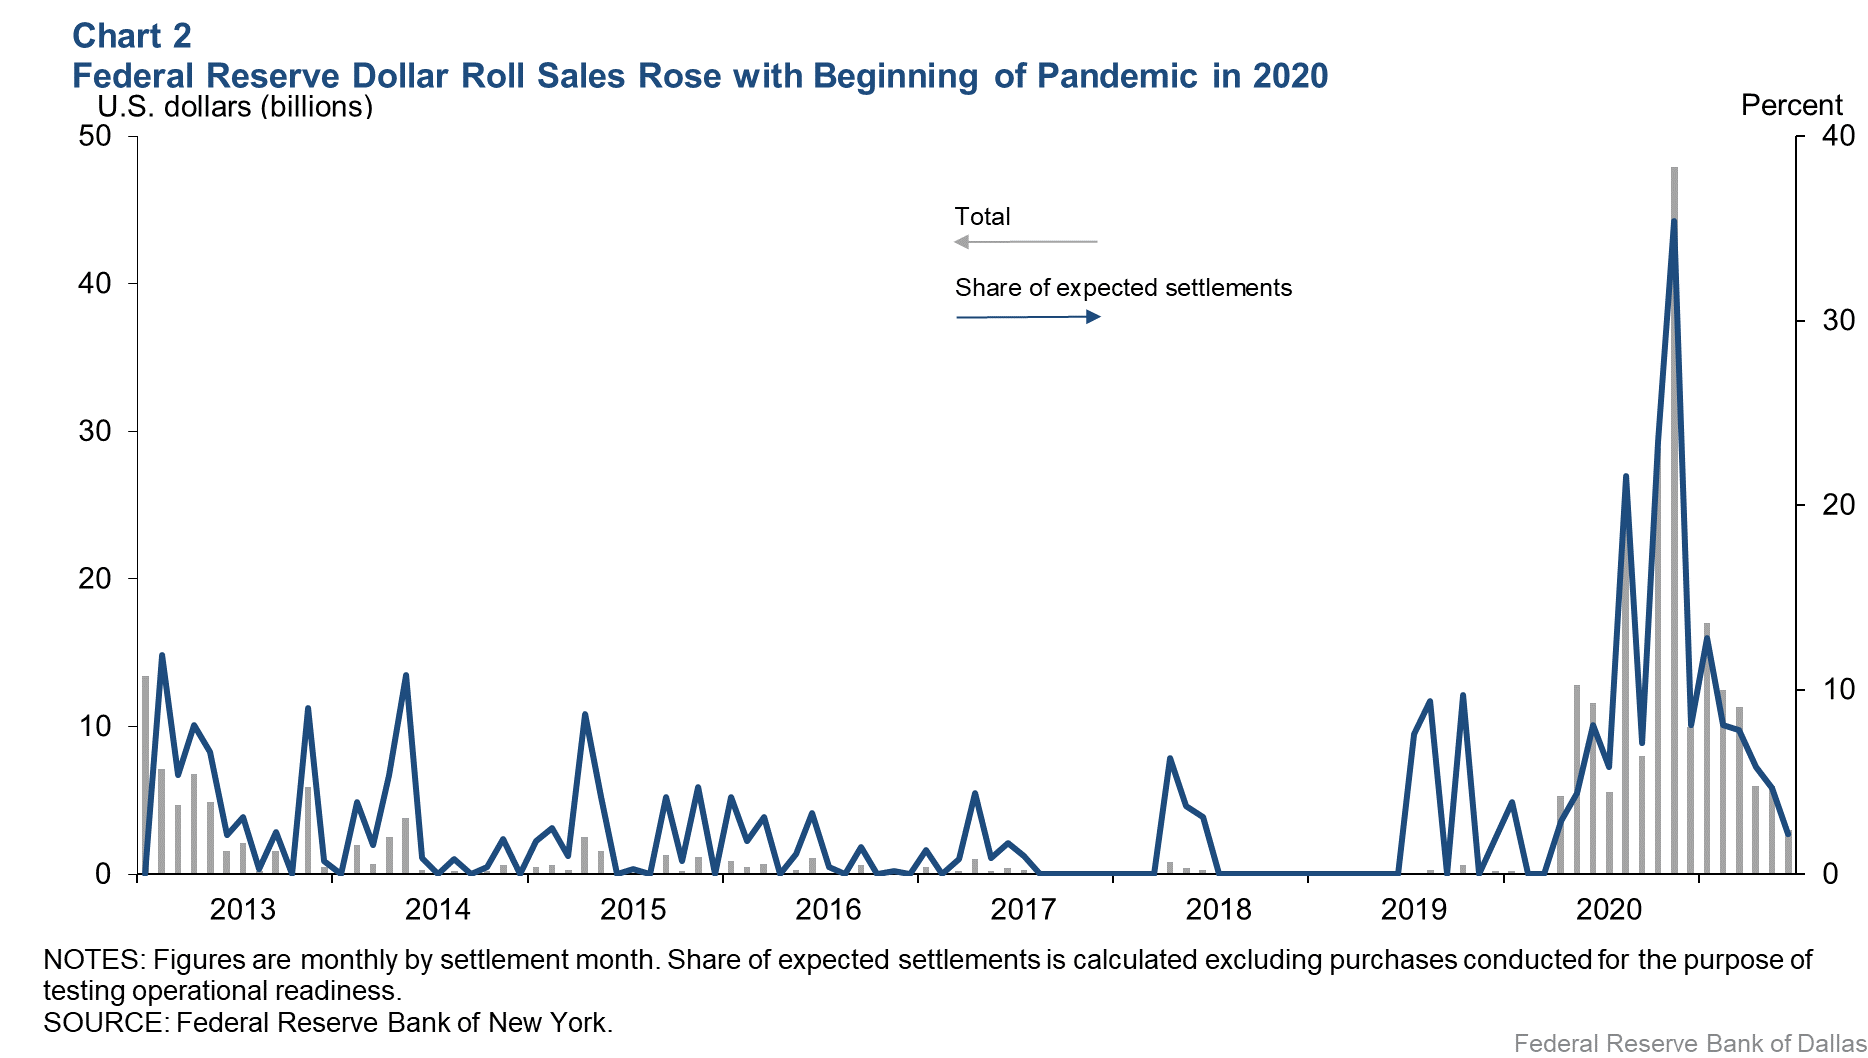
Chart 2 shows the Federal Reserve’s monthly dollar roll sales since the start of 2013 and their share of the month’s expected settlements. Expected settlements are the sum of the regular, planned purchase ($40 billion), principal reinvestments from the prior months’ paydowns and TBA contracts already held for that month’s settlement from previous dollar rolls. The central bank has consistently engaged in dollar roll transactions since April 2020, reaching a peak of $48 billion in November 2020.
The Chart 2 data beg the question of why the Federal Reserve conducted so many dollar roll sales. There are a few explanations.
First, the FOMC’s directive for monthly agency MBS purchases resulted in the central bank acquiring almost 40 percent of newly issued securities since May 2020. Moreover, the Federal Reserve’s TBA purchases were for settlement in the near month, although mortgage originators were often selling TBAs into back months. This created a timing mismatch. In response, the central bank purchased near-month TBAs from dealers, which were then often rolled for back-month settlement.
Second, commercial banks represent the only other investor base that increased its agency MBS holdings during 2020 and through first quarter 2021 ($580 billion). But banks tend not to conduct dollar roll transactions to delay settlement, owing to the nature of their business operations and accounting considerations.
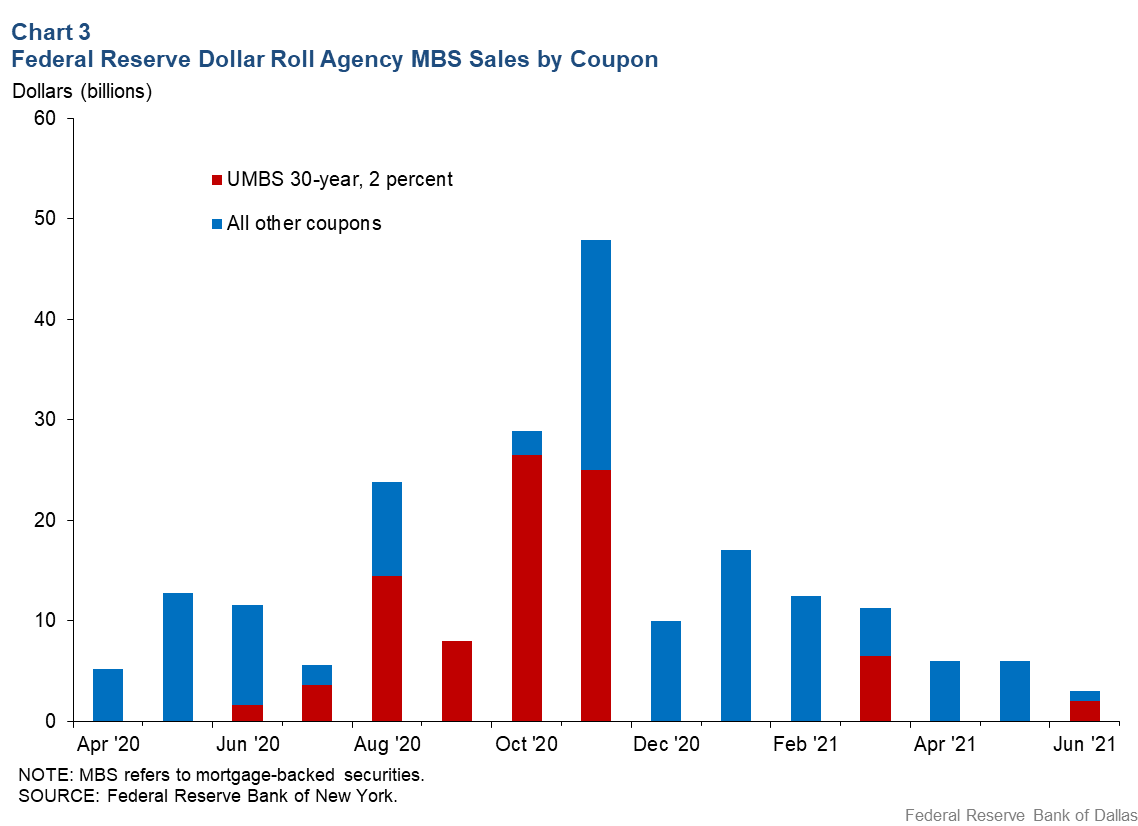
Third, the sharp decline in mortgage rates led to periods of collateral scarcity for lower coupon securities. The Fannie Mae or Freddie Mac Uniform MBS (UMBS) 30-year, 2 percent coupon provides a useful example. During the summer of 2020, mortgage originators sold the majority of TBAs forward into these securities. However, the outstanding stock of UMBS 30-year, 2 percent coupons was modest, thus limiting the ability of existing securities to be delivered for settlement. As the outstanding stock of UMBS 30-year, 2 percent securities increased, the Federal Reserve’s roll activity in the coupon declined commensurately.
Aside from the UMBS 30-year, 2 percent coupon, the Federal Reserve conducted dollar roll sales in eight other securities. This indicates that specialness was more widespread at times, although the rolling of these other coupons was more sporadic. Chart 3 presents the volume of Federal Reserve dollar roll sales for the UMBS 30-year, 2 percent coupon relative to all other TBA contracts.
The Federal Reserve’s large-scale purchases of agency MBS have likely contributed to dollar roll specialness over the course of the current purchase program. The central bank has responded by using dollar roll sales to extend the settlement of some of its TBA purchases into the future.
Tight Spreads, Low Mortgage Rates
In response to the pandemic, the Federal Reserve restarted its large-scale purchases of agency MBS and now holds more than $2.3 trillion, representing almost 30 percent of outstanding bonds. These purchases have been associated with historically tight spreads in that market, which have translated into historically low mortgage rates.
Because of periodic supply shortages, the Federal Reserve has smoothed purchases using dollar roll sales that extend settlement into the future and aid market functioning.
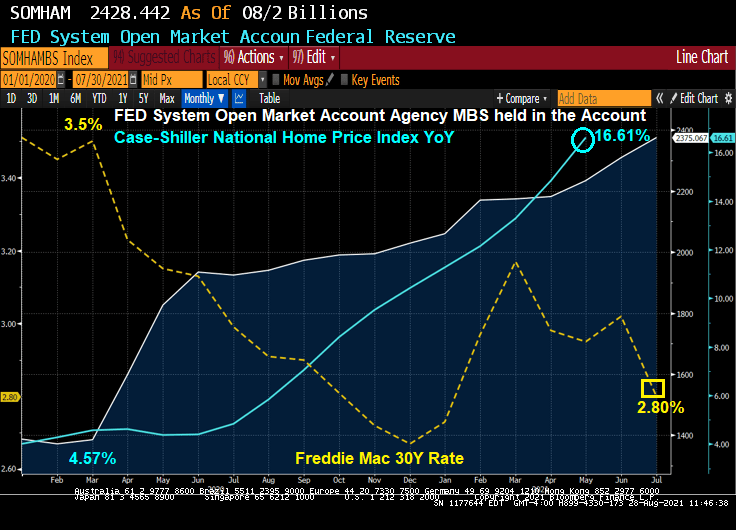
Here is the chart that The Fed Folk left out. Home price growth pre-Covid Fed surge in Agency MBS purchases was 4.57% YoY with a 30-year mortgage rate of 3.5%. The most recent Case-Shiller HPI growth rate was 16.61% and the latest Freddie Mac 30-year mortgage rate is 2.80%.
So while The Federal Reserve calmed the savage beast (mortgage markets), they also contributed to bubble-like growth in home prices.
Well, I was expecting a little more guidance than Fed Chair Powell gave today at the J-Hole conference. In fact, failing to give a hard date on paring back the balance sheet and raising rates is downright dovish. A regrettable incident.
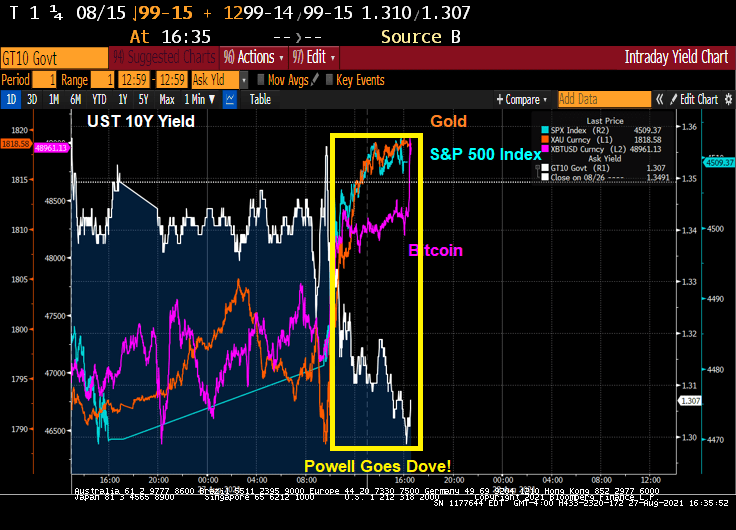
As a result of Powell’s dovish talk, GOLD, BITCOIN and the S&P500 index rose.
The S&P 500 index rose almost 1% today while the 10Y Treasury yield dropped 4 bps.
Federal Reserve Chair Jerome Powell said the central bank could begin reducing its monthly bond purchases this year, though it won’t be in a hurry to begin raising interest rates thereafter.
That is COULD, not WOULD.
At the Fed’s most recent policy meeting in late July, “I was of the view, as were most participants, that if the economy evolved broadly as anticipated, it could be appropriate to start reducing the pace of asset purchases this year,” Powell said.
“The intervening month has brought more progress in the form of a strong employment report for July, but also the further spread of the delta variant,” he said. “We will be carefully assessing incoming data and the evolving risks.”
At the July Federal Open Market Committee meeting, most Fed officials agreed it would probably be appropriate to begin tapering the central bank’s $120-billion-a-month bond-buying program before the end of the year, according to a record of the gathering. Some are pushing for a move as soon as next month.
Monetary policy makers would like to conclude the purchases before officials begin raising interest rates, and several in June saw a possible need for rate increases as early as 2022 amid inflation that is running above the central bank’s 2% target. The Fed cut its benchmark rate to nearly zero and relaunched the crisis-era purchase program last year at the onset of the pandemic.
To quote the hunter from Jurassic Park, “Clever girl.” Rather than announce a hard taper and rate increase, Powell just hinted at a taper and rate increase.
Here is a photo of Fed Chair Powell being watched by Wall Street.
Fed’s Favorite Inflation Measure Surges At Fastest Pace In 30 Years As Spending, Incomes Rise!
Federal Reserve Chairman Mao Powell will be speaking at 10am EST in his virtual Jackson Hole KC Fed Conference speech. He might actually save his blockbuster comments for the next Fed meeting, instead just hinting at what The Fed might do to reduce the behemoth monetary stimulus. After all, The Fed has already slowed the growth rate of M2 Money to 12.1% YoY.
But before Chairman Mao Powell speaks, the PCE deflator numbers were released this AM showing that the PCE Deflator YoY rose to 4.2%. For households for a fixed income, this is bad news unless they receive a COLA (not a Pepsi, but a cost-of-living adjustment).
I would be remiss if I left out the largest assets for most households: housing. The Case-Shiller National Home Price Index is rising at a 16.6% YoY pace, making housing more expensive for those who are currently renting.
Speaking of which, the US Supreme Court overturned the Biden Administrations rent moratorium meaning that renters can be evicted for failure to make rent payments. (This sounds cut and dry, but the ability of landlords to evict non-paying rents varies from state-to-state and county-to-county).
Having said that, we can see that Personal Spending only grew by 0.3% in July while REAL personal spending fell by -0.1%.
Personal income grew by 1.1% in July and 2.7% YoY , which is lower than the PCE Deflator YoY of 4.2%.
University of Michigan sentiment is out at 10AM EST. Stay tuned!


You must be logged in to post a comment.