Here is Biden/Harrisnomics in one chart! Treasury (interest) payments are growing faster than other government outlays and a larger than the entire Defense outlays. Leading outlays include Medicare/Medicaid and Social Security.
Here is Treasury Secretary Janet Yellen symbolically gorging on a foot-long sub. No one spends like unelected government bureaucrats!
Here is a breakdown of the annual cost of regulations:
And “China” Kamala (ChiKam) plans even MORE regulations!
Federal regulation’s total compliance costs and economic effects are at least $2.117 trillion annually in Ten Thousand Commandments’ estimate, and almost certainly higher.
An October 2023 National Association of Manufacturers (NAM) report models regulatory compliance at $3.079 trillion annually.
US households pay on average $15,788 annually in a hidden regulatory tax, which consumes 17 percent of income and 22 percent of household expenses.
These outlays exceed expenditures on health care, food, transportation, entertainment, apparel, services, and savings. Only the costs of housing, which stand at $24,298 annually, exceed regulation.
The higher NAM figure implies $22,962 per household, or 31 percent of the household expense budget.
The regulatory tax of $2.117 trillion rivals individual income tax costs estimated at $2.328 trillion for 2023 and stands at nearly four times the corporate income tax of $546 billion.
The NAM cost figure of $3.1 trillion annually would exceed the sum of both ($2.9 trillion).
If it were a country, US regulation would be the world’s 10th-largest economy, ranking behind Canada and ahead of Italy.
If we exclude the US economy from the list, the US regulation economy would be the ninth largest, still behind Canada and ahead of Italy.
The 10.34 billion hours Washington says it took to complete federal paperwork in 2022, according to the Information Collection Budget, translate to the equivalent of 14,883 human lifetimes.
The tally of final rules for 2023 stood at 3,018, which is the second-lowest count since at least 1976.
On the other hand, the Federal Register containing those rules surged to 89,368 pages, the second-highest tally on record and a 12 percent rise over 2022.
Although we have fewer new rules, they appear to be broader in scope.
During calendar year 2023, agencies issued 3,018 rules, whereas Congress enacted 68 laws. Thus, agencies issued 44 rules for every law enacted by Congress.
This Unconstitutionality Index—the ratio of regulations issued by agencies to laws passed by Congress and signed by the president—underlines how much agency lawmaking has replaced that of elected officials. The average ratio over the past 10 years is 23 rules for every law.
Since the Federal Register first began itemizing final rules in 1976, 217,565 have been issued. Since 1993, when the first edition of Ten Thousand Commandments appeared, agencies have issued 120,475 final rules.
A 2023 draft consolidated version of the White House Report to Congress on the Benefits and Costs of Federal Regulations caught up on fiscal years 2020–2022. The report for 2023 has still not been released.
A total of only 31 “major” rules had both benefits and costs quantified, and these add $13 billion to the annual regulatory cost bill; another 56 rules with costs but not benefits quantified add another $46 billion to annual costs.
Employing our lower estimate, regulatory burdens of $2.1 trillion amount to nearly 8 percent of US gross domestic product (GDP), reported by the Commerce Department at $27.36 trillion in 2023.
The NAM regulatory figure implies 11 percent of GDP.
Regulatory costs stand at over 60 percent of the level of corporate pretax profits of $3.523 trillion.
The NAM figure would take that to over 80 percent.
When regulatory costs of $2.1 trillion are combined with federal outlays of $6.135 trillion, the federal government’s share of the $27.36 trillion economy reaches at least 30 percent. State and local spending and regulation add to these costs.
Until April 2023, a subset of each year’s 3,000-plus rules was deemed economically significant, referring to annual economic effects of $100 million or more. Biden’s Executive Order 14094 (“Modernizing Regulatory Review”) eliminated that category and initiated a higher $200 million Section 3(f)(1) Significant category.
In the year-end 2023 edition of the twice-yearly Unified Agenda of Federal Regulatory and Deregulatory Actions, 69 federal departments, agencies, and commissions present 3,599 regulatory actions flowing through the pipeline as follows:
2,524 rules in the active (prerule, proposed, final) phase
431 recently completed rules
644 long-term rules
Of the 3,599 regulations in the fall 2023 Unified Agenda’s pipeline, 304 are Section 3(f)(1) Significant category rules (which implies at least $60 billion in economic impact), as follows:
233 rules in the active (prerule, proposed, final) phase
41 completed rules
30 long-term rules
Despite his own higher $200 million threshold, high-significance rules in the Biden pipeline outnumber the Bush, Obama, and Trump years when the lower $100 million threshold applied.
Major rules as defined in the Congressional Review Act leave a $100 million threshold intact despite Biden’s executive order. The Government Accountability Office database contains 76 finalized major rules for 2023. The Biden average exceeds those of Bush, Obama, and Trump.
Final rules affecting small business appear to be mounting and could generate calls for reform. Biden’s three years have averaged 870 rules annually in the Federal Register affecting small business, compared with 694 and 701 for Obama and Trump, respectively.
Of the 3,599 rules and regulations in the fall 2023 Unified Agenda pipeline, 690 affect small businesses; of those, 370 required an official “regulatory flexibility analysis.”
Biden-era mandates affect state and local governments at heights not seen in over a decade. Rules in the Unified Agenda pipeline affecting state governments stand at 507, while rules affecting local governments stand at 349.
The five most active rule-producing executive branch entities in the Unified Agenda—the departments of the Interior, the Treasury, Transportation, Commerce, and Health and Human Services—account for 1,497 rules, or 42 percent of all rules in the pipeline. The five most active independent agencies account for another 318 rules.
From the nation’s founding through 2022, more than 15,635 executive orders have been issued. Biden issued 24 executive orders in 2023, well below his peak 77 of 2021. Biden’s presidential memoranda continue to outstrip the average of recent predecessors.
Public notices in the Federal Register always exceed 22,000 annually, with uncounted guidance documents and other proclamations that hold potential regulatory effect among them, whereas other guidance documents issued do not appear in the Federal Register at all. In 2023, 23,197 notices were issued. There have been 714,563 public notices since 1994 and over a million since the 1970s.
DC bureaucrats are out of control. Treasury Secretary Yellen calls for $78 TRILLION to tackle climate change. So to quote The Carpenters, they’ve only just begun to regulate.
Yes, here is the original GovTrack assessmment of Kamala Harris’ Senate voting record for 2019, showing her to be the most Marxist member of the US Senate. Her new name is Commala to show her Communist leaning.
I dislike the term “Liberal” since it implies “Liberty”. And she like many Democrats is opposed to liberty.
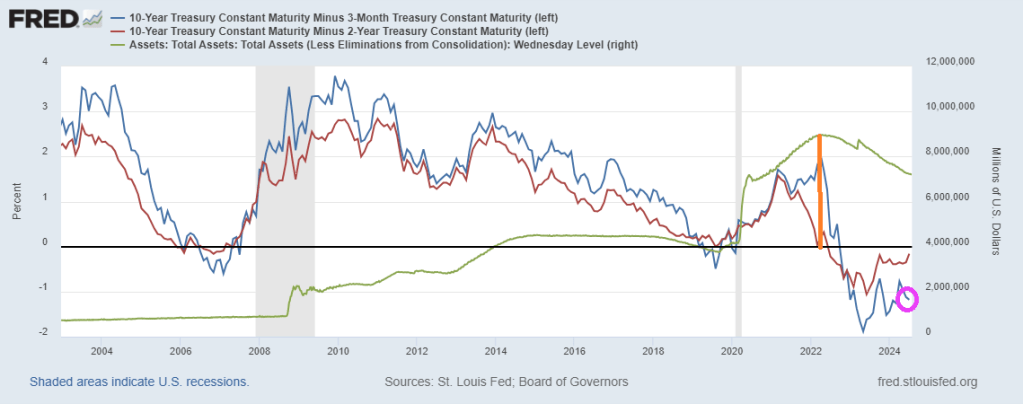
Up until 2022, the US Treasury yield curve behaved normally. In fact, as late as May 6th, 2022, the US Treasury 10Y-3M yield curve was at +227 basis points. Denote by the orange line in the following chart. That date corresponded with peak Fed balance sheet.
Then the massive spending by Biden/Harris/Congress hit the fan and inflation soared. The Fed counter attacked by raising rates and began scaling back their balance sheet. The 10Y-3M yield curve has been negative ever since.
Since the Covid outbreak in early 2020, The Fed went wild with rate cuts and massive and unpredented balance sheet expansion.
Let’s look at The Fed’s puchase of agency MBS and mortgage rates. From 2020 2022, The Fed continued to buy agency MBS. But in 2022, all hell broke loose as The Fed went crazy RAISING rates, but slowly began unwinding their balance sheet. The result? Mortgage rates began to climb. In fact, the US conforming mortgage rate for 30 years has risen 102% since early 2022. The Fed is only slowing unwinding their MBS holdings.
Despite the struggles in the residential housing market, the COMMERCIAL mortgage market is a trainwreck.
This scene from the film “McCabe and Mrs. Miller” sums up our political plight quite nicley. Politicians spend like crazy to stay in power (Biden/Harris) are excellent examples). Politicians promises endless money, then shoot the economy. The US is broke and relies on printing money and boowed funds to stay afloat. Harris wants to raise taxes on everyone to fund her plans like even MORE emphasis of failed green energy schemes and endless foreign wars. I doubt if Harris could defend her spending plans in light of the US already $35 TRILLION in debt.
Even more worrisome if thev fact that DC politicians have promised entitlements (Social Security, Medicare, etc. totalling $217.63 Trillion. Or 623% higher than the rapidly increasing national debt.
Biden/Harris raised thr national debt by 25% in less than 4 years. And Harris wants to increase spending! Harris wants illegal immigrants put on Social Security and Medicare, further bankrupting those entitlement programs.
Let’s see Harris explain her indefensible budget (like raising taxes and not hurting economic growth).
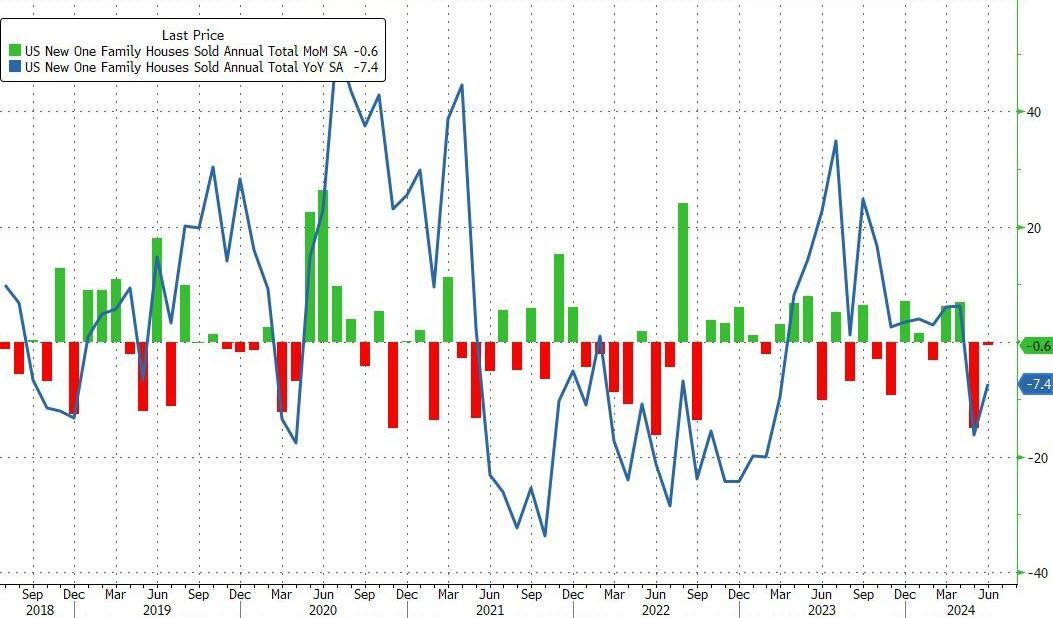
After a disappointing dump in existing home sales in June, new home sales just confirmed the slowdown, dropping 0.6% MoM (notably below the 3.4% MoM expected) and also saw a major downward revision in May from -11.3% MoM to -14.9% MoM. That leaves new home sales down 7.4% YoY…
Source: Bloomberg
That shift dragged the new home sales SAAR down to 617k – basically unchanged since 2016…
Source: Bloomberg
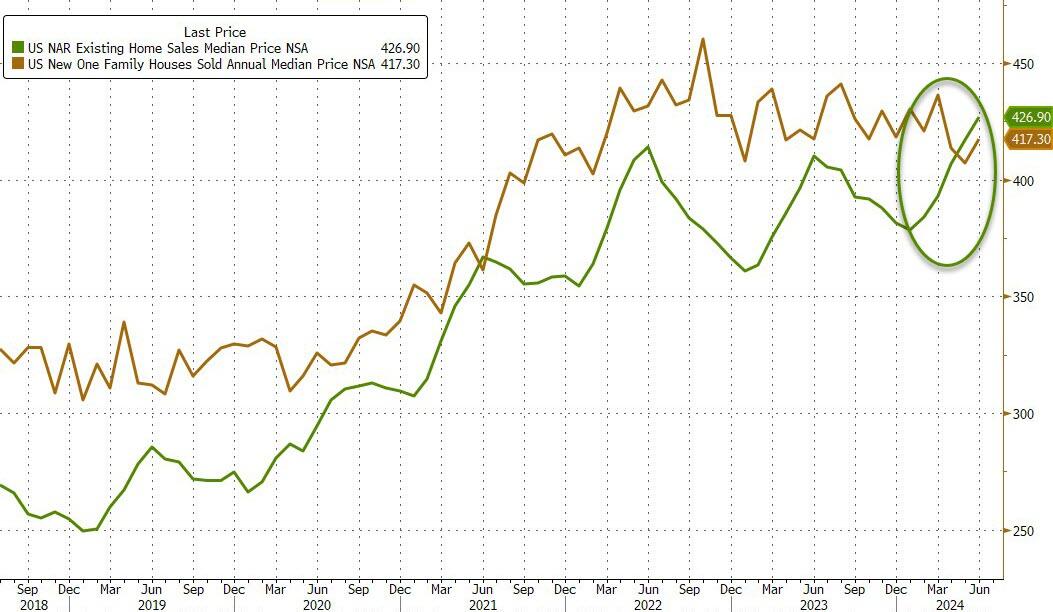
While the median new home price rose in June, it remains below the median existing home price…
Source: Bloomberg
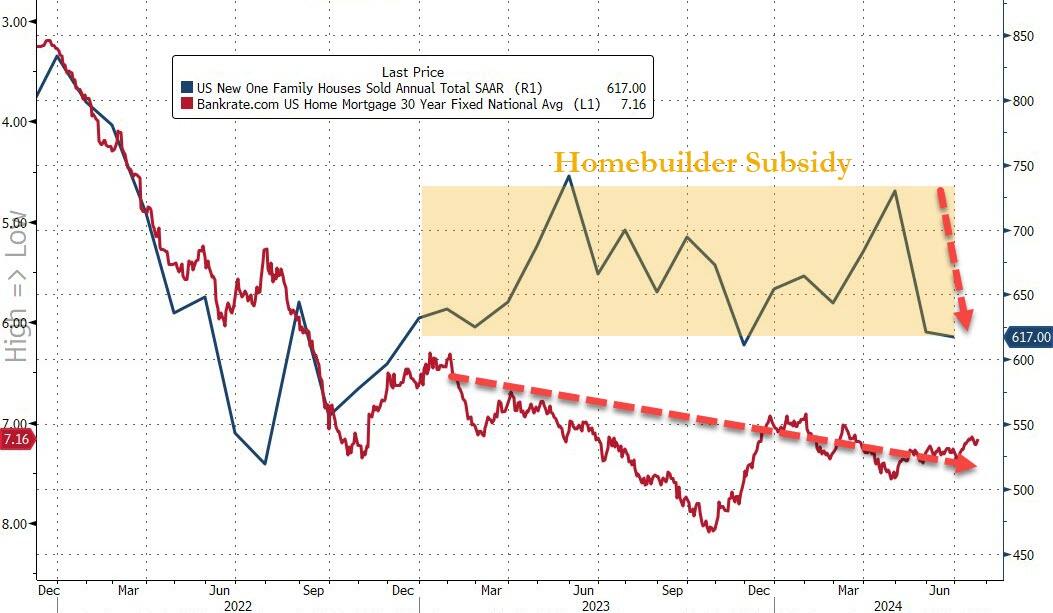
It appears the homebuilder subsidy fad is wearing off as mortgage rates show no signs of easing significantly…
Source: Bloomberg
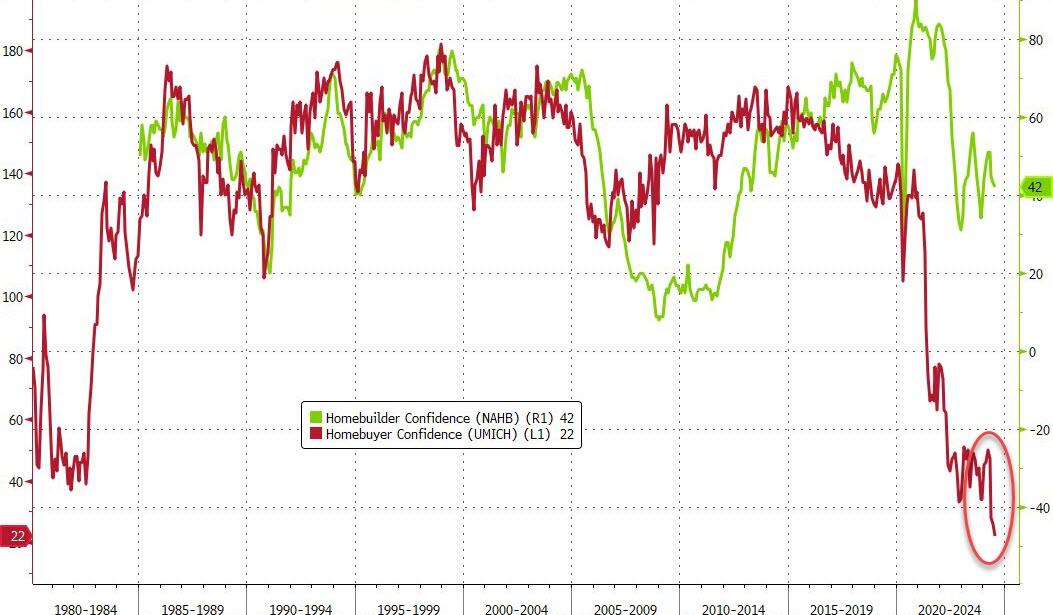
Of course, none of this should be a surprise as homebuyer confidence has collapsed to an all-time record low…
Source: Bloomberg
Will cutting rates help?
Probably not. Bidenomics is now called Harrisnomics (or Cacklenomics) since Harris as VP was the tiereaker in the US Senate. So, she holds some responsibility for the outrageous, wasteful spending in Washington DC.


You must be logged in to post a comment.