Combined Biden/Harris’ spending spree with The Fed’s monetary goonery and we got inflation (gasoline, food, shelter). With spiraling inflation in mortgage rates and shelter prices we saw a correponding decline in existing home sales under Biden/Harris.
Harris claims to lower prices on her first day in office (she has been in office as VP since 2021 and actually voted in the US Senate as tie breaker to enact policies that INCREASED Inflation). But her suggestion of $25,000 for ALL first time homebuyers is of course INFLATIONARY. And her anti-price gouging policies willl of course reduce supply of groceries avaiable, driving up INFLATION.
After watching the Democrat hate fest last night (Aka, the Democrat National Convention), I was not shocked that the DNC platform looked like a playbook to destroy the US economy. High taxes, endless spending, more regulations, etc. Not a word about the staggering side of the US debt load … with Harris’ economic plan projected to add a whopping $25 trillon in debt to the already massive $35+ trillion debt load.
And not a mention that US interest payments on the national debt already exceeds defense spending. And is booming!
Of course, Harris’s economic vision is a continutation of Biden’s disastrous visions (which are Obama’s vision of US obliteration). Most politicians in Congress are millionaires (including Bernie Sanders) and won’t suffer from their insane “progressive” policies. Watching last night’s DNC hatefest was like watching nasty 2nd graders having a party.
Of course, the drove of anti-American, anti-properity speakers spewing venom (I hate Hillary’s flat-tone speaking style) like Hillary, Jaime Raskin (aka, Rasputin), AOC, etc. all failed to acknowledge to acknowledge the already monstrous size of the US debt ($35+ trillion) or the massive size of the unfunded promises ($218+ TRILLION). Of course not.
The handle the staggering interest payments that will crowd out other spending, The Federal Reserve will be forced to lower rates.
Of course, Democrats will wheel out “economists” like Robert Reich who say that the debt doesn’t matter.
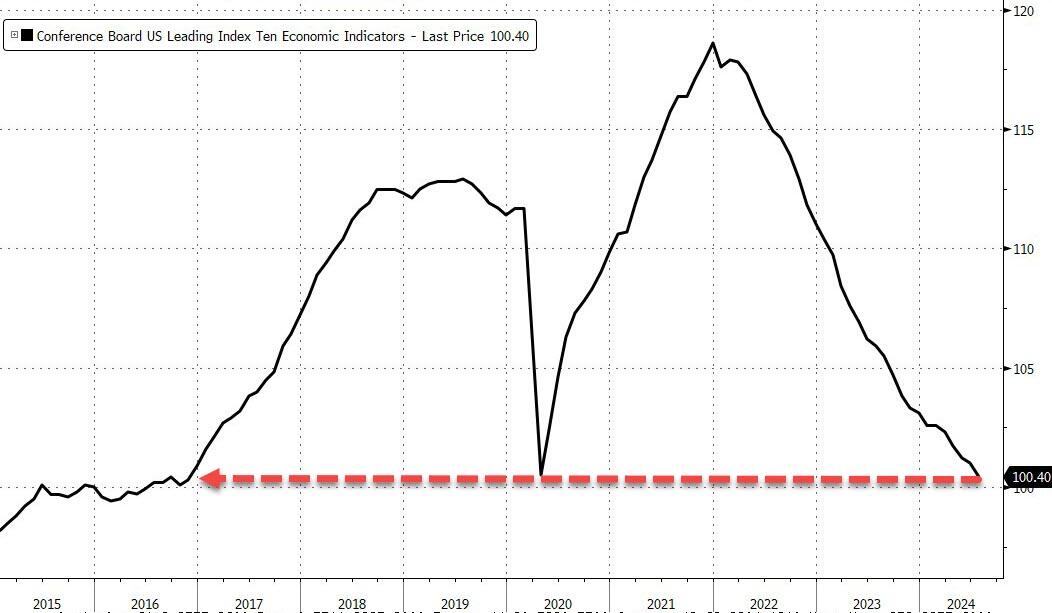
…and the head of The Conference Board says ‘nothing to see here’…
“The LEI continues to fall on a month-over-month basis, but the six-month annual growth rate no longer signals recession ahead,” said Justyna Zabinska-La Monica, Senior Manager, Business Cycle Indicators, at The Conference Board.
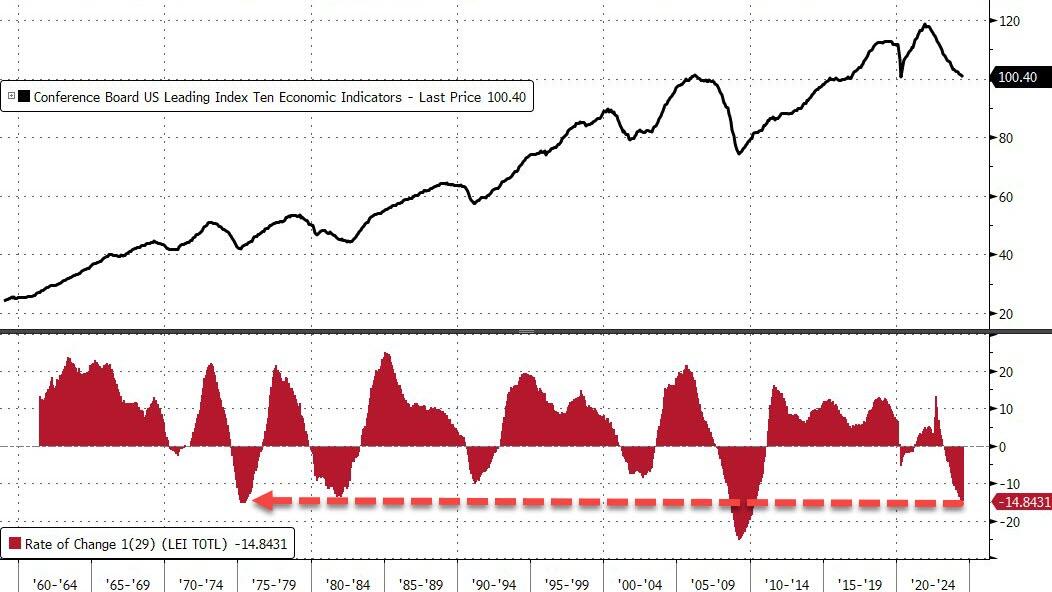
For context, outside of the great financial crisis, this is the worst decline in LEI since the mid ’70s!!!
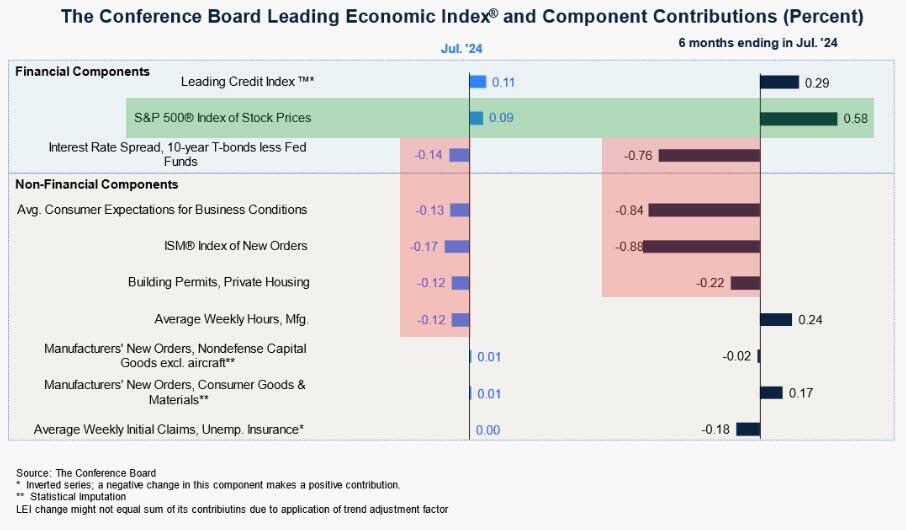
And what is behind the ‘no recession’ call… US equity strength!!
Thank The Feral Reserve for the equity spike!
So, to summarize – almost all the macro data signals weakening growth for years… but because stocks are up (and credit spreads down), there’s no recession anywhere on the horizon!!??
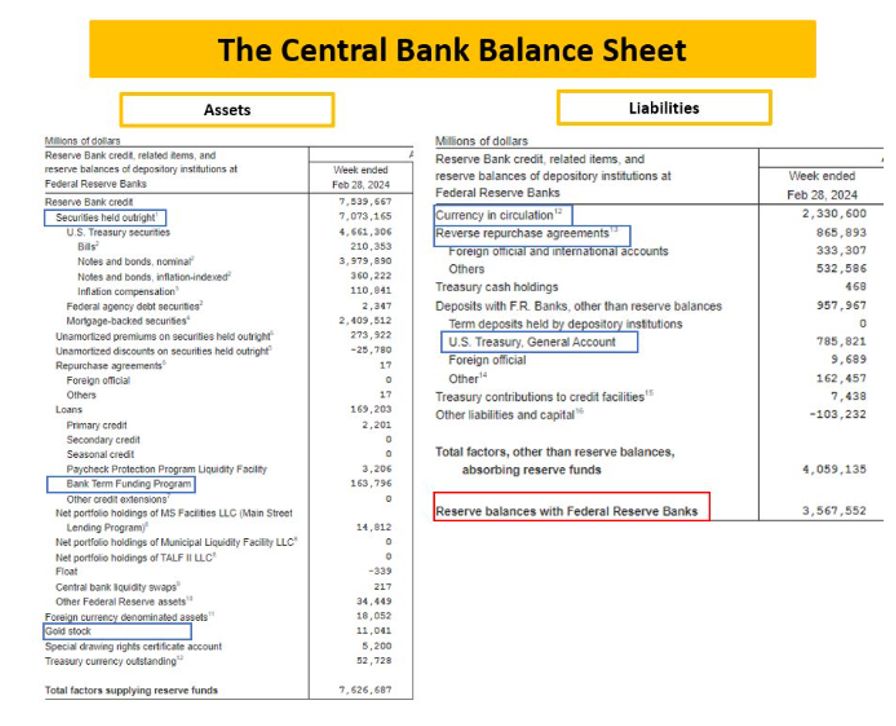
Kamala Harris, despite being VP for almost 4 years, is going to annouce her plans for taming inflation. Why doesn’t she do it now?? What Harris can’t control is The Federal Reserve that is losing money at breakneck speed.
Here is The Fed’s balance sheet.
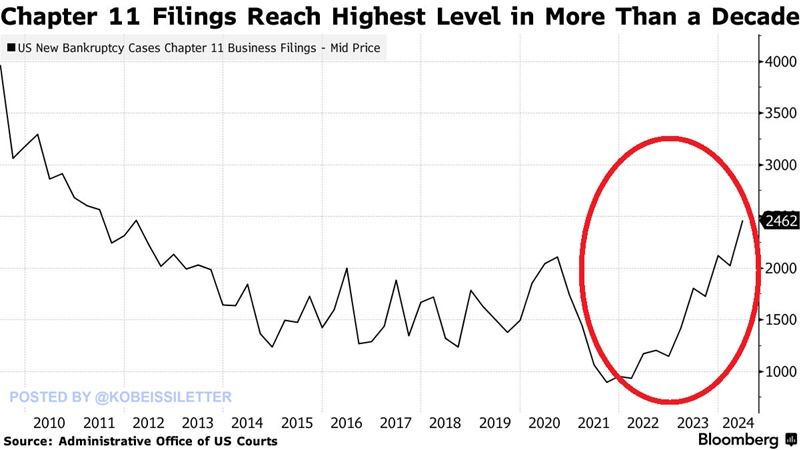
I shudder to think what Harris will propose to solve the highest bankrupty (Chap 11) rate in 13 years. Probably more Bidenomics (big wealth transfers to large corporations/donors).
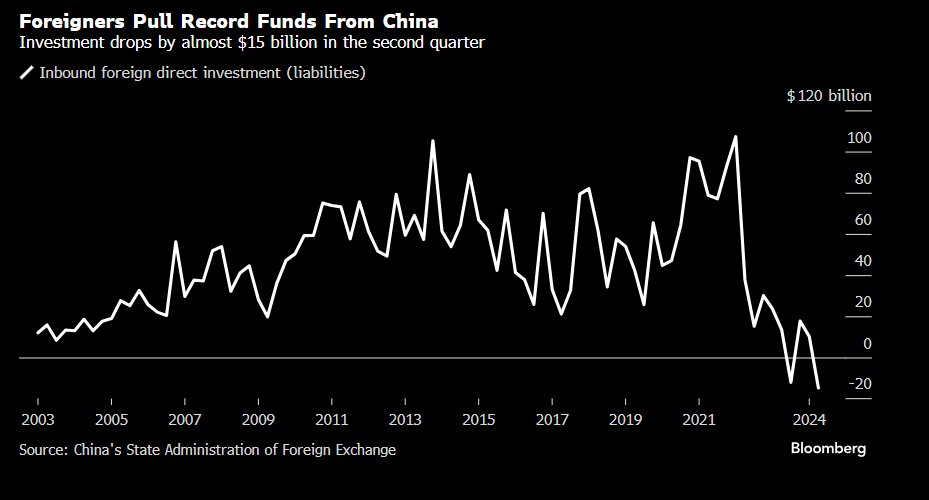
Meanwhile, foreigns pulled a record amount of funds from ailing China.
Kamala Harris will say anything to get elected, then fall back on her Communist agenda.
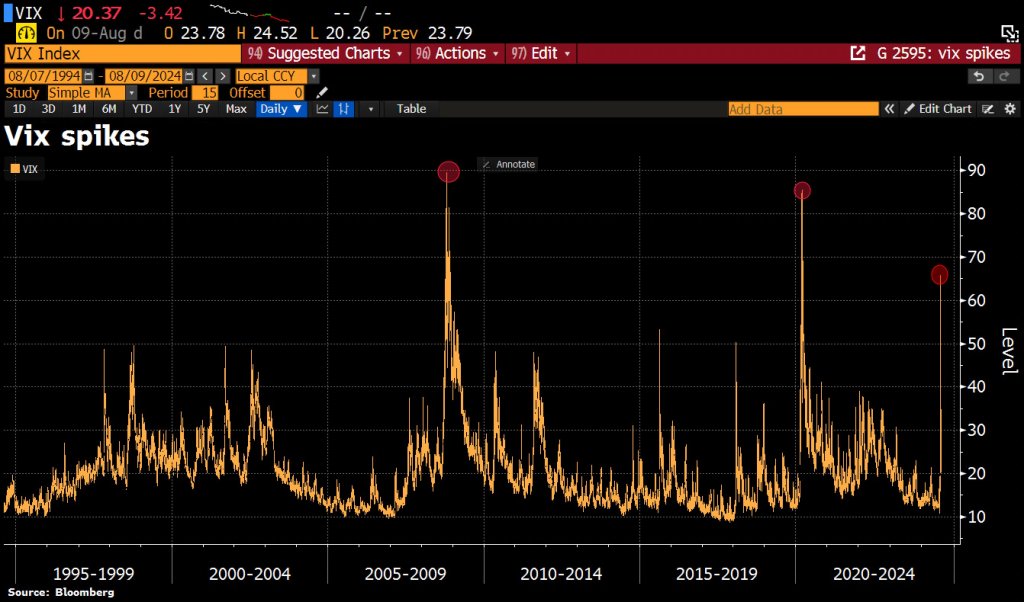
I have another use for VIX … to wipe out stock market gains. VIX is the S&P 500 volatility index, also known as “The Fear Index.”
Over the last 35yrs, the whole life of VIX history, there have only been 2 prior episodes of VIX trading >60: The 1st was during GFC, the collapse of Lehman, the 2nd episode occurred during Covid and we had a 3rd occurrence: that was last Monday.
The slowing US economy has a silver lining: Treasury and mortgage rates are declining. And the is spurring faster mortgage prepayments.
Mortgage applications increased 6.9 percent from one week earlier, according to data from the Mortgage Bankers Association’s (MBA) Weekly Applications Survey for the week ending August 2, 2024.
The Market Composite Index, a measure of mortgage loan application volume, increased 6.9 percent on a seasonally adjusted basis from one week earlier. On an unadjusted basis, the Index increased 6 percent compared with the previous week. The seasonally adjusted Purchase Index increased 1 percent from one week earlier. The unadjusted Purchase Index increased 0.3 percent compared with the previous week and was 11 percent lower than the same week one year ago.
The Refinance Index increased 16 percent from the previous week and was 59 percent higher than the same week one year ago.
The average contract interest rate for 30-year fixed-rate mortgages with conforming loan balances ($766,550 or less) decreased to 6.55 percent from 6.82 percent, with points decreasing to 0.58 from 0.62 (including the origination fee) for 80 percent loan-to-value ratio (LTV) loans.
The deciine in rates led to an increase in MBS convexity.


You must be logged in to post a comment.