Home Price Adjustment! Average Hourly Earnings YoY ABOVE Home Price Growth YoY (Home Price Growth Exploded Following Federal Governments’ Covid-related Spending Splurge)

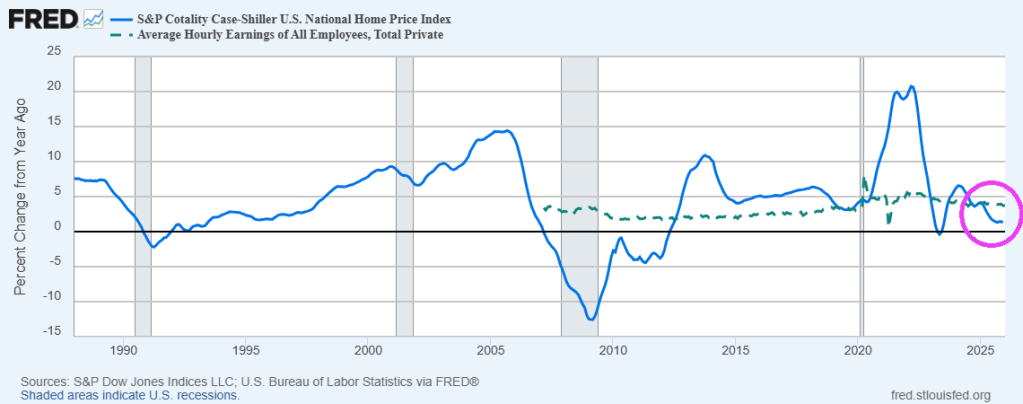
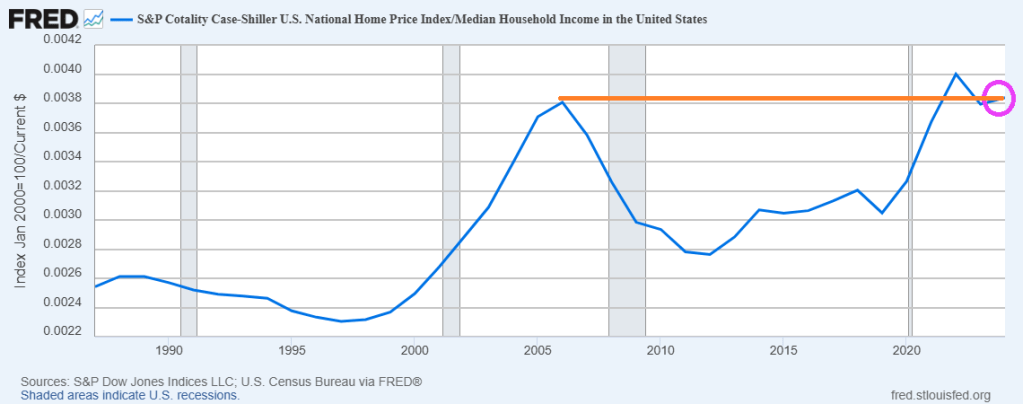
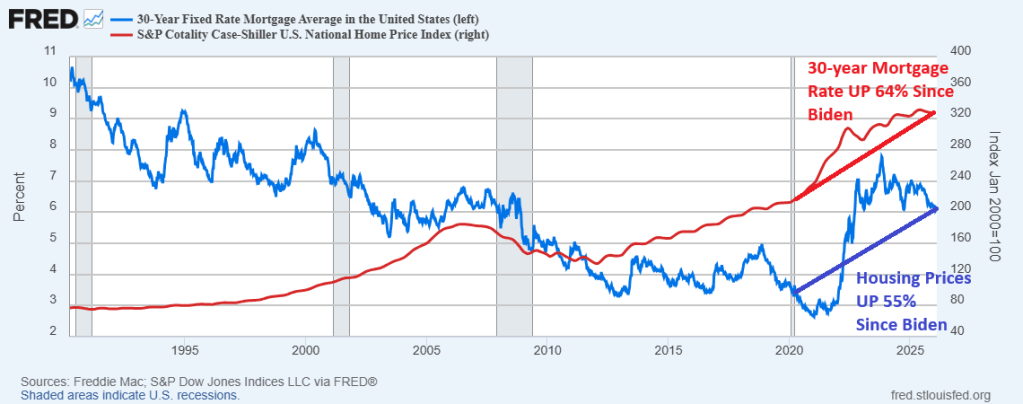
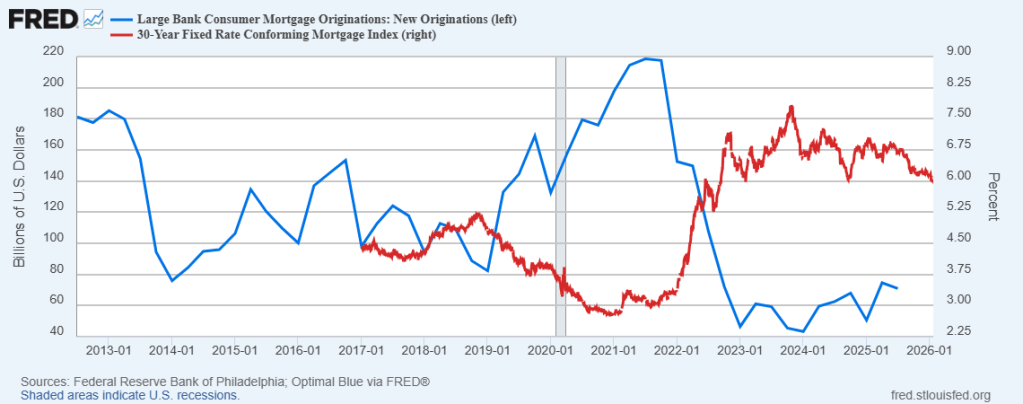
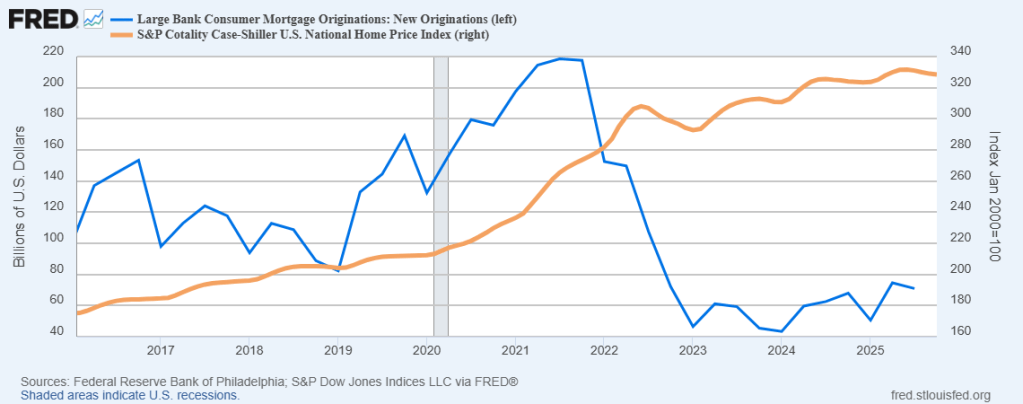
The S&P Cotality Case-Shiller U.S. National Home Price NSA Index posted a 1.3% annual gain (YoY) for December 2025, down from a 1.4% rise in the previous month. Average hourly earnings now at 3.73% YoY, higher than home price growth.

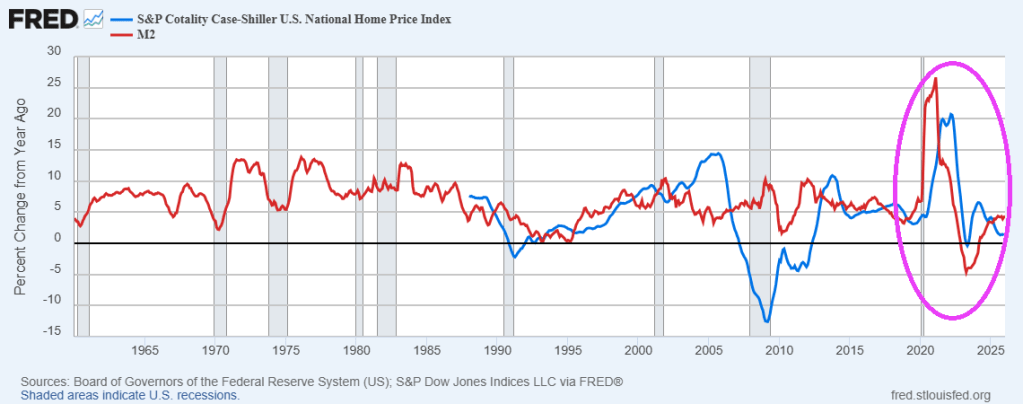
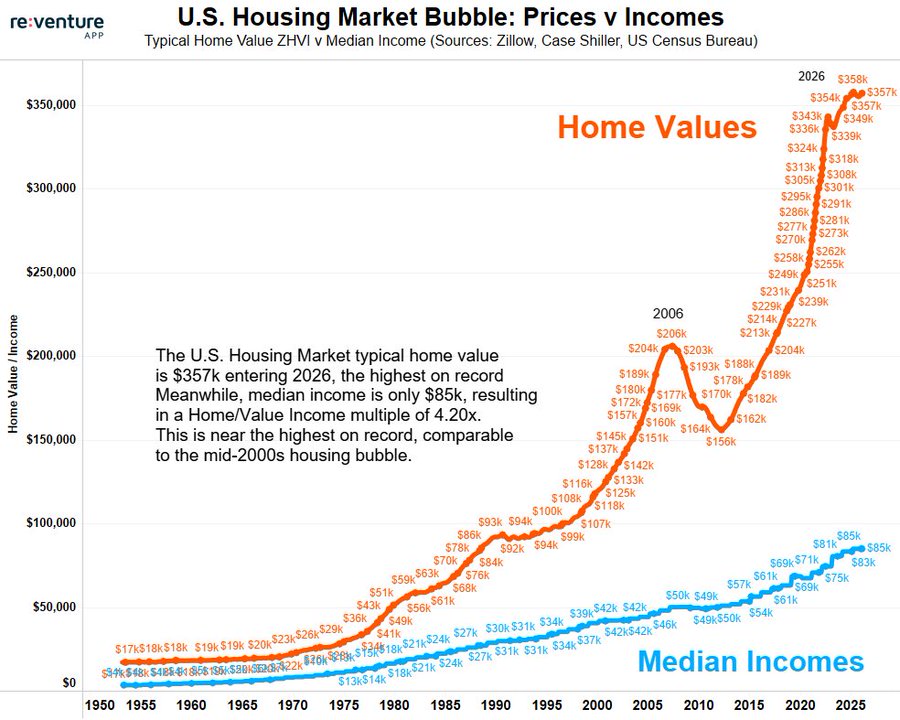
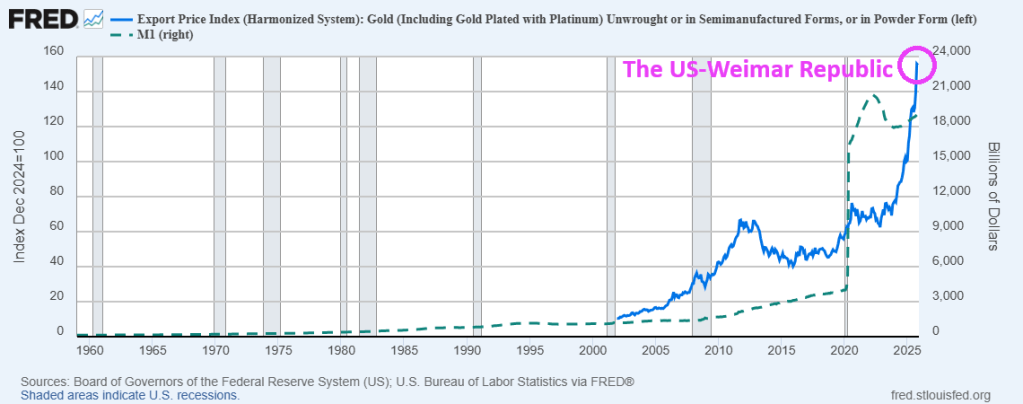
Home price growth exploded following The Federal governments’ Covid-related spending splurge.

Geographic divergence widened sharply: Chicago and New York led all markets with gains above 5%, while Tampa, Phoenix, Dallas, and Miami posted the steepest declines among markets that finished the year in negative territory.

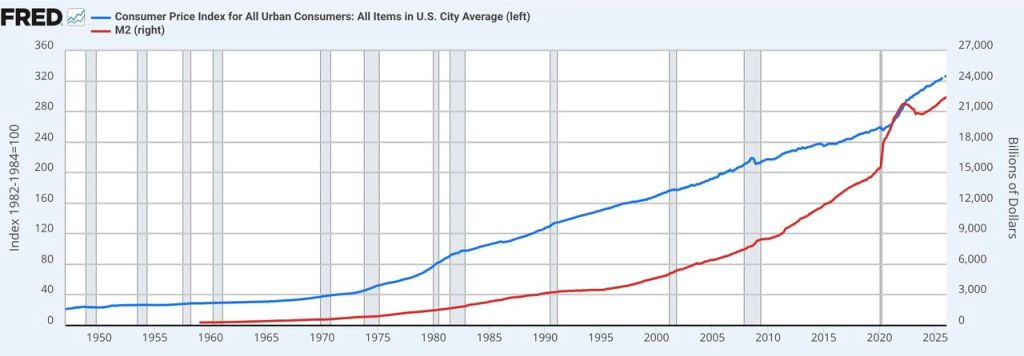
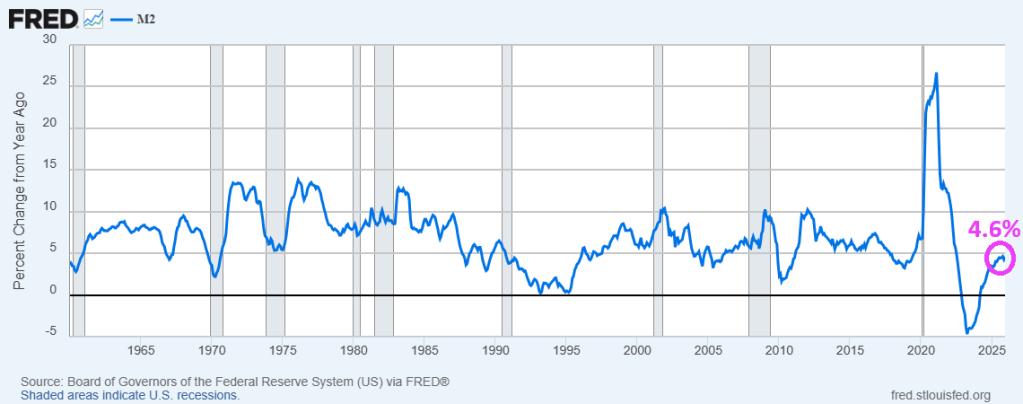
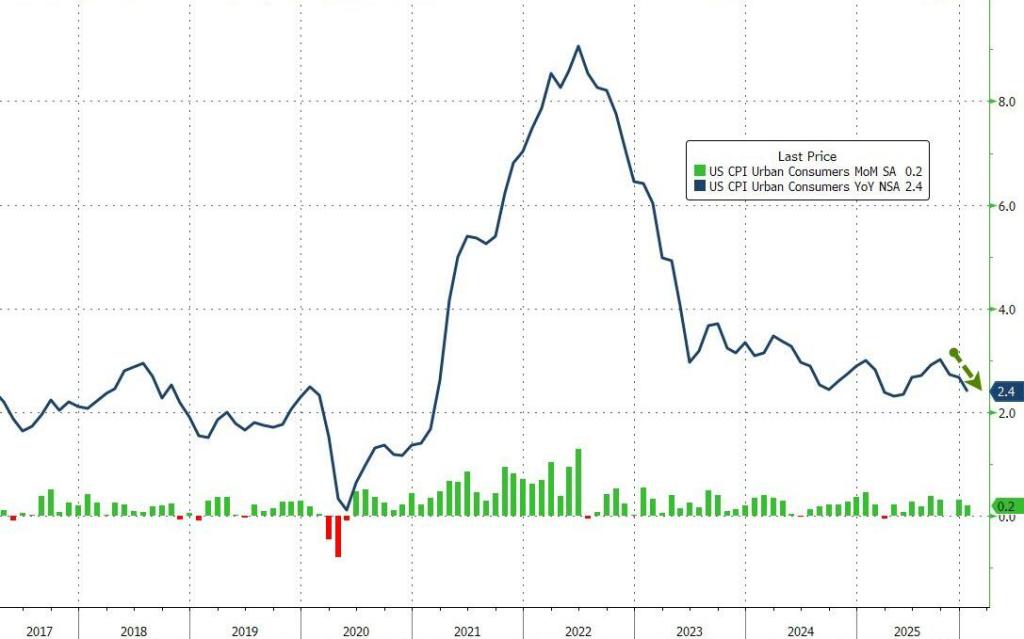
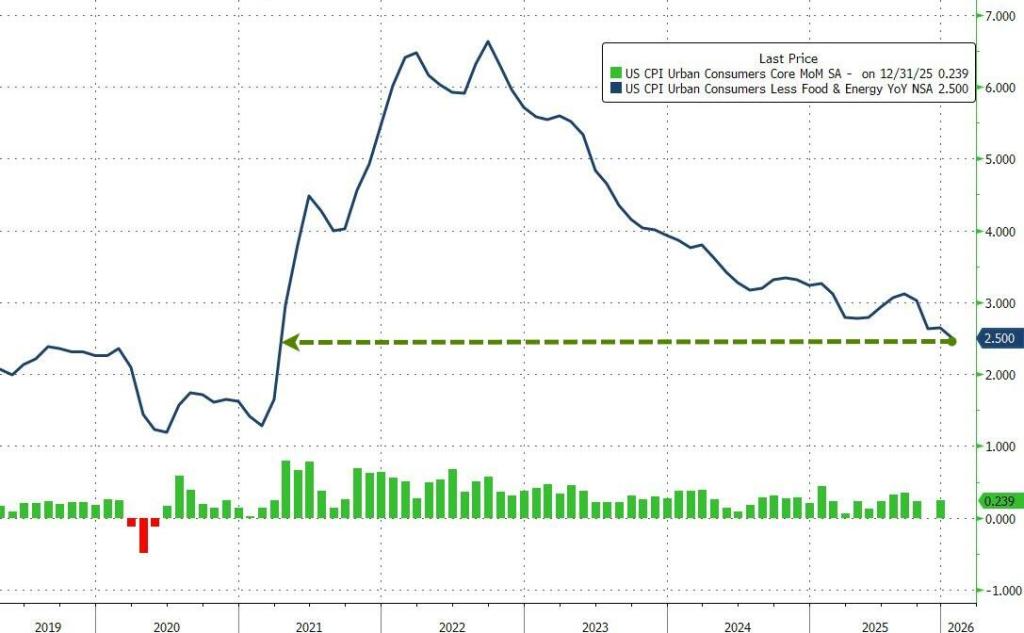
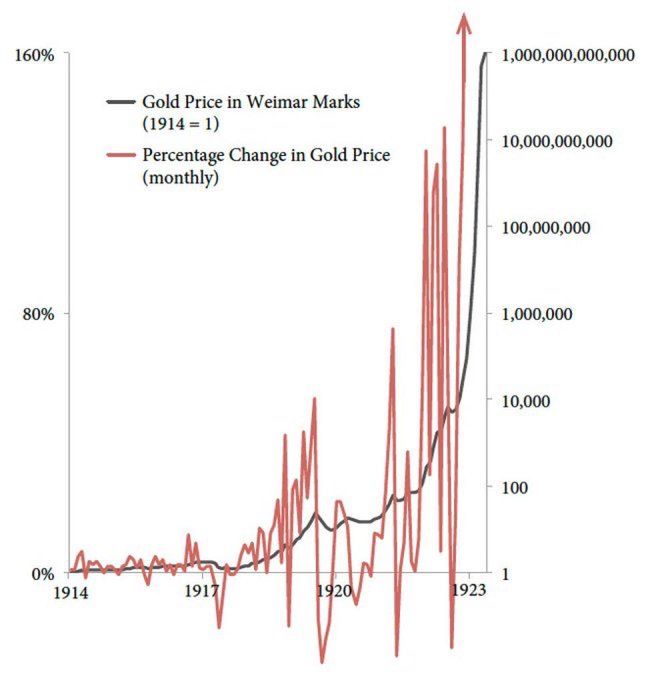
Inflation cooled significantly under Trump, but The Fed keeps printing M2!

Sure, Hillary, sure.

Inflation Power! US Core PCE Jumps On Durable Goods Jumps 2.051% (PCE Up 0.4% In December, M2 Up 4.6% YoY)

I called this inflation power!

Underlying U.S. inflation increased more than expected in December, and signs are pointing to a further acceleration in January, which would strengthen expectations that the Federal Reserve would not cut interest rates before June.

The personal consumption expenditures price index, excluding the volatile food and energy components, rose 0.4% after an unrevised 0.2% gain in November, the Commerce Department’s Bureau of Economic Analysis said on Friday. In the 12 months through December, core PCE inflation advanced 3.0% after increasing 2.8% in November.

The PCE price index increased 0.4% in December after rising 0.2% in November. PCE inflation increased 2.9% year-on-year after gaining 2.8% in November.

But in terms of contributions to the 0.4% figure is that durable goods rose 2.051%.

The Fed has been printing money (M2) like there is no tomorrow. With M2 growing at 4.6% YoY in December.

Gimme (Cheaper) Shelter! US Core CPI Falls To Slowest In 4 Years (Real Wage Growth Rises As Rent CPI Rose Only 0.2% In January)

Gimme (cheaper) shelter!

Rate-cut expectations have surged (dovishly) higher this week (along with tumbling Treasury yields) amid a mixed macro picture (Labor market ‘good’, Retail sales bad, Housing ugly).

Today could change all that as CPI for January prints with risk skewed to the upside. January brings annual resets and they tend to surprise on the high side.

Despite the ‘hot’ whisper numbers (and 4 previous Januarys in a row of upside surprises), headline consumer price inflation came in cooler than expected in January (+0.2% MoM vs +0.3% expected). That pulled the headline CPI down dramatically from +2.7% to +2.4% – near the lowest in 4 years.

Core CPI printed +0.3% MoM (in line with expectations), lowering the YoY change in core prices to +2.5% – the lowest since March 2021.

The Shelter index rose 0.2% in January and was the largest factor in the all items monthly increase. The food index increased 0.2% over the month as did the food at home index, while the food away from home index rose 0.1 percent. These increases were partially offset by the index for energy, which fell 1.5% in January.

January saw real average weekly earnings rise 1.9% YoY – its highest since March 2021…

US Unexpectedly Adds 130K Jobs In January, Most Since Dec 2024 (Growing Private Sector Jobs, Declining Government Jobs)

In January the US added 130K jobsdouble the 65K median estimate and up from a downward revised December print of 48K (vs 50K previously). This was also the highest monthly jobs increase since December 2024.

Government jobs fell by -42k. Furthering the trend for growing private sector employment and declining government employment.

Compared to Jan 2025, we see the growth in private sector employment and decline in government jobs.

The jobs report comes with the largest jobs revision since 2009/2010.

Now for the bad news, As my OSU/Chicago/GMU know, I prefer NON seasonally adjusted data when at all reasonable. While Seasonally adjusted jobs added SEASONALLY ADJUSTED was +130K, NOT seasonally adjusted jobs added was -2.649 Million.

Happy birthday to Tina Louis (Ginger from Gilligan’s Island) who turned 92 today.

Housing Bubble Part Deux! Home Price To Median Household Income Now Higher Than During Catestrophic Home Price Bubble Of 2005-2009 (Job Losses Primarily Women)

Yikes! The ratio of US Home Prices to US Median Household Income is now higher than the ratio during the catestrophic housing bubble during the latter half of the 2000s.

Here is a chart of home prices and median household incone,

The labor market is truly screwed-up. The December jobs report reveals that women account for nearly all labor force losses.

I Ain’t Drunk! Home Buyering Collapses As Home Prices 55% More Costly Than When Biden Became President (Mortgage Rates 64% More Expensive)

I ain’t drunk! But it would help in this housing market where housing prices and mortgage rates are much higher than when Joe Biden became President in January 2020. In fact, the Case-Shiller national home price index is 55% higher than when Sleepy Joe took the reins of Presidency and the 30-year mortgage rate is 64% higher.

Because of higher housing prices and mortgage rates,

The Case-Shiller national home price index is 55% higher than when Sleepy Joe took the reins of Presidency and the 30-year mortgage rate is 64% higher.

As a result of higher housing prices and mortgage rate (and Gavin Newsom’s ludicrous policies), it will take over 30 years to accumulate enough savings to buy a home in San Diego, Los Angeles, San Jose and San Francisco.

I ain’t drunk, but first-time homebuyers will need to be drunk in this housing market.

The Fed trying to help the economy.

The US-Weimar Republic! Gold Soaring With M1 Money Printing (Good Governments Don’t)

Money makes the world go around and gold prices soar!

Gold is looking eerily like gold prices during the Weimar Republic in Germany.

Tomorrow belongs to Socialists like AOC and Bernie Sanders who want to keep spending. Along with Senator Chuck

Good governments don’t print insane quantities of money.

Wipeout! $6 Trillion Erased In 60 Minutes At Opening

Wipeout! $6 TRILLION ERASED IN 60 MINUTES

Gold wiped out nearly $3 trillion
Silver erased nearly $790 billion
S&P 500 lost nearly $780 billion
Nasdaq wiped out $750 billion
Crypto market erased $100 billion

Insane crash at US market open.

Gold suffered too.

Along with Bitcoin.

Strong Buyers Market In Housing! 47.1% More Sellers Than Buyers

Its some kind of wonderful … for home buyers.

Home sellers outnumbered buyers by 47.1% in December 2025, the largest gap since Redfin data began in 2013.

The percentage jumped by +7.1 points from November, the biggest monthly increase since September 2022.

The number of active homebuyers fell -5.9% MoM to 1.34 million, the lowest level on record.

Meanwhile, home sellers declined -1.1% MoM to 1.97 million, the lowest since February 2025.

By comparison, in November 2021, there were 36.5% fewer sellers than buyers.

This all comes as elevated housing costs and economic uncertainty continue to push buyers to the sidelines.

Buyers now hold unprecedented negotiating power, but only if they can afford to enter the market.

Let’s see what sugar babe (aka The Federal Reserve) does.

Mortgage Market After Covid! Soaring Home Prices And Mortgage Rates Led To Collapse Of Mortgage Originations

Like The Talking Heads song “Life During Wartime,” we are dealing with the mortgage market affer Covid. What happened? Mortgage originations plunged after mortgage rates (red line) soared.

In addition, insane Federal spending levels caused housing prices to soar.

‘Stay warm!