This is the Steve Urkel economy where The Federal Reserve and Federal government screw everything up with their policies (or follicies) and say “Whoops! Did I do that?”
(Bloomberg) — U.S. consumer sentiment rose slightly in early September but remained close to a near-decade low, while buying conditions deteriorated to their worst since 1980 because of high prices.
The University of Michigan’s preliminary sentiment index edged up to 71 from 70.3 in August, data released Friday showed. The figure trailed the median estimate of 72 in a Bloomberg survey of economists.
Buying conditions for household durables, homes and motor vehicles all fell to the lowest in decades. The report said the declines were due to complaints about high prices. Consumers expect inflation to rise 4.7% over the coming year, matching the highest since 2008.
September’s UMich Buying Conditions for Houses fell to 60 … thanks to superheated house prices.
I can just picture Fed Chair Jerome Powell channeling Steve Urkel and saying “Whoops!! Did I do that?”
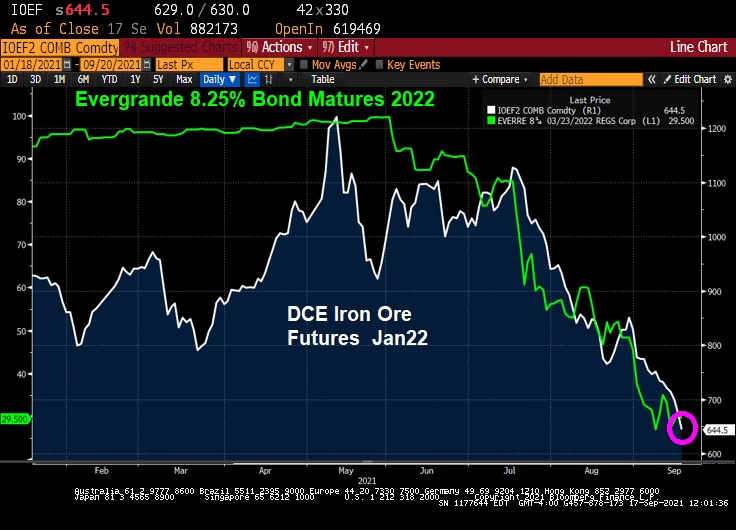
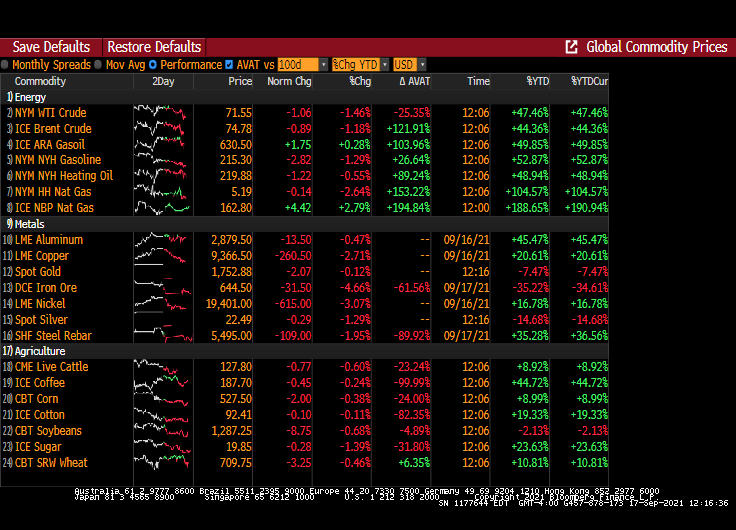
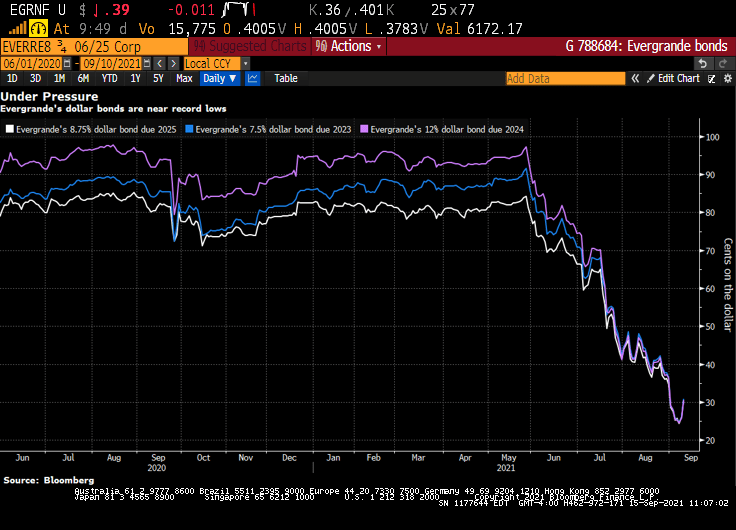
Iron Ore futures are down a whopping 4.66% today as China real estate developer Evergrande plunges into insolvency. And Evergrande’s bond that matures in 2022 sinks to $29.50.
Other commodities are also sinking. One of the only commodities that is increasing today is ICE NBP Natural Gas.
And that is a shame is your rely on propane for heating, since propane prices has risen 78% since the election of “Delaware Joe” Biden as President.
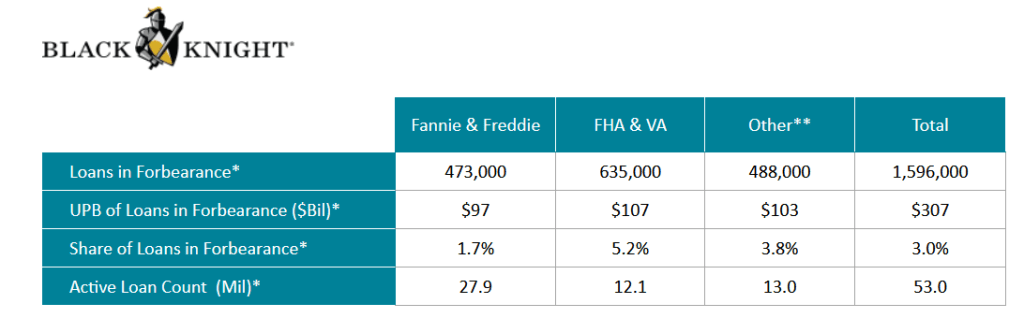
The Covid epidemic hit the single-family mortgage market hard in early 2020, leading mortgage lenders and servicers to offer FORBEARANCE to borrowers who were having trouble making their mortgage payments due to loss of hours or a loss of job.
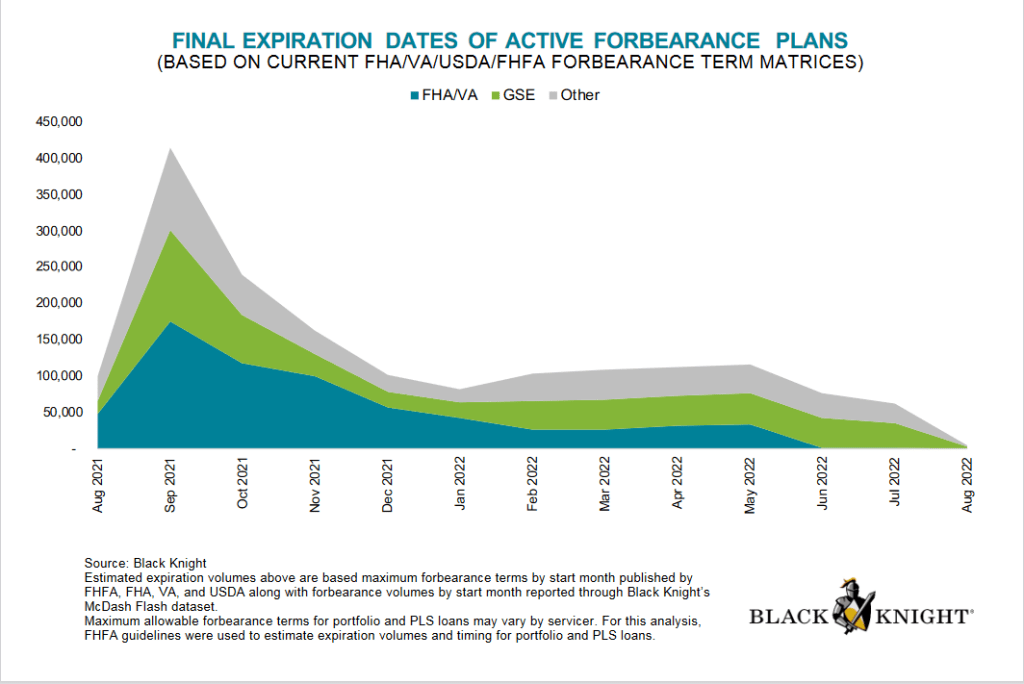
The good news? Active forbearance plans are much lower today than at their peak after the Covid epidemic struck in early 2020 with active forbearance plans peaking in May 2020.
Forbearance plans are due to expire in
What is forbearance, you ask? Forbearance is when a mortgage servicer or lender allows a borrower to temporarily pay their mortgage at a lower payment or pause paying your mortgage. The borrower will have to pay the payment reduction or the paused payments back later.
Despite forbearance, Fannie Mae still reported $7.2 billion in net income in Q2 2021. Notice the difference between single-family SDQ and the SDQ rate without forbearance. Freddie Mac reported $3.7 billion in Q2 2021 net income.
Here is a look at Fannie Mae’s net income over the past year and SDQ rates.
Under the existing seller/servicer eligibility requirements, the Agency SDQ Rate is defined as 100 multiplied by (the UPB of mortgage loans 90 days or more delinquent or in foreclosure for Fannie Mae, Freddie Mac, and Ginnie Mae/Total UPB of mortgage loans serviced for Fannie Mae, Freddie Mac, and Ginnie Mae). Beginning with the financial quarter ending Jun. 30, 2020, the Agency SDQ Rate will include an adjustment for mortgage loans in a COVID-19-related forbearance plan that are 90 days or more delinquent and were current at the inception of the COVID-19-related forbearance plan. The UPB of such mortgage loans shall be multiplied by .30 and added to the UPB for SDQ mortgage loans for the purposes of determining the numerator in the calculation of the Agency SDQ Rate.
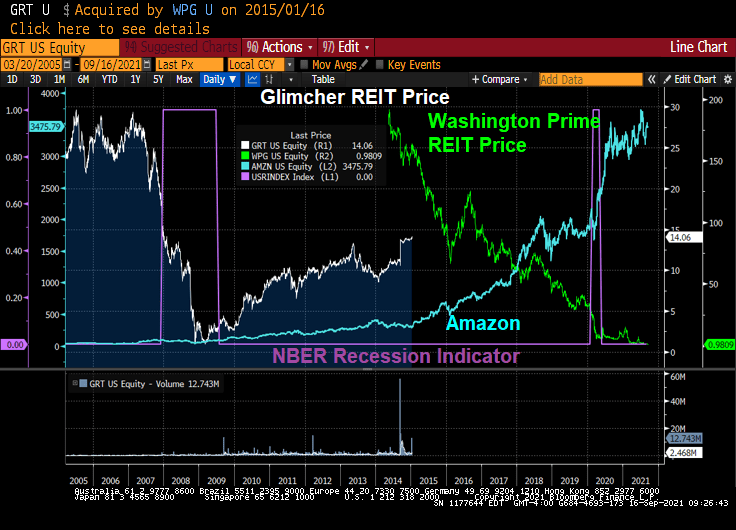
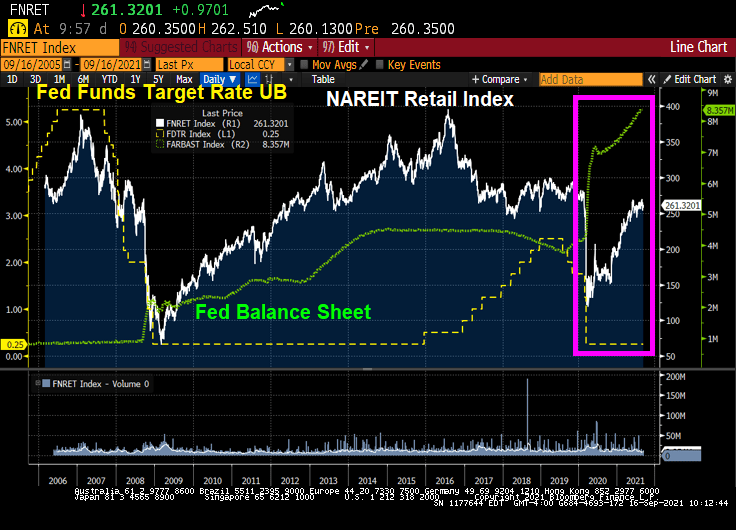
It is tough to operate a retail Real Estate Investment Trust (REIT) in the face of the triple whammy that hit retail shopping. First, there was the housing bubble/subprime crisis of 2008-2009. Then there was the advent of on-line shopping, then COVID.
I look at the NAREIT retail index and two retail REITs for comparison: Simon Property Group and Washington REIT. And as a proxy for online shopping, I compare them to Amazon. Both Washington REIT and the NAREIT retail index were at loft valuations at the peak of the housing bubble, but crashed with the onset of the housing bubble burst and ensuing financial crisis. But following The Great Recession, both recovered by 2016 (along with Simon Property Group which actually far exceeded their pre-Great Recession peak.
ii
But then retail mall disaster struck. In the form of on-line shopping. I use Amazon to represent on-line shopping. While NAREIT Retail and Simon fell from their 2016 peak, Washington REIT got clobbered.
Then Covid struck. When combined with on-line shopping and fear mongering by Anthony Fauci, retail REITs got hit hard. But all three have rebounded slightly since their nadir in 2020.
An interesting case study is Glimcher REIT, a formerly privately-held commercial real estate development company from Columbus Ohio. Like other retail REITs, Glimcher was crushed by the financial crisis and Great Recession. Glimcher’s share price fought back to $14.06 per share (down considerably from $29.28 in February 2007).
Washington Prime Group Inc. acquired Glimcher Realty Trust for $4.3 Billion in stock and cash Including the assumption of Glimcher’s debt. Right as on-line shopping took off. And the Covid struck a death blow leaving Washington Prime trading at $0.98. Washington REIT is transforming into a multifamily REIT given the overbuilding of DC area office space and the triple whammy of retail centers.
Retail REITs have almost recovered from Covid, thanks to the massive monetary stimulus from The Federal Reserve. Not to mention fiscal stimulus from DC.
Yup, a triple whammy has hit retail REITs with some faring better than others.
But the NAREIT RESIDENTIAL Index has exploded with Fed stimulus.
According to Bloomberg, Chinese authorities told major lenders to China Evergrande Group not to expect interest payments due next week on bank loans, which takes the cash-strapped developer a step closer the nation’s largest modern-day restructurings, and guarantees that China’s “Lehman Moment” is now just a matter of days, if not hours.
According to Bloomberg, citing unnamed sources, the Ministry of Housing and Urban-Rural Development told banks in a meeting this week that Evergrande won’t be able to pay its debt obligations due on Sept. 20, and instead most of Evergrande’s working capital in now being used to resume construction on existing projects, the housing ministry told bankers, according to a Bloomberg source.
And since nonpayment of interest and principal will represent an event of default, the company is unlikely to make any subsequent interest, or principal, payments either since it will have already default even though Bloomberg claims that “Evergrande is still discussing the possibility of getting extensions and rolling over some loans.” It won’t, especially since the developer will also miss a principal payment on at least one loan next week, which means it’s game over.
China Evergrande Group may undergo one of the country’s biggest-ever debt restructurings, if the developer’s distressed-level bond prices are any indication.
Singapore LLC, also predicts Evergrande may default and enter restructuring. That risk is being priced in, with many of Evergrande’s dollar bonds trading near 30 cents.
Debt delinquencies at developers the size of Evergrande are so rare in China that investors, analysts and regulators would only have a few case studies to go on. Kaisa Group Holdings Ltd. in 2015 became the first Chinese builder to default on dollar bonds. The restructuring of another, China Fortune Land Development Co., is currently under negotiation.
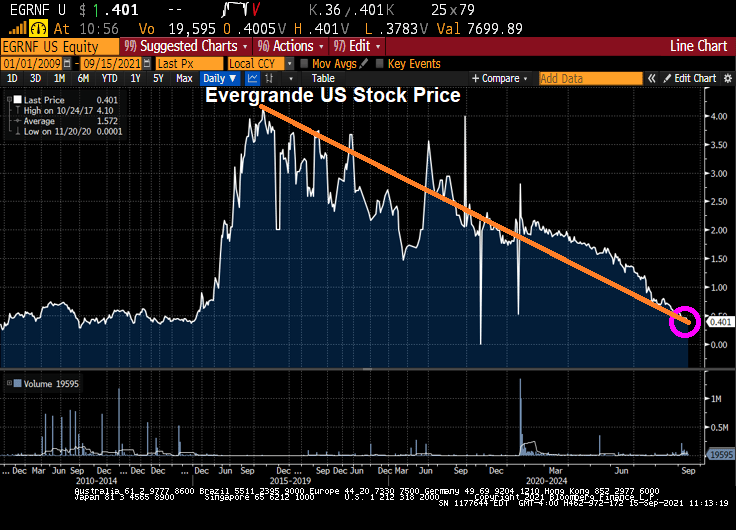
Do I detect a trend in Evergrande’s US stock price?
Update: China has a variation of the Wuhan Flu and it is spreading throughout other Chinese property developers after Evergrande’s main unit (onshore real estate) said that trading in all of its onshore bonds would be suspended on Sept 16 to ensure fair information disclosure following a downgrade to A from AA (which in China is viewed as the lowest investment grade rating) by China Chengxin International.
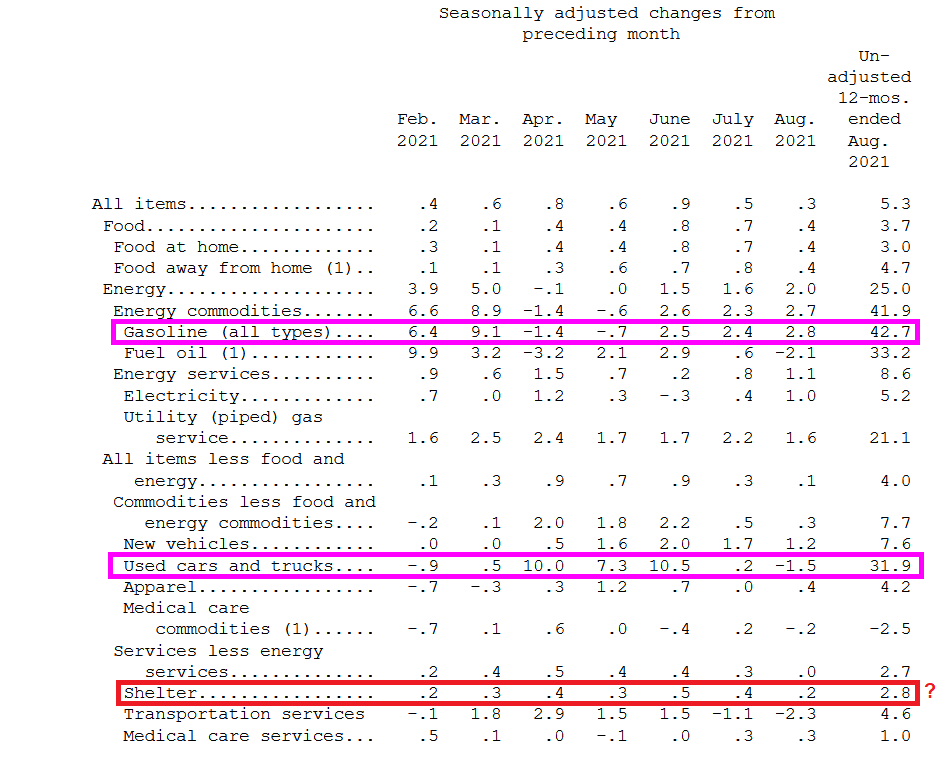
US inflation remained about the same in August as it was in July. CPI YoY fell ever so slightly from 5.4% in July to 5.3% in August. Real hourly earnings remain negative.
The source of consumer inflation? Gasoline prices rose 42.7% YoY while used cars and trucks rose 31.9% YoY.
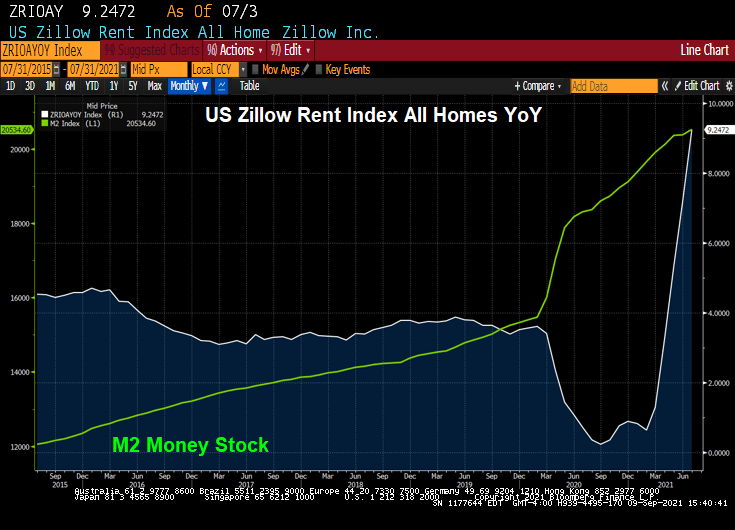
Shelter rose 2.8% YoY. That is odd since the Case-Shiller national price index is growing at a torrid 18.61% YoY pace and the Zillow Rent Index YoY has recovered to a sizzling 9.24% YoY pace.
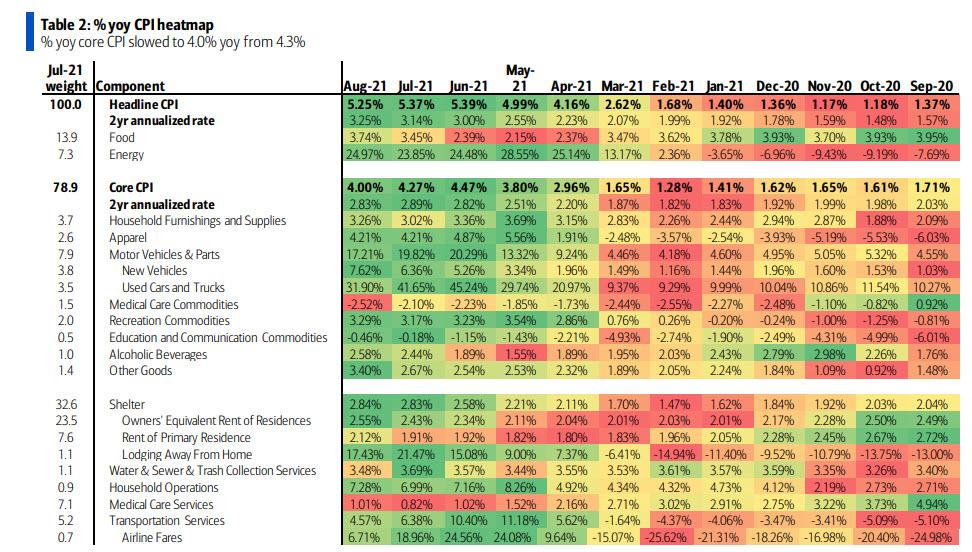
The YoY heatmap of inflation.
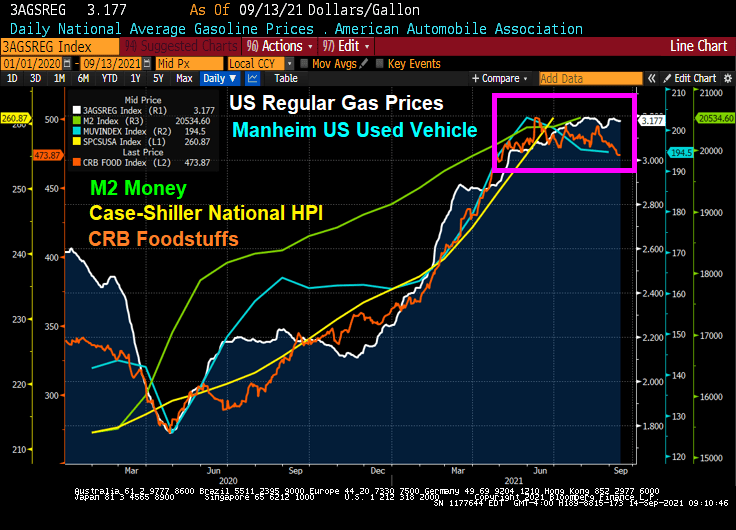
However, with the exception of home prices and rent, we are seeing a slowing of used car, foodstuffs and regular gas prices over the summer.
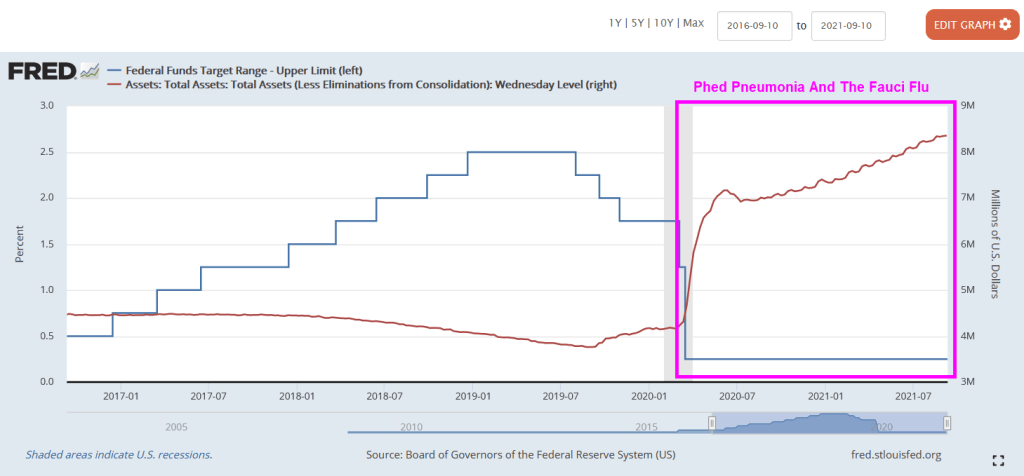
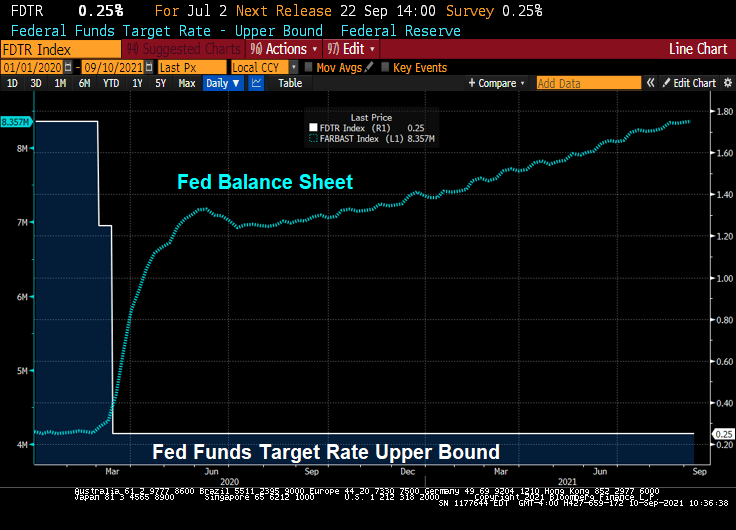
Since the Covid outbreak in early 2020, The Federal Reserve lowered their target rate and super-spiked their balance sheet. Helping to lower bank deposit rates to near zero.
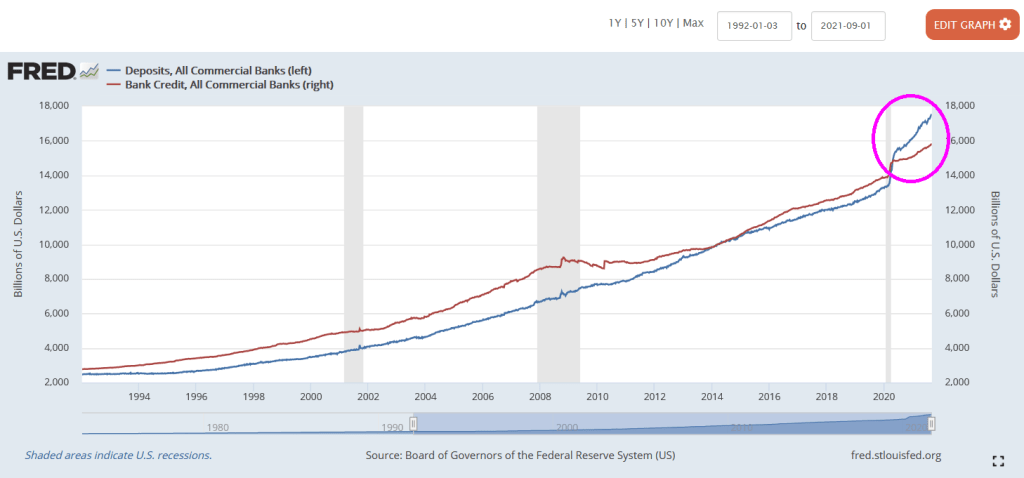
But despite near zero bank deposit rates, we seeing bank deposits are larger than bank credit such as commercial and industrial loans, residential mortgages loans, car loans, etc. Normally, bank credit EXCEEDS bank deposits.
The problem? One of them is negative growth in commercial and industrial lending. It declined 13.5% YoY in August. Of course, The Federal government extended emergency business loans that were counted as C&I loans, hence the spike in C&I loan growth in May 2020. But now we are seeing a real slowdown in C&I lending.
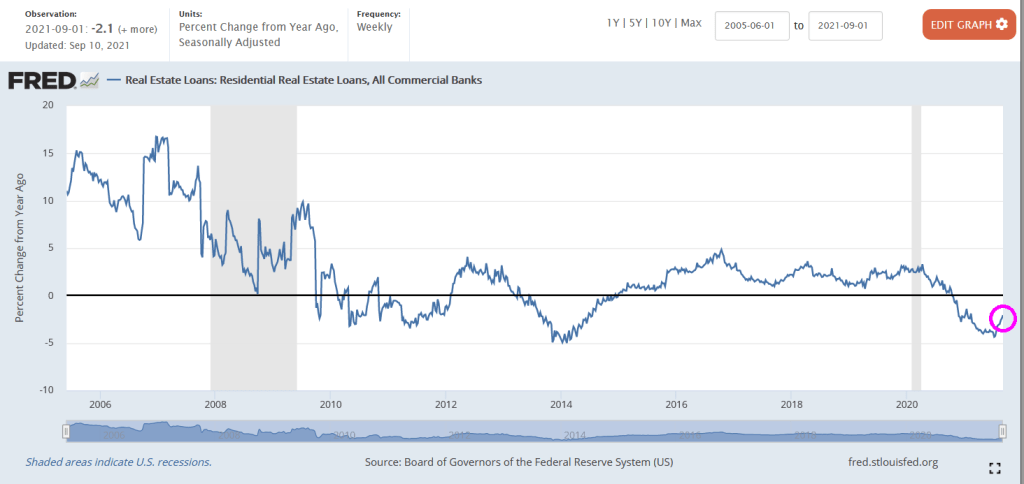
Residential lending is down 2.1% YoY as of September 10 (for August).
Commercial real estate lending? At least it is growing at a 2.9% YoY pace for August.
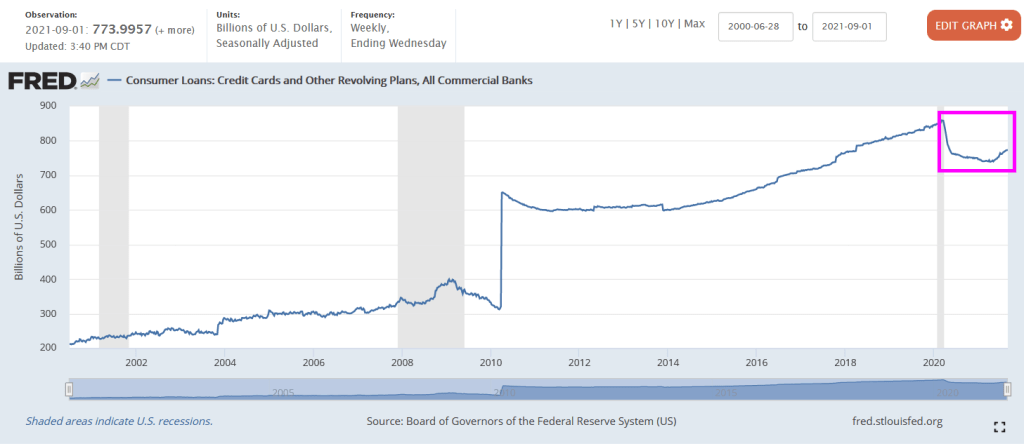
Credit cards and other revolving plans increase steadily since 2014 and then declined after the Fauci Flu struck. But credit cards and revolving credit has started to rise again.
The Fed’s massive overreaction to Covid caused a storm surge in C&I lending that has subsided. But other bank lending has slowed as well.
Lots of bank assets with nowhere to go.
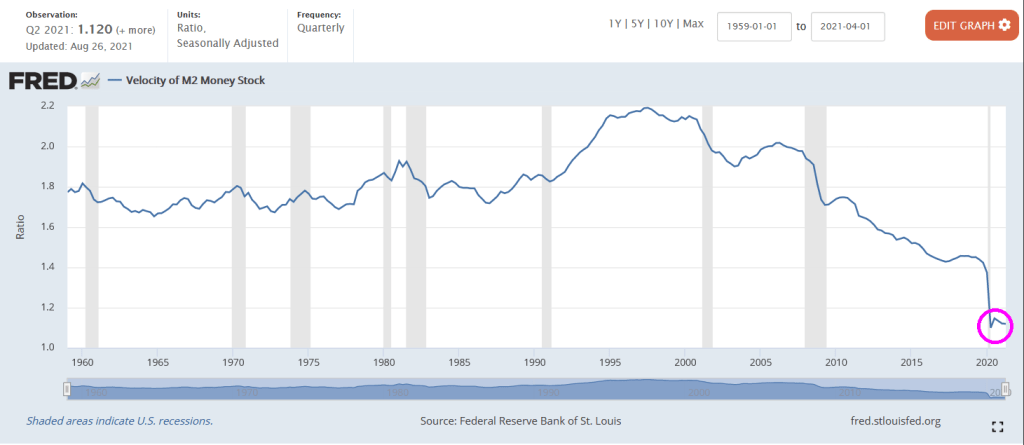
No wonder M2 Money Velocity (GDP/M2 Money) is at historic lows.
Remember, Federal Reserve Chair Jerome Powell is up for reappointment and President Biden must make a decision on his reappointment.
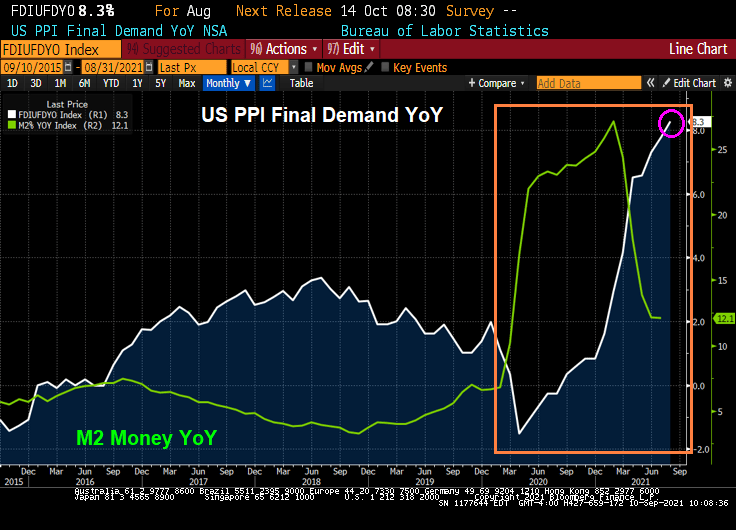
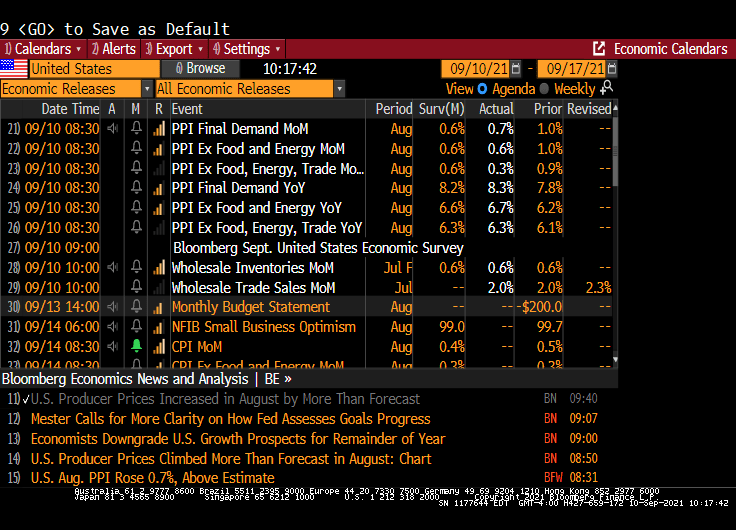
(Bloomberg) — Prices paid to U.S. producers increased in August by more than forecast as persistent supply chain disruptions squeeze production costs higher.
The producer price index for final demand increased 0.7% from the prior month and 8.3% from a year ago, a fresh series high, Labor Department data showed Friday. Excluding the volatile food and energy components, the so-called core PPI advanced 0.6%, and was up 6.7% from August of last year.
PPI Final Demand prices rose 8.3% YoY in August.
Given that there are shortages in the economy, why is The Federal Reserve pumping so much money into the system? It is like repeatedly flushing a clogged toilet hoping it will clear.
The correct way to clear a clogged economic toilet.
Not The Fed way of clearing clogged toilets. Pumping trillions of dollars into a clogged economic system.
Not only after home prices screaming at near 20% YoY growth, but apartment rents are surging as well.
(Bloomberg) — Apartment rents were up in August from a year earlier in all the top 30 U.S. metro areas, the first time that’s happened since the start of the pandemic, according to a new report by Yardi.
The national average rent inmulti-family buildings rose 10.3% from a year earlier to $1,539 — the first double-digit rise in the dataset’s history — after a $25 increase in August, the real-estate firm said. Over the past 10 years, the average pace of growth has been 2%.
Zillow’s rent index of all homes is growing at 9.25% YoY.
Fed Chair Jerome “Inflation is Transitory” Powell.
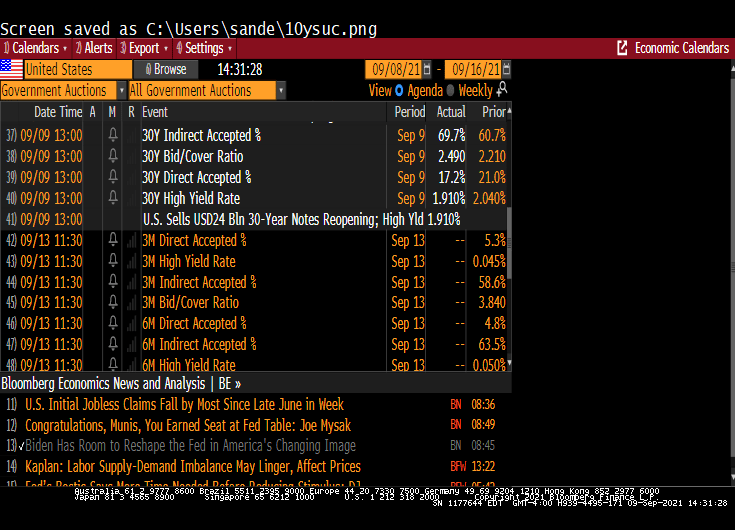
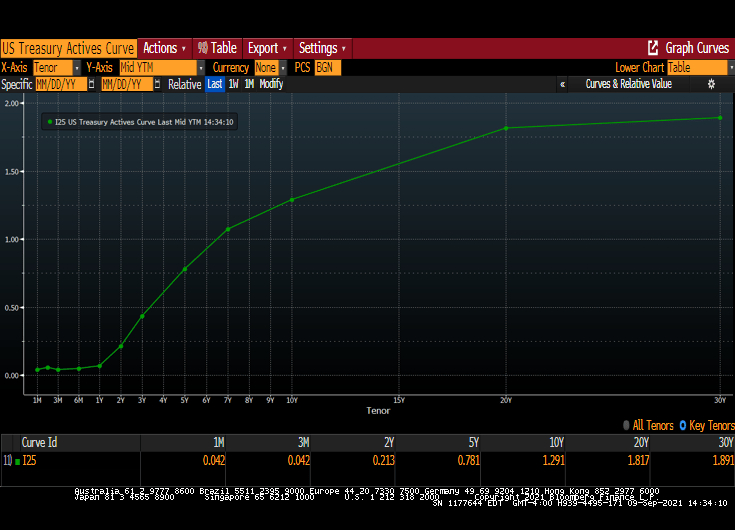
Face it, the 30-year Treasury market is not as interesting as widely-traded as the 10-year Treasury market. But we did see some interesting revelations in today’s 30 year Treasury auction.
If yesterday’s 10Y auction was blockbuster, one of the strongest benchmark sales on record, then today’s $24 billion offering of 30Y paper – the last coupon auction of the week – was nothing short of spectacular.
Printing at a high yield of just 1.910%, the auction not only stopped at the lowest yield since January’s 1.825%, but also stopped through the When Issued by a whopping 1.8bps, the most since April and ended 4 consecutive months of tails in the 30Y tenor.
The bid to cover of 2.486 was not only a big jump from last month’s 2.208 but also the highest since the 2.500% in July 2020, and far above the six-auction average of 2.276.
The bid-to-cover ratio is the dollar amount of bids received in a Treasury security auction versus the amount sold. The bid-to-cover ratio is an indicator of the demand for Treasury securities. A high ratio is an indication of strong demand.
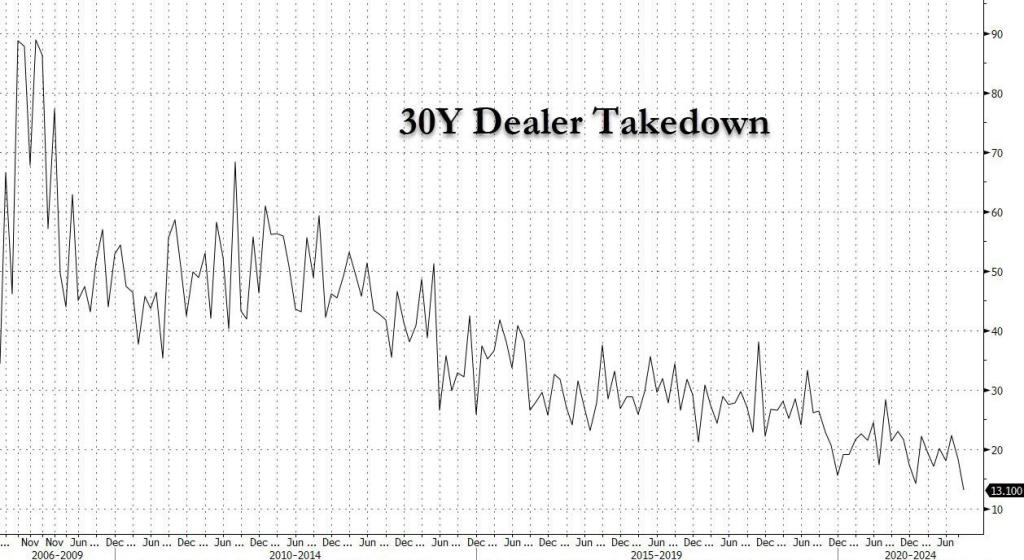
Primary dealers are responsible for absorbing any supply not bought by direct or indirect bidders. Indirect bidders, which include fund managers and foreign central banks. Dealer takedown of the 30Y Treasury is historically low.
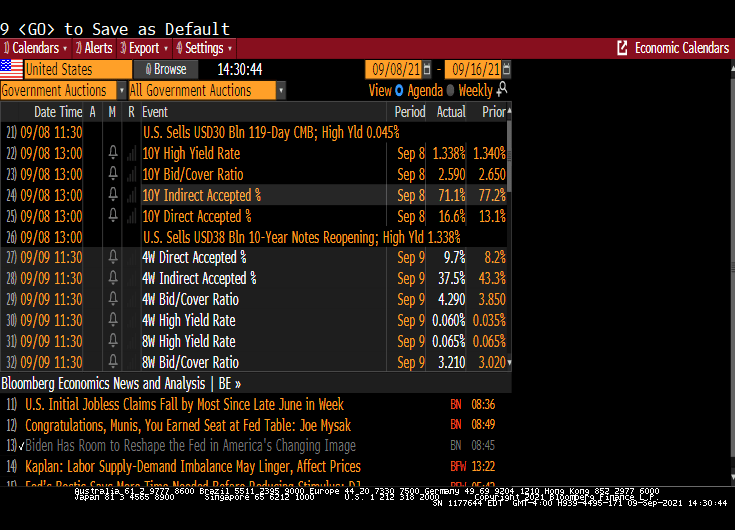
The 10-year auction was similar in that the high rate fell. But the bid-to-cover declined.
The US Treasury actives curve remains upward sloping, albeit at lower yields across the curve.
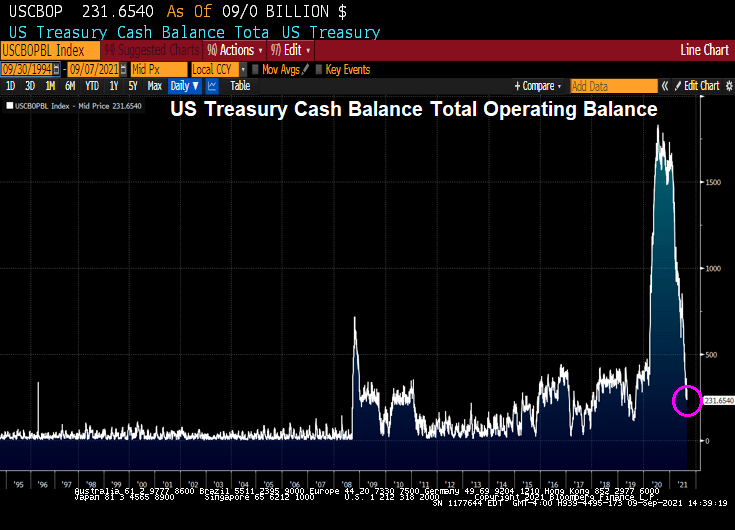
Meanwhile, Treasury Secretary Janet Yellin’ is fear-mongering about a possible US debt default. True, US Treasury cash balance has declined to $231 billion.
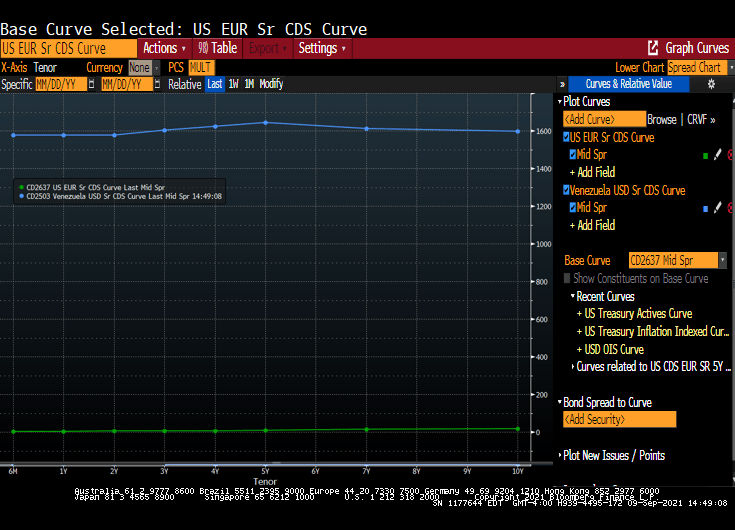
Will Congress pass a budget and fill the Treasury coffers will lots of money? Of course. Here is the US CDS curve compared to Venezuela’s CDS curve. The US curve is close to zero while Venezuela’s at near 1,600 across tenors.


You must be logged in to post a comment.