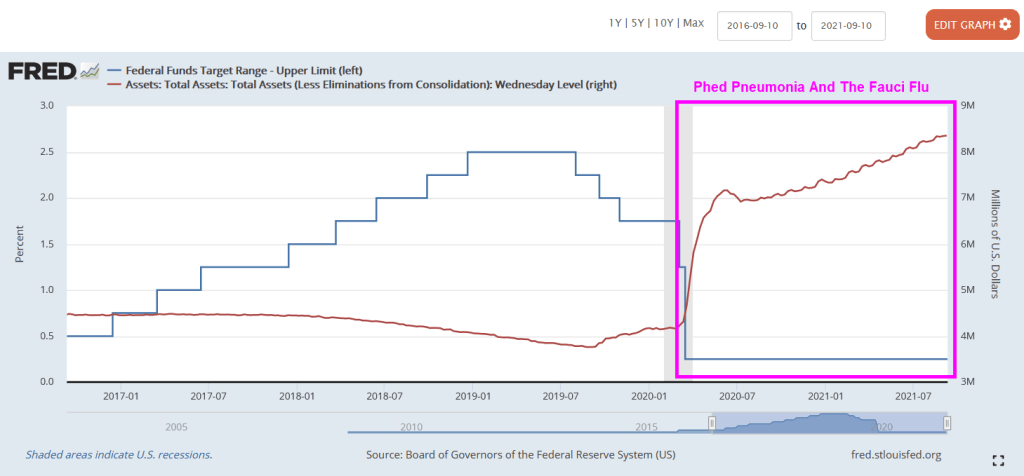
Since the Covid outbreak in early 2020, The Federal Reserve lowered their target rate and super-spiked their balance sheet. Helping to lower bank deposit rates to near zero.
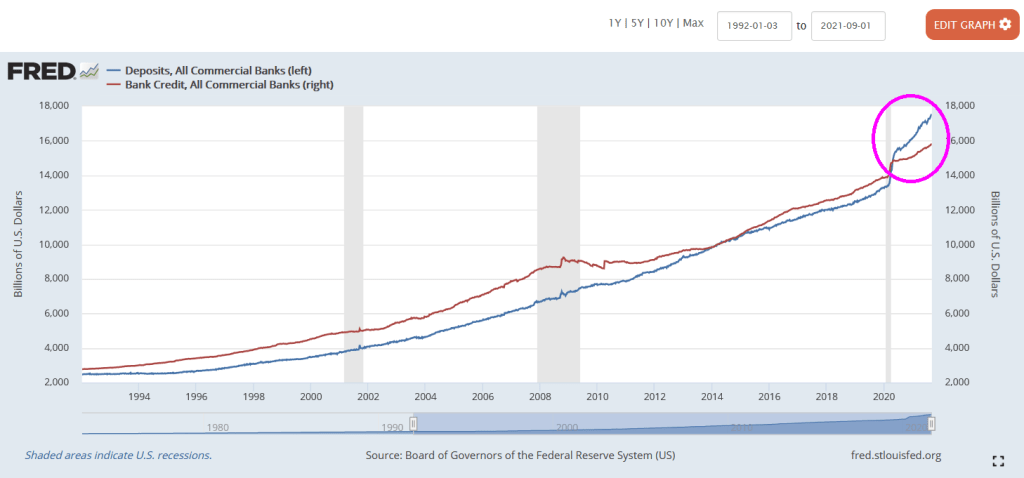
But despite near zero bank deposit rates, we seeing bank deposits are larger than bank credit such as commercial and industrial loans, residential mortgages loans, car loans, etc. Normally, bank credit EXCEEDS bank deposits.
The problem? One of them is negative growth in commercial and industrial lending. It declined 13.5% YoY in August. Of course, The Federal government extended emergency business loans that were counted as C&I loans, hence the spike in C&I loan growth in May 2020. But now we are seeing a real slowdown in C&I lending.
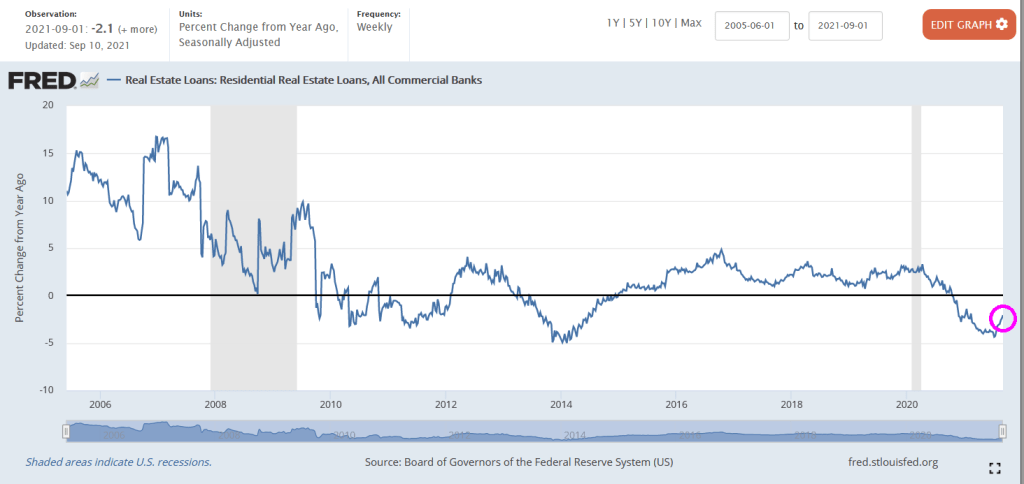
Residential lending is down 2.1% YoY as of September 10 (for August).
Commercial real estate lending? At least it is growing at a 2.9% YoY pace for August.
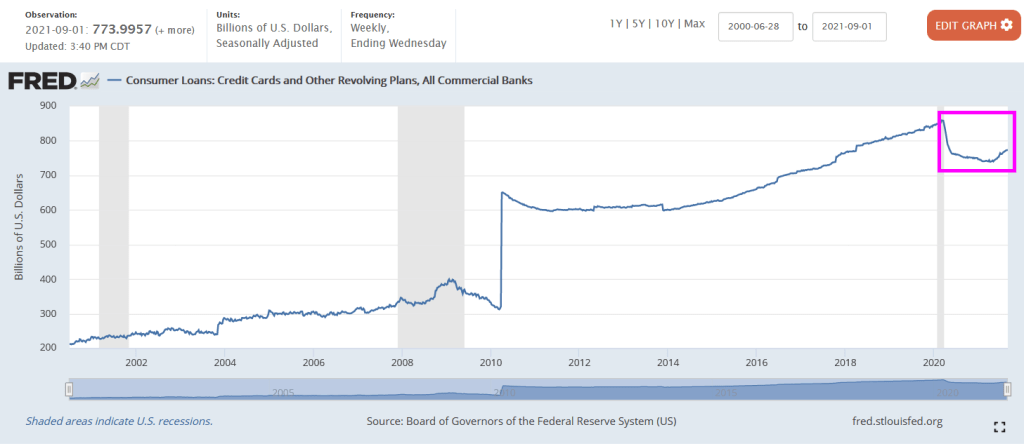
Credit cards and other revolving plans increase steadily since 2014 and then declined after the Fauci Flu struck. But credit cards and revolving credit has started to rise again.
The Fed’s massive overreaction to Covid caused a storm surge in C&I lending that has subsided. But other bank lending has slowed as well.
Lots of bank assets with nowhere to go.
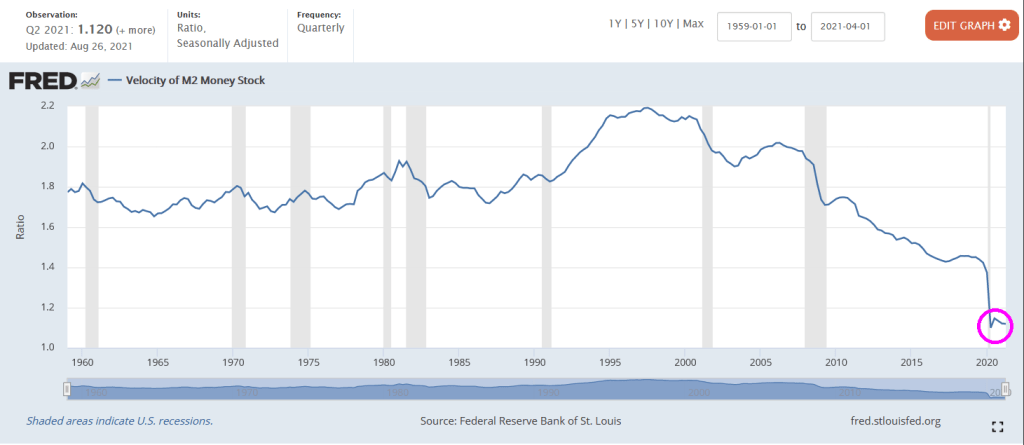
No wonder M2 Money Velocity (GDP/M2 Money) is at historic lows.
Remember, Federal Reserve Chair Jerome Powell is up for reappointment and President Biden must make a decision on his reappointment.
Face it, the 30-year Treasury market is not as interesting as widely-traded as the 10-year Treasury market. But we did see some interesting revelations in today’s 30 year Treasury auction.
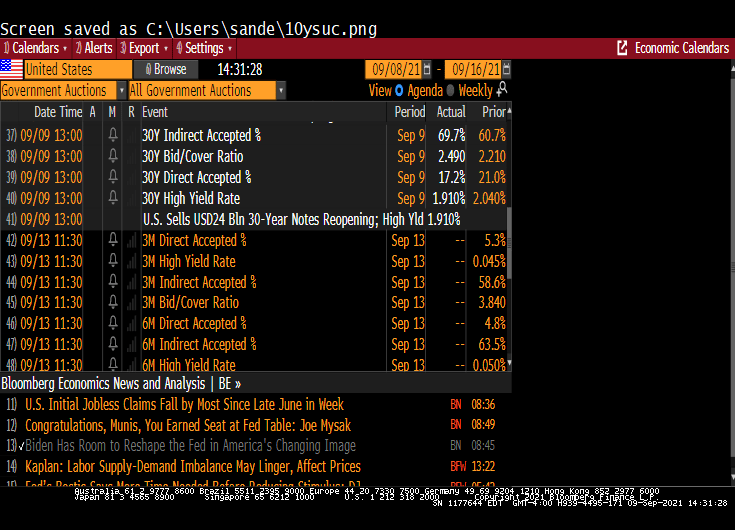
If yesterday’s 10Y auction was blockbuster, one of the strongest benchmark sales on record, then today’s $24 billion offering of 30Y paper – the last coupon auction of the week – was nothing short of spectacular.
Printing at a high yield of just 1.910%, the auction not only stopped at the lowest yield since January’s 1.825%, but also stopped through the When Issued by a whopping 1.8bps, the most since April and ended 4 consecutive months of tails in the 30Y tenor.
The bid to cover of 2.486 was not only a big jump from last month’s 2.208 but also the highest since the 2.500% in July 2020, and far above the six-auction average of 2.276.
The bid-to-cover ratio is the dollar amount of bids received in a Treasury security auction versus the amount sold. The bid-to-cover ratio is an indicator of the demand for Treasury securities. A high ratio is an indication of strong demand.
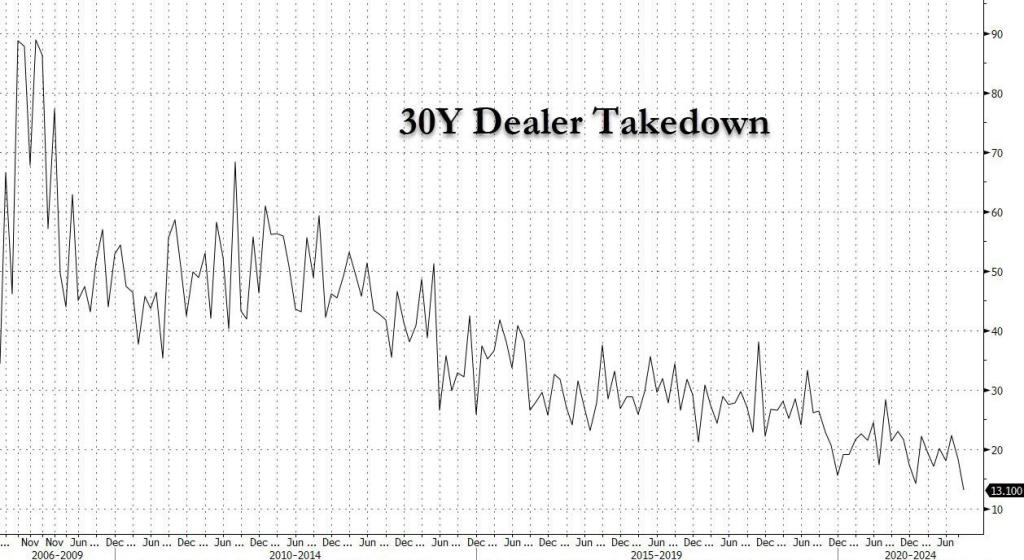
Primary dealers are responsible for absorbing any supply not bought by direct or indirect bidders. Indirect bidders, which include fund managers and foreign central banks. Dealer takedown of the 30Y Treasury is historically low.
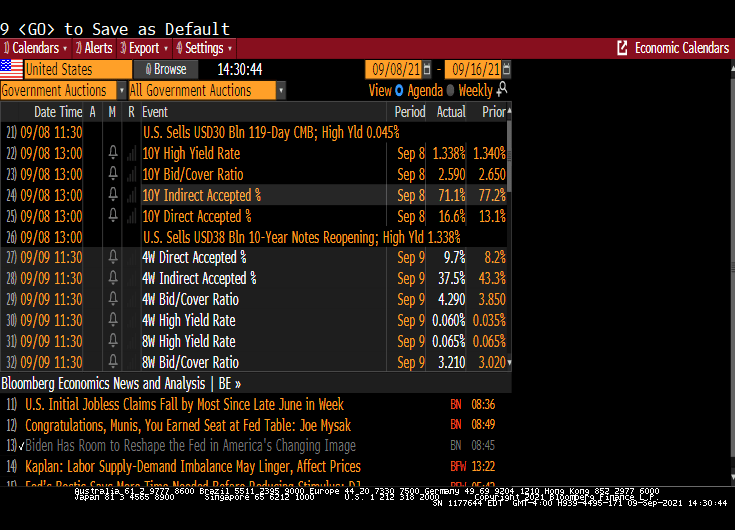
The 10-year auction was similar in that the high rate fell. But the bid-to-cover declined.
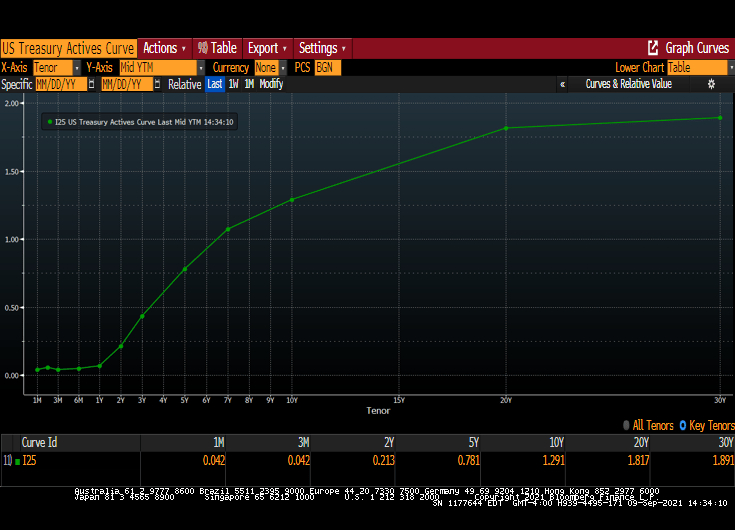
The US Treasury actives curve remains upward sloping, albeit at lower yields across the curve.
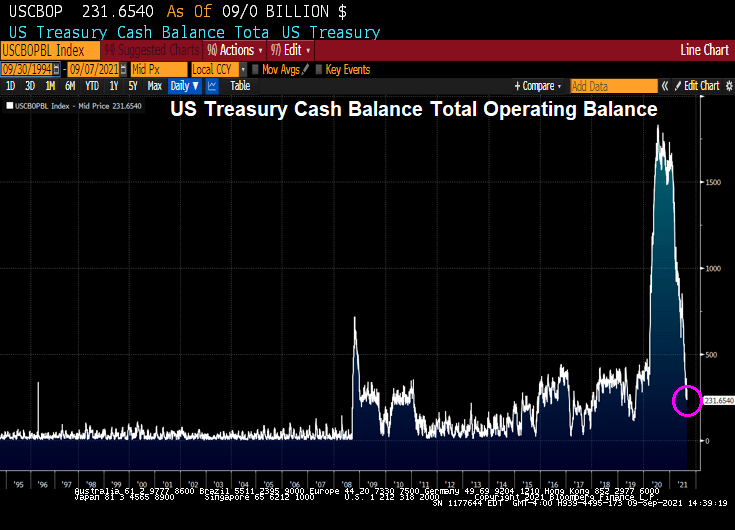
Meanwhile, Treasury Secretary Janet Yellin’ is fear-mongering about a possible US debt default. True, US Treasury cash balance has declined to $231 billion.
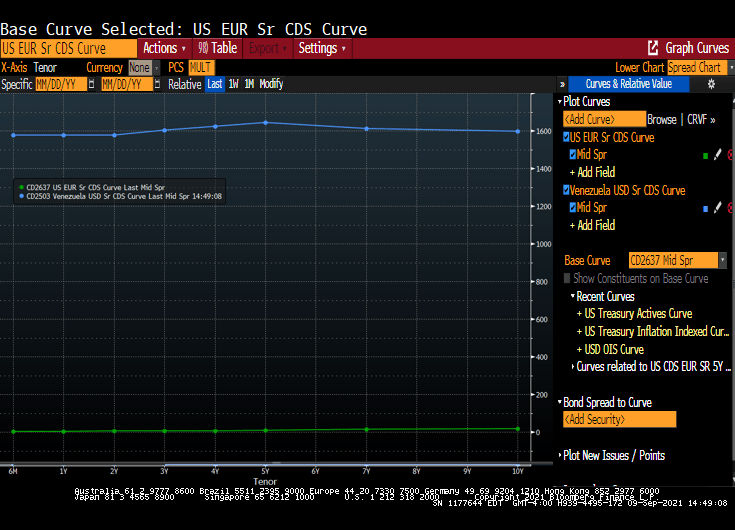
Will Congress pass a budget and fill the Treasury coffers will lots of money? Of course. Here is the US CDS curve compared to Venezuela’s CDS curve. The US curve is close to zero while Venezuela’s at near 1,600 across tenors.
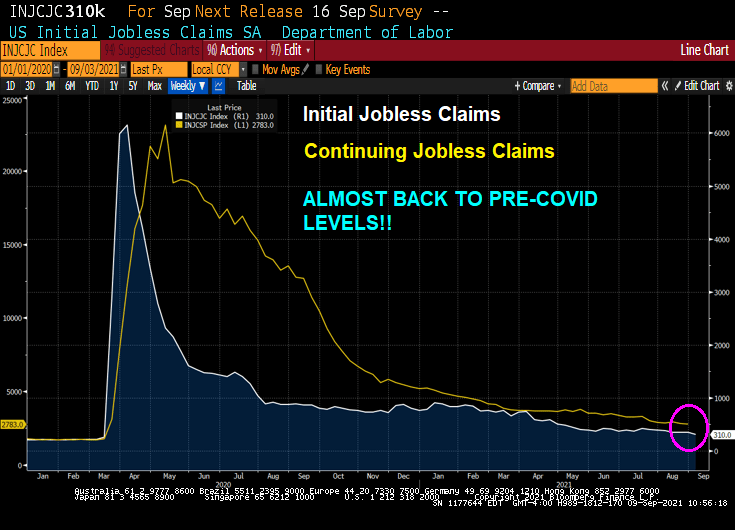
Covid struck in early 2020 and The Fed spiked the punchbowl with a massive surge in M2 Money. Like a storm surge.
Today’s unemployment report showed initial jobless claims and continuing jobless claims ALMOST at pre-Covid levels.
So it appears that The Fed’s job is done (under the assumption that The Fed had anything to do with the recovery).
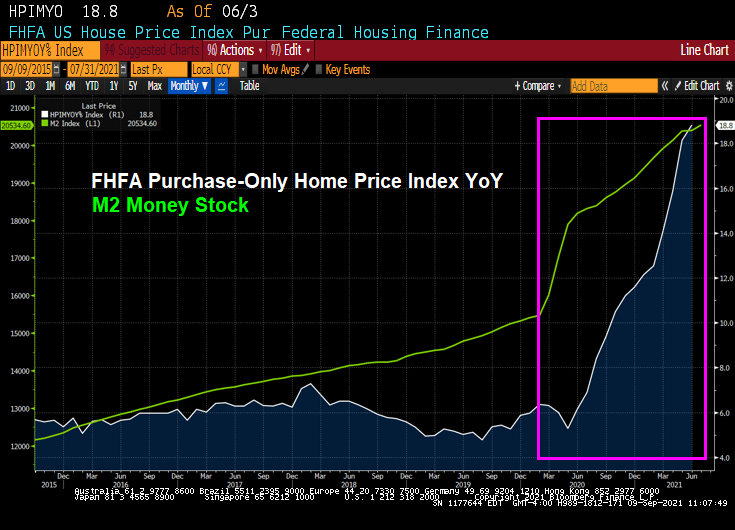
So did The Fed almost violently overreact to the Covid crisis? The Atlanta Fed’s Raphael Bostic says it is too early to withdraw while St Louis Fed’s James “Bully” Bullard says it is time to taper.
Really Raph? 18.8% price growth is not enough for you?
Economic growth downshifted slightly to a moderate pace in early July through August. The stronger sectors of the economy of late included manufacturing, transportation, nonfinancial services, and residential real estate. The deceleration in economic activity was largely attributable to a pullback in dining out, travel, and tourism in most Districts, reflecting safety concerns due to the rise of the Delta variant, and, in a few cases, international travel restrictions.
The other sectors of the economy where growth slowed or activity declined were those constrained by supply disruptions and labor shortages, as opposed to softening demand. In particular, weakness in auto sales was widely ascribed to low inventories amidst the ongoing microchip shortage, and restrained home sales activity was attributed to low supply.
Growth in non-auto retail sales slowed a bit in some Districts, rising at a modest pace, on balance, across the nation.
Residential construction was up slightly, on balance, and nonresidential construction picked up modestly.
Trends in loan volumes varied widely across Districts, ranging from down modestly to up strongly.
Reports on the agriculture and energy sectors were mixed across Districts but, on balance, positive.
Looking ahead, businesses in most Districts remained optimistic about near-term prospects, though there continued to be widespread concern about ongoing supply disruptions and resource shortages.
Employment and Wages:
All Districts continued to report rising employment overall, though the characterization of the pace of job creation ranged from slight to strong.
Demand for workers continued to strengthen, but all Districts noted extensive labor shortages that were constraining employment and, in many cases, impeding business activity.
Contributing to these shortages were increased turnover, early retirements (especially in health care), childcare needs, challenges in negotiating job offers, and enhanced unemployment benefits.
Some Districts noted that return-to-work schedules were pushed back due to the increase in the Delta variant.
With persistent and extensive labor shortages, a number of Districts reported an acceleration in wages, and most characterized wage growth as strong—including all of the midwestern and western regions.
Several Districts noted particularly brisk wage gains among lower-wage workers.
Employers were reported to be using more frequent raises, bonuses, training, and flexible work arrangements to attract and retain workers.
Prices:
Inflation was reported to be steady at an elevated pace, as half of the Districts characterized the pace of price increases as strong, while half described it as moderate.
With pervasive resource shortages, input price pressures continued to be widespread.
Most Districts noted substantial escalation in the cost of metals and metal-based products, freight and transportation services, and construction materials, with the notable exception of lumber whose cost has retreated from exceptionally high levels.
Even at greatly increased prices, many businesses reported having trouble sourcing key inputs.
Some Districts reported that businesses are finding it easier to pass along more cost increases through higher prices.
Several Districts indicated that businesses anticipate significant hikes in their selling prices in the months ahead.
Here are the highlights by Regional Feds:
Boston: Economic activity in the First District expanded at a modest to strong pace over the summer of 2021. Contacts reported higher prices and wages but complained more about an inability to get supplies and to hire workers. Contacts were optimistic and hoped supply issues would ease in 2022.
New York: Growth in the regional economy moderated, though contacts remained optimistic about the near-term outlook. Employment and wages increased, with businesses reporting widespread labor shortages. Tourism leveled off, and service-sector businesses reported some deceleration in activity. Input price pressures remained widespread, and more businesses have raised or plan to raise their selling prices.
Philadelphia: Business activity continued at a moderate pace of growth during the current Beige Book period – still below levels attained prior to the pandemic. The rise of Delta variant cases has trimmed growth in some sectors, while labor shortages and supply chain disruptions continued apace. Overall, wage growth increased to a moderate pace, while prices continued growing moderately and employment continued to grow modestly.
Cleveland: Economic activity grew solidly, but supply constraints limited many firms’ ability to meet demand. Staff levels increased modestly amid intense labor shortages. Reports of rising nonlabor costs, wages, and prices continued to be widespread. Firms expected demand would remain strong in the near term, but they were less optimistic that labor and supply challenges would abate enough to ease the upward pressure on wages and costs.
Richmond: The regional economy expanded moderately, but many firms faced shortages and higher costs for both labor and non-labor inputs. Port and trucking volumes picked up from already high levels, but manufacturers and services firms experienced delays and long lead times for goods. Employment rose moderately as labor shortages and wage increases were widely reported. Price growth picked up and was robust compared to last year.
Atlanta: Economic activity expanded moderately. Labor markets improved and wage pressures became more widespread. Some nonlabor costs rose. Retail sales increased. Leisure travel was strong and hotel occupancy levels rose. Residential real estate demand remained solid. Commercial real estate conditions were steady. Manufacturing activity expanded. Banking conditions were stable.
Chicago: Economic activity increased moderately. Employment increased strongly, manufacturing grew moderately, business spending was up modestly, construction and real estate rose slightly, and consumer spending decreased slightly. Wages and prices increased strongly while financial conditions slightly improved. There was some retreat in prospects for agricultural income.
St. Louis: Economic conditions have continued to improve at a moderate pace since our previous report. Across all industries, contacts are concerned about the Delta variant and its economic impact. Contacts continued to report that labor and material shortages. Overall inflation pressures remain elevated, but firms reported varying degrees of pass-through to customers.
Minneapolis: The District economy saw moderate growth despite continued inventory shortages and higher prices. Employment grew strongly but hiring demand continued to outstrip labor response by a wide margin. Consumer demand remained strong, leveraging growth in services, tourism, and manufacturing. Drought took a growing toll on agriculture, though higher prices benefited farmers. Minority and women-owned business enterprises saw moderate growth in activity.
Kansas City: Economic activity continued to grow at a moderate pace through August. Demand remains elevated for most businesses, and a majority of contacts expect activity to remain elevated amid the recent surge in COVID cases. Wages grew at a robust pace, but labor shortages persist. As a result of widespread drought, pasture and range land in several states was in poor or very poor condition.
Dallas: The District economy expanded at a solid rate, with broad-based growth across sectors. Employment growth was robust, with a pickup seen in the service sector. Wage and price growth remained elevated amid widespread labor and supply chain shortages. Outlooks stayed positive, though surging COVID-19 cases has added uncertainty to outlooks.
San Francisco: Economic activity in the District expanded moderately. Hiring activity intensified further, as did upward pressures on wages and inflation. Retail sales increased modestly, while conditions in the services sector deteriorated somewhat. Activity in the manufacturing and agriculture sectors increased slightly. Residential construction edged down somewhat, while lending activity remained largely unchanged.
As Milton Friedman once said, “If you put The Federal Government in charge of the Sahara Desert, in 5 years there would be a shortage of sand.” And The Fed is no slouch at creating shortages either.
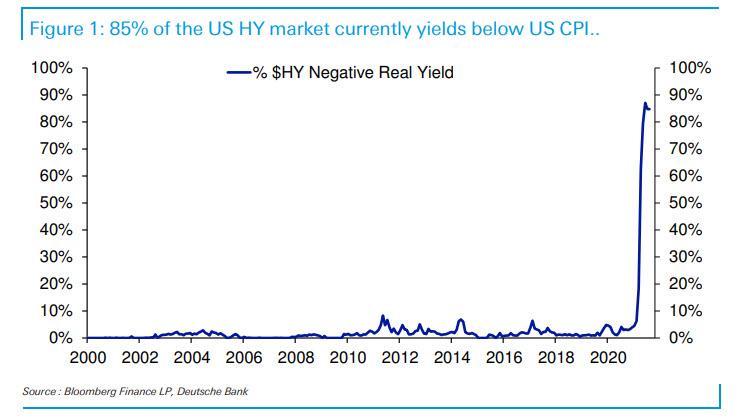
According to Deutsche Bank, 85% of the US High Yield market has a yield below the current rate of inflation.
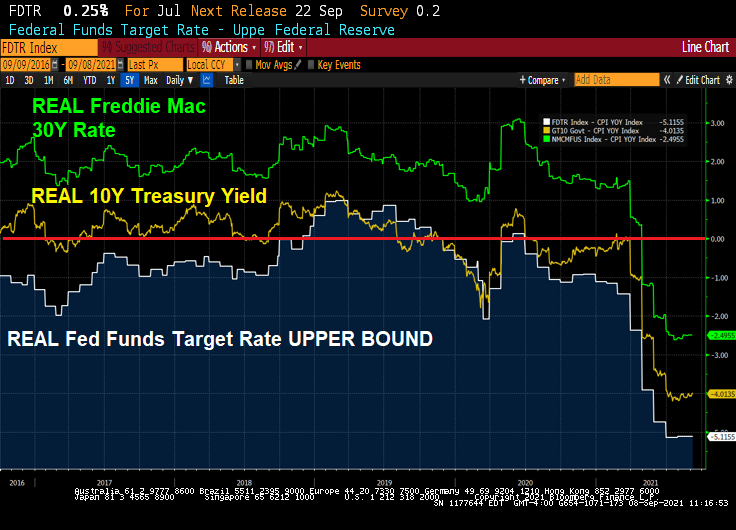
Its not only high-yield bonds that have negative REAL yields, but even The Fed Funds Target rate is negative at -5.12%. The real 10-year government bond yield is -4.01% and the REAL Freddie Mac 30-year mortgage survey rate is -2.5%.
What if inflation is actually transitory like The Federal Reserve has been saying? Or is The Fed really telling us about an impending economic slowdown after the Fed’s and Federal government stimulypto wears off?
Iron ore prices have slowed noticeably after peaking earlier this year. Lumber futures (random length) have crashed to pre-Covid levels.
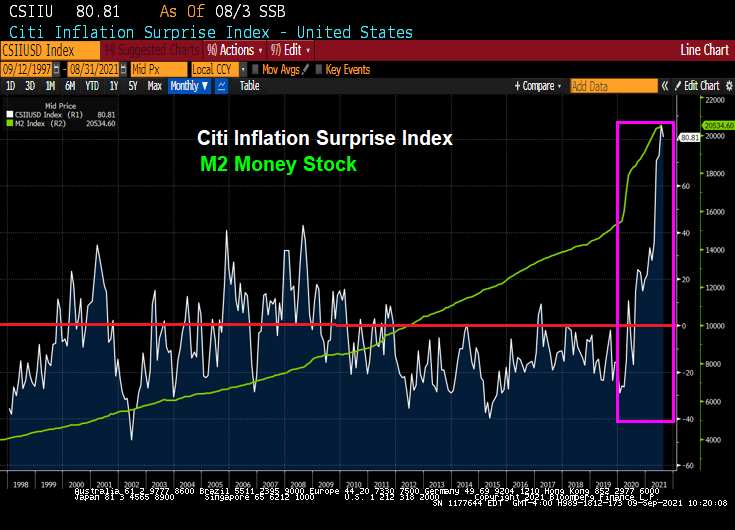
On the other hand, food stuffs and raw industrials remain elevated, but the growth in price has stalled (see pink box).
President Biden, aka The Kabul Klutz, is now recommending tax increases as a result of the terrible jobs report from Friday. Rather than focus on The Fed’s monetary stimulus not working for the labor market.
The problem with fiscal stimulus is that the debt lasts forever but the GDP effects are short-lived. And The Fed is a crazy train.
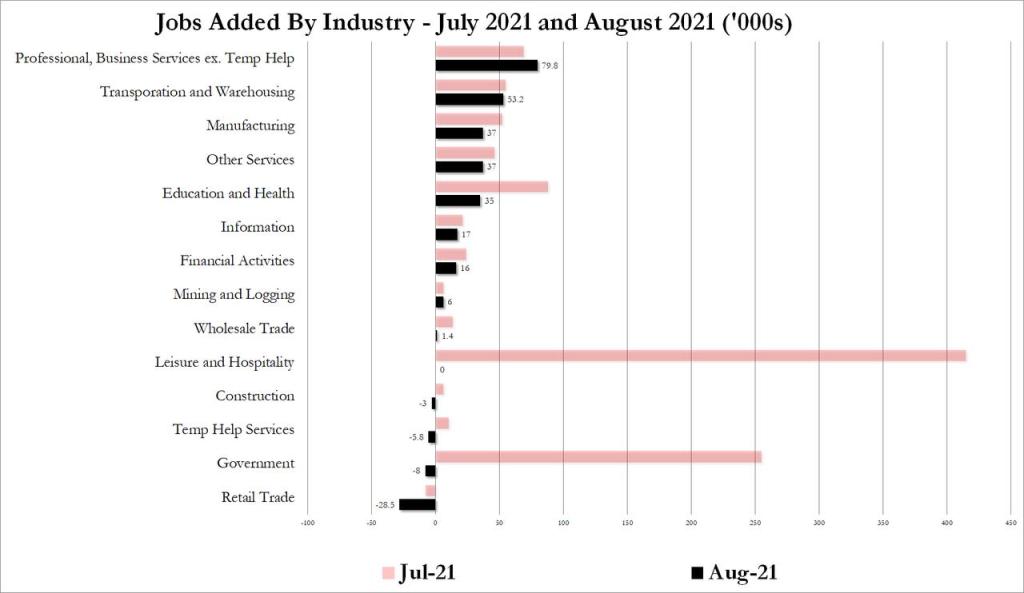
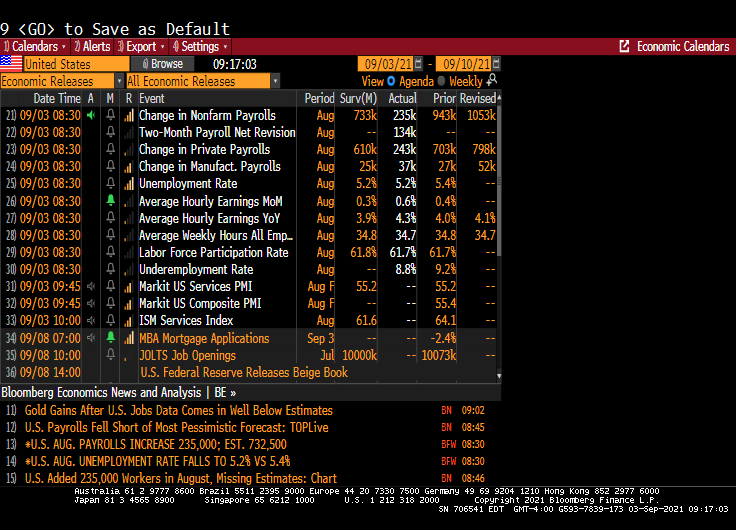
Well, after the dismal ADP print we knew that the August jobs numbers would be worse than imaginable. And they were!
A big miss on the topline job creation number — the establishment survey suggested only 235,000 jobs were created in August, versus expectations for 733,000 — has undercut what little chance there was left of a Fed announcement on tapering later this month. It should make for a very interesting debate among policy makers about forward momentum in the labor market.
The shocker was in the leisure and hospitality sector, which created zero new jobs on net in August after figures of around 400,000 in each of the previous two months. There was a dip in hiring in other service sectors too, but nowhere near as significant. That could perhaps be due to some early impact from the spread of the delta variant in recent weeks.
On the household survey, the numbers looked better. According to those figures, the unemployment rate fell to 5.2%, in line with estimates, thanks to a 509,000 increase in reported employment. That also propelled the prime working-age employment to population ratio to 78%, from 77.8% in July.
Disparities narrowed in August as well, according to prime working-age EPOP ratios by race and ethnicity. Prime working-age Black EPOP, in particular, jumped to 73% from 72.2% the month before — outpacing the rest.
Equity futures pared a modest gain after the release, with contracts on the S&P 500 Index flat as of 9:09 a.m. in New York. With wages climbing, Treasury yields rose, with those on 10-year notes rising 4 basis points to 1.33%. The Bloomberg Dollar Index was down 0.3%.
The unemployment rate dropped which a misleading headline. That simply means that more people dropped out of the labor force than were unemployed. Not a good way to lower the unemployment rate.
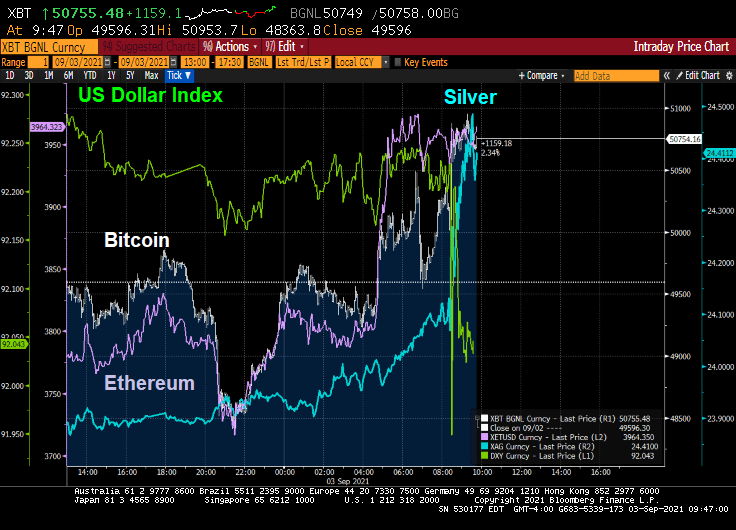
Alternative investments silver, Bitcoin and Ethereum rose on the lousy jobs report as the US Dollar dropped.
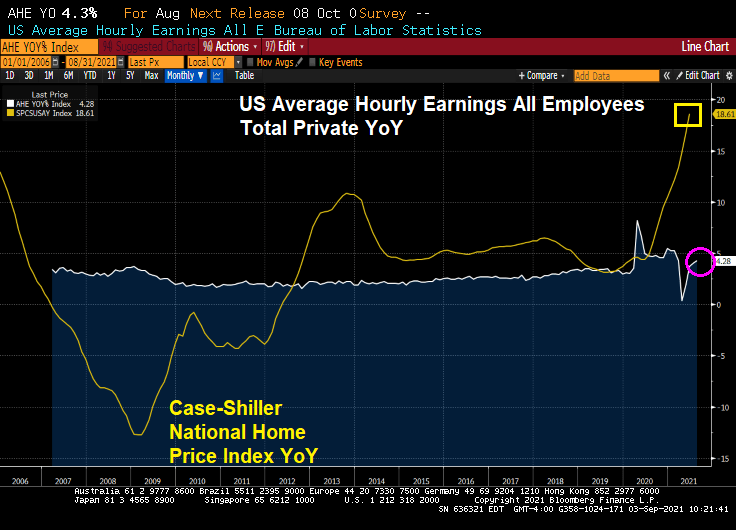
The good news? US Average Hourly Earnings All Employees Total Private YoY rose to 4.28%! The bad news? US home prices are rising at a 18.61% pace.
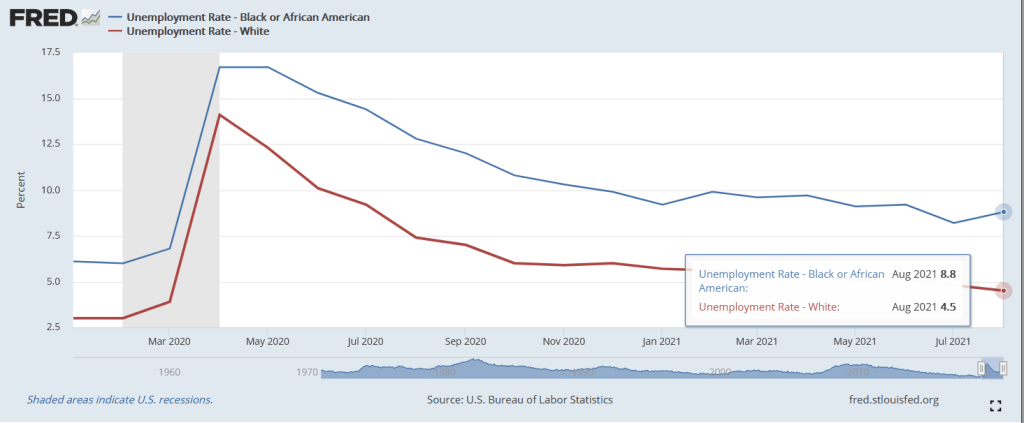
The bad news? Black unemployment rose to 8.8% in August while white unemployment fell to 4.5%. This represents a widening of the employment gap that is higher in August than pre-Covid.
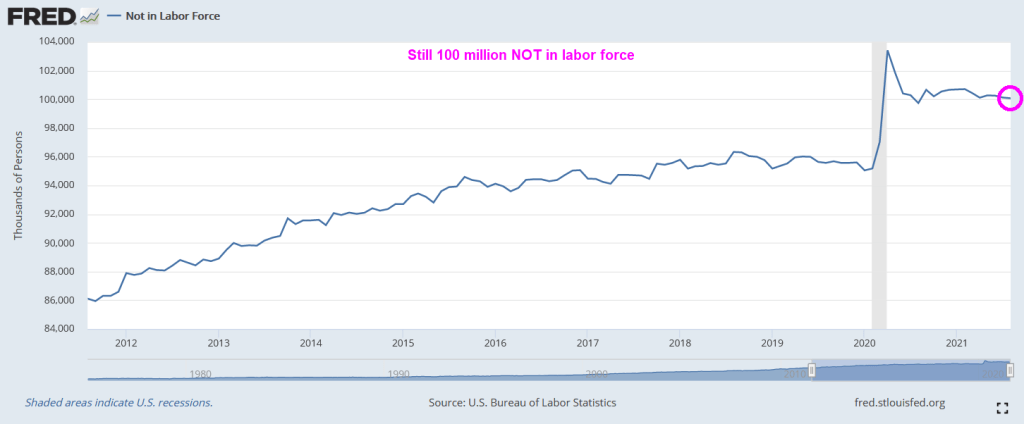
There are still over 100 million NOT in the labor force, higher than pre-Covid.
So, The Fed’s plans to begin tapering have gone up in smoke.
At the annual Jackson Hole (aka, J-Hole) Economic Symposium, Federal Reserve Chairman Jerome Powell reiterated that the Fed is in no hurry to either taper asset purchases immediately or aggressively. Additionally he made crystal clear that even when the Fed does eventually start tapering asset purchases (likely November or December), it should not be taken as signaling interest rate hikes will follow on some preset course. Indeed, Fed Chairman Powell continues to claim that inflation is transitory. Finally, he said that part of the mandate (employment) is still far from being achieved. So, expect more SNAKE JUICE.
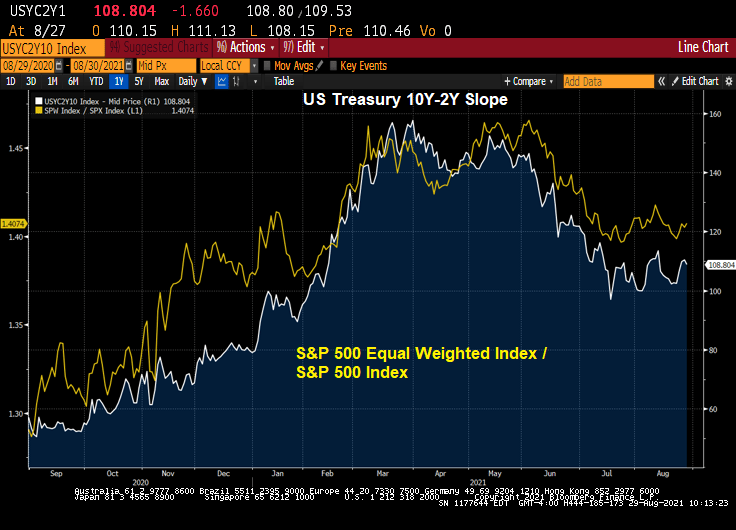
The shape of the yield curve has been highly influential recently in relative performance trends between various areas of the market. From last summer through May of this year, the steepening of the yield curve coincided with healthy outperformance of cyclical stocks. Since May, the flattening of the curve has coincided with more defensive (or at least high quality) leadership out of the tech and health care sectors. The logic goes, therefore, that a re-steepening of the curve should coincide with a shift back to cyclicals. Indeed, that shift may be in the early innings.
Let’s take a look at the US Treasury 10Y-2Y curve slope over the past twelve months against the Citi Economic Surprise Index for the US. You can see curve fatigue starting in April 2021 as the Citi Economic Surprise Index turns negative.
The the more cyclical and smaller skewed S&P 500 equal weight index has started to outperform the S&P 500 again, right on queue with the yield curve re-steepening.
Industrial stocks are under-performing the broader S&P 500 index as the curve flattens.
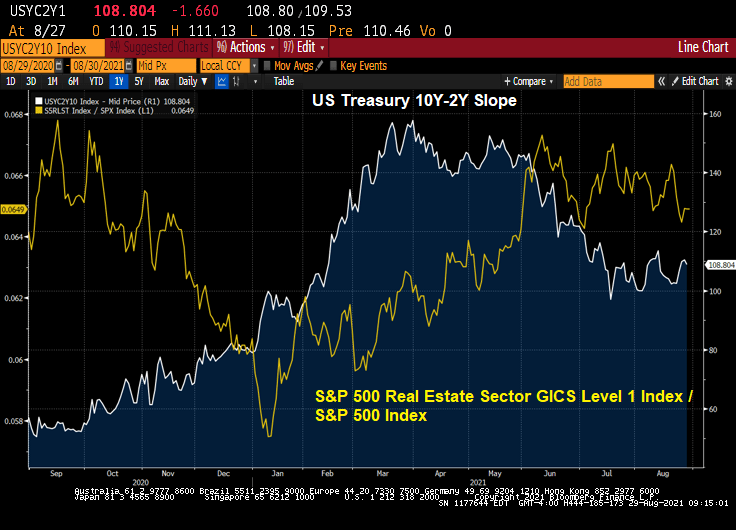
Real estate stocks? They are outperforming the broader S&P 500 index.
Mining stocks like gold mines? They are underperforming the broader S&P 500 index.
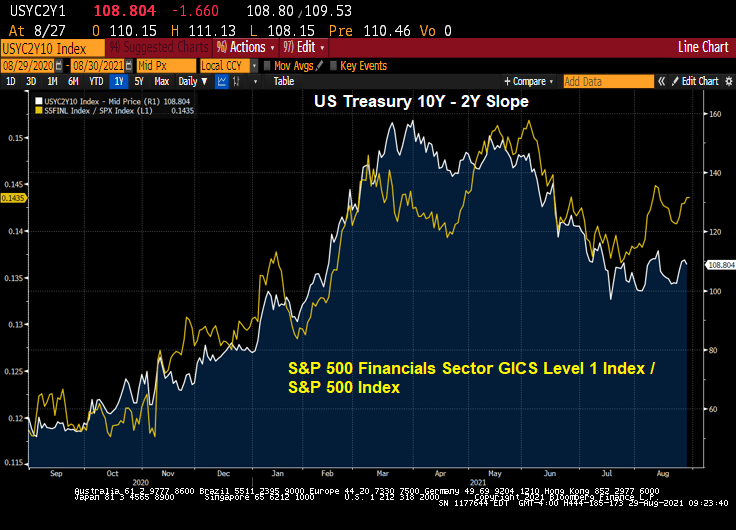
Financial stocks? Not surprisingly, The Fed’s dovish behavior is causing financial stocks to outperform the broader S&P index.
Likewise, information technology stocks are outperforming the broader S&P 500 index.
So, by Powell delaying any balance sheet slowdown and rate increases, we have clear winners (real estate, financials, information tech) and clear losers on a relative basis (industrials, retail, metals and mining).
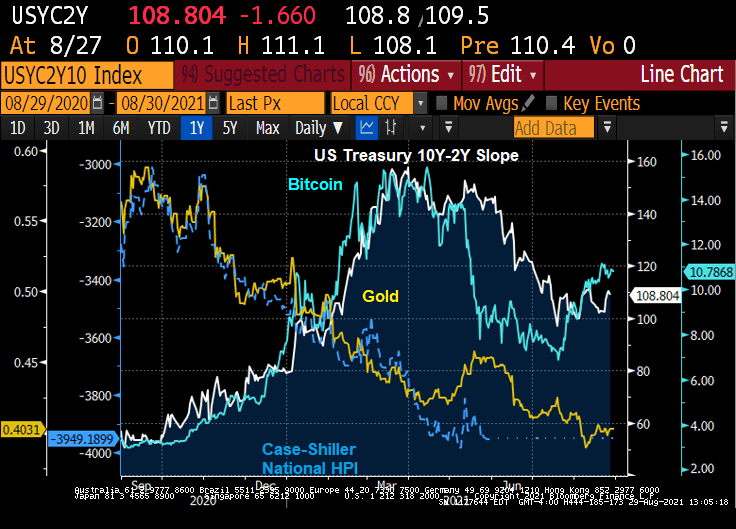
The Others! Due to volatility differences, I wouldn’t over-interpret this chart. But Bitcoin as a ratio of the S&P 500 index is “kicking ass!” Gold and housing as a ratio of the S&P 500 index seemingly can’t keep up with the S&P 500 index.
W. Scott Frame, Brian Greene, Cindy Hull and Joshua Zorsky August 26, 2021
The Federal Reserve quickly responded to significant financial market disruption at the onset of the COVID-19 pandemic in March 2020, providing stability in a variety of ways. This included large-scale purchases of U.S. Treasuries and agency mortgage-backed securities (MBS).
While market functioning improved in the subsequent months, the central bank has continued purchasing these assets to maintain smooth functioning as well as to help foster accommodative financial conditions. We explore the Federal Reserve’s purchases of agency MBS—mortgage bonds guaranteed by Ginnie Mae, Fannie Mae and Freddie Mac—and related market dynamics during the pandemic, including why mortgage rates fell to historic lows.
Agency MBS and Mortgage Prepayment
The market for agency MBS is among the largest fixed-income markets in the world ($7.6 trillion) and acts as the benchmark for pricing fixed-rate home mortgages eligible for agency guarantees.
These securities distribute monthly principal and interest payments due on underlying mortgages to investors. While agency MBS investors are shielded from credit risk by government guarantees, they do face prepayment risk.
Homeowners with fixed-rate mortgages make principal and interest payments each month based on a predetermined amortization schedule. However, the borrower has the option to pay down additional mortgage principal at any time. (This usually occurs when the borrower refinances the loan or sells the home.) The initial value of this prepayment option is reflected in the borrowers’ mortgage interest rate and is passed through to the agency MBS investor.
Large declines in mortgage rates can result in a sizeable swath of fixed-rate mortgage borrowers with refinancing options “in-the-money.” When this happens, there is an expectation of a rapid decline in existing higher coupon-rate agency MBS balances due to prepayments and a corresponding increase in the issuance of new securities with lower coupon rates.
Evolution of Federal Reserve Policy and Purchases
As the pandemic’s economic impact unfolded, the Federal Open Market Committee (FOMC) announced on March 15, 2020, it would increase agency MBS holdings by at least $200 billion, plus reinvest all principal payments received. This directive was amended a week later to uncap purchases.
The FOMC modified its approach at its June 2020 meeting, increasing agency MBS holdings to around $40 billion per month plus reinvestments, a policy that remains in place. (More information on FOMC directives during 2020 is summarized in the Federal Reserve Bank of New York’s Annual Report on Open Market Operations.) From March 2020 through June 2021, the Federal Reserve increased its agency MBS holdings from $1.4 trillion to $2.3 trillion.
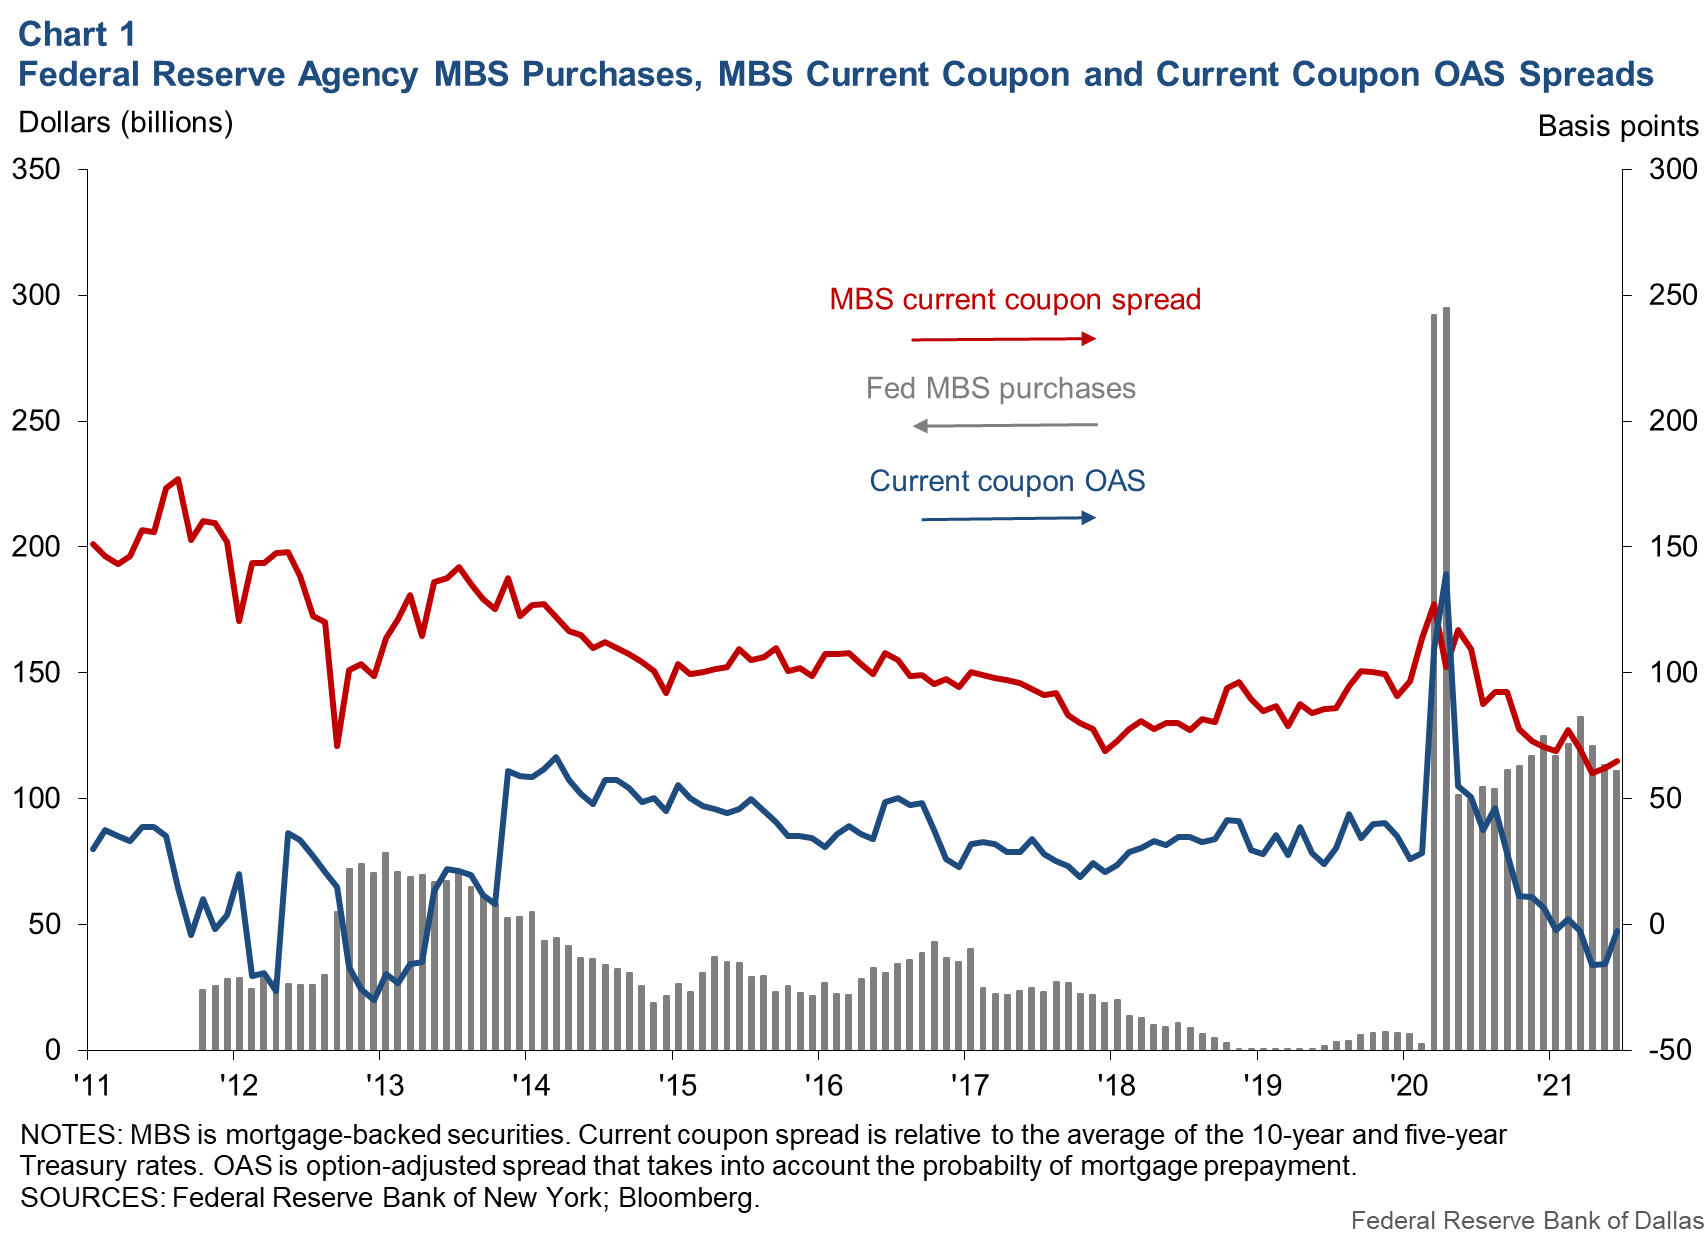
Chart 1 presents the Federal Reserve’s monthly gross purchases of agency MBS over the past decade and the MBS current coupon spread, or the yield consistent with a par value security, less the average of the five-year and 10-year Treasury yields.
The central bank purchased a total $580 billion in agency MBS during the two-month period of March–April 2020, and since has averaged about $114 billion per month including reinvestment of principal payments. During this time, the current coupon spread has steadily narrowed to its tightest levels in almost a decade (62 basis points, or 0.62 percentage points, in May 2021). Primary mortgage rates have similarly fallen during this time, according to Freddie Mac survey data.
Chart 1 also includes a metric known as the current coupon option-adjusted spread (OAS), which includes the likelihood of homeowners prepaying mortgages due to changes in interest rates. The OAS is a derived risk premium that equates model-based agency MBS values (using simulations of future interest rate paths) to prices observed in the market. By accounting for interest rate variability, OAS reflects the residual compensation earned by agency MBS holders arising from noninterest-rate factors, such as the characteristics of the underlying mortgages.
While OAS is typically positive, the measure shown here—produced by Bloomberg for a hypothetical MBS priced at par—has declined steadily since March 2020 and turned negative for the first time since 2013, the only other time in the series history that this has occurred.
Taken together, the data in Chart 1 suggest that the Federal Reserve’s recent large-scale purchases of agency MBS have contributed to historically tight spreads in the secondary market.
Federal Reserve Purchases Agency MBS in Forward Market
The Federal Reserve purchases agency MBS in the to-be-announced (TBA) market, a large and liquid forward market with contracts that settle once per month based on a calendar set by the Securities Industry and Financial Market Association. The central bank typically targets its purchases on the most widely traded coupons for settlement in the following month. This is done through prescheduled auctions conducted throughout the month.
Given the forward-settling nature of the market, the volume of TBA contracts sold for a particular settlement month may not match supply available for delivery when the settlement date arrives.
To manage this mismatch and to avoid delivery failures, market participants engage in “dollar roll” transactions. A dollar roll involves the simultaneous sale (purchase) of a TBA contract for one settlement month and purchase (sale) of a TBA contract for an adjacent month. In this way, a dollar roll allows market participants to delay (bring forward) settlement of TBA contracts. The cost of this trade is reflected by the price difference between TBA contracts settling in adjacent months.
When the price of the front-month TBA becomes greater than the fair value of holding that security over the next month, it is said to be trading “special.” This may be an indication of an expected collateral shortage for the month’s settlement. Dollar roll specialness can subside if the price signal entices market participants to deliver additional collateral into the TBA market for delivery.
Federal Reserve’s Dollar Roll Sales Activity
The Federal Reserve conducts dollar rolls to aid settlement of its TBA purchases if there is a notable level of specialness. The timing and volume of these transactions depend on an internal assessment of market conditions and movements in implied financing rates.
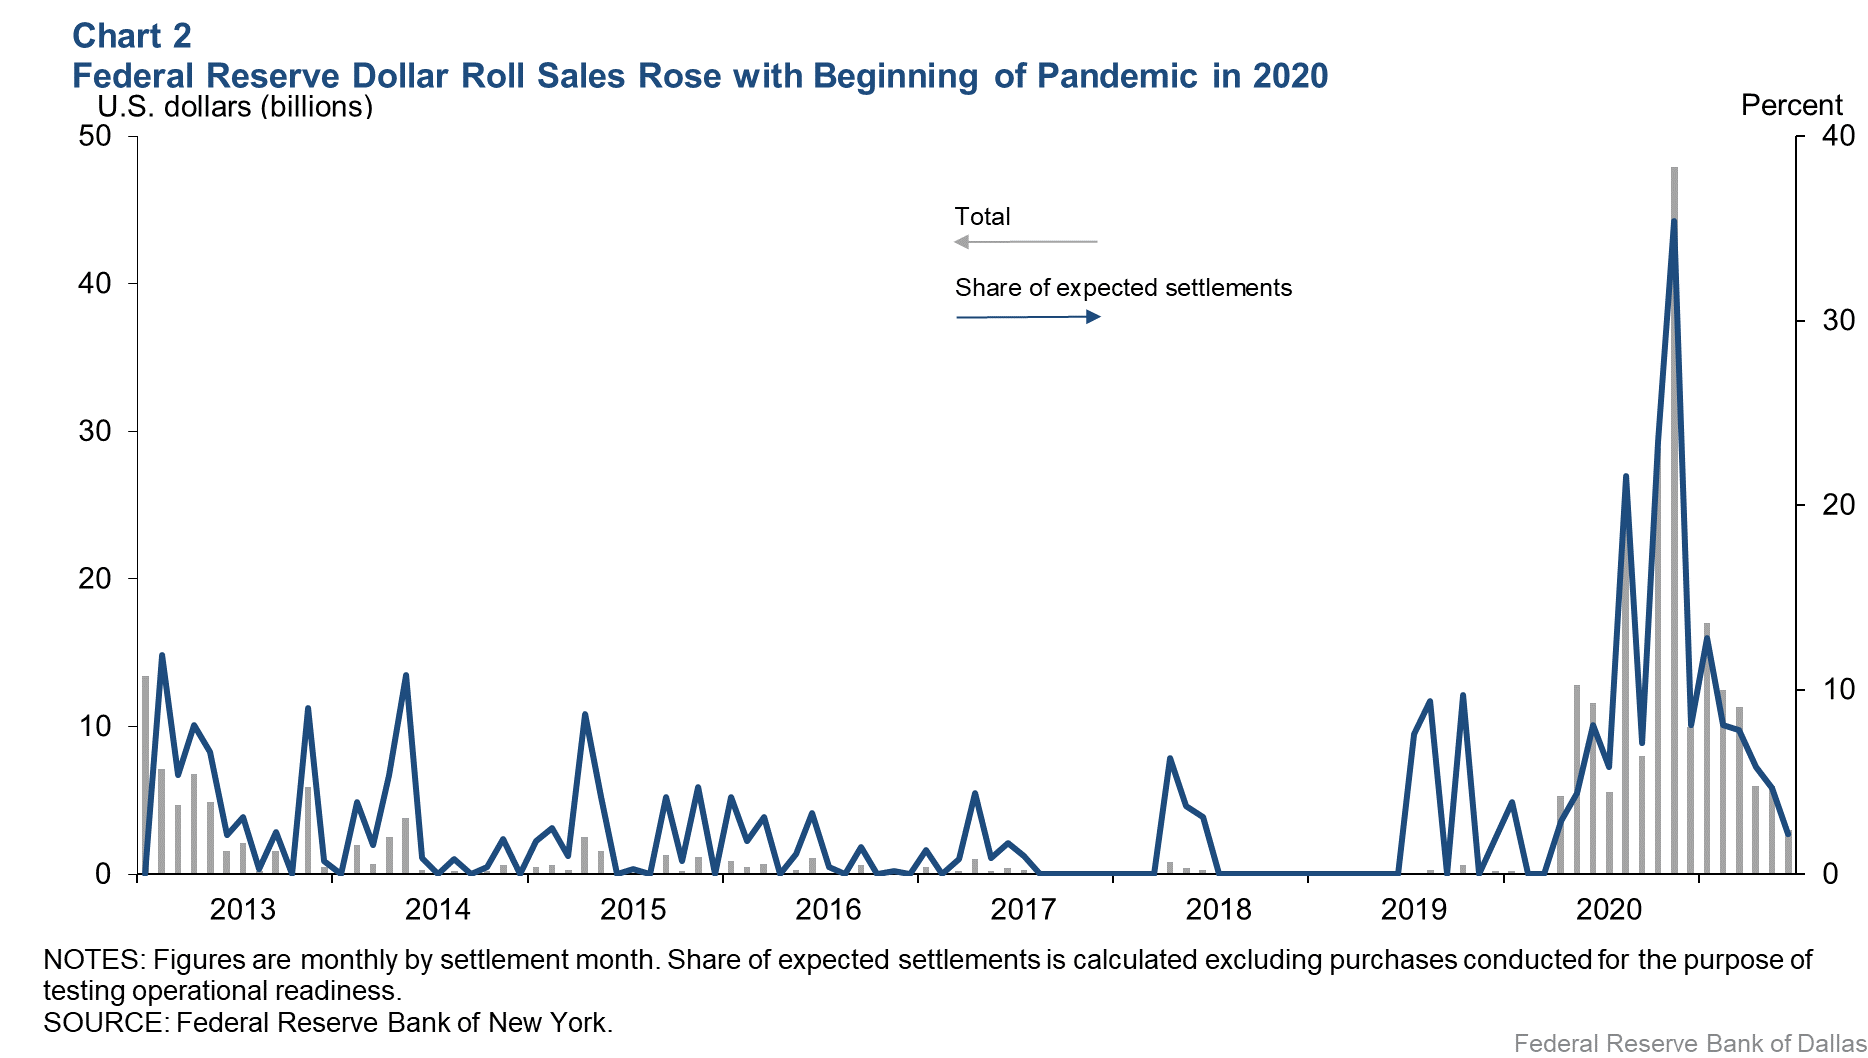
Chart 2 shows the Federal Reserve’s monthly dollar roll sales since the start of 2013 and their share of the month’s expected settlements. Expected settlements are the sum of the regular, planned purchase ($40 billion), principal reinvestments from the prior months’ paydowns and TBA contracts already held for that month’s settlement from previous dollar rolls. The central bank has consistently engaged in dollar roll transactions since April 2020, reaching a peak of $48 billion in November 2020.
The Chart 2 data beg the question of why the Federal Reserve conducted so many dollar roll sales. There are a few explanations.
First, the FOMC’s directive for monthly agency MBS purchases resulted in the central bank acquiring almost 40 percent of newly issued securities since May 2020. Moreover, the Federal Reserve’s TBA purchases were for settlement in the near month, although mortgage originators were often selling TBAs into back months. This created a timing mismatch. In response, the central bank purchased near-month TBAs from dealers, which were then often rolled for back-month settlement.
Second, commercial banks represent the only other investor base that increased its agency MBS holdings during 2020 and through first quarter 2021 ($580 billion). But banks tend not to conduct dollar roll transactions to delay settlement, owing to the nature of their business operations and accounting considerations.
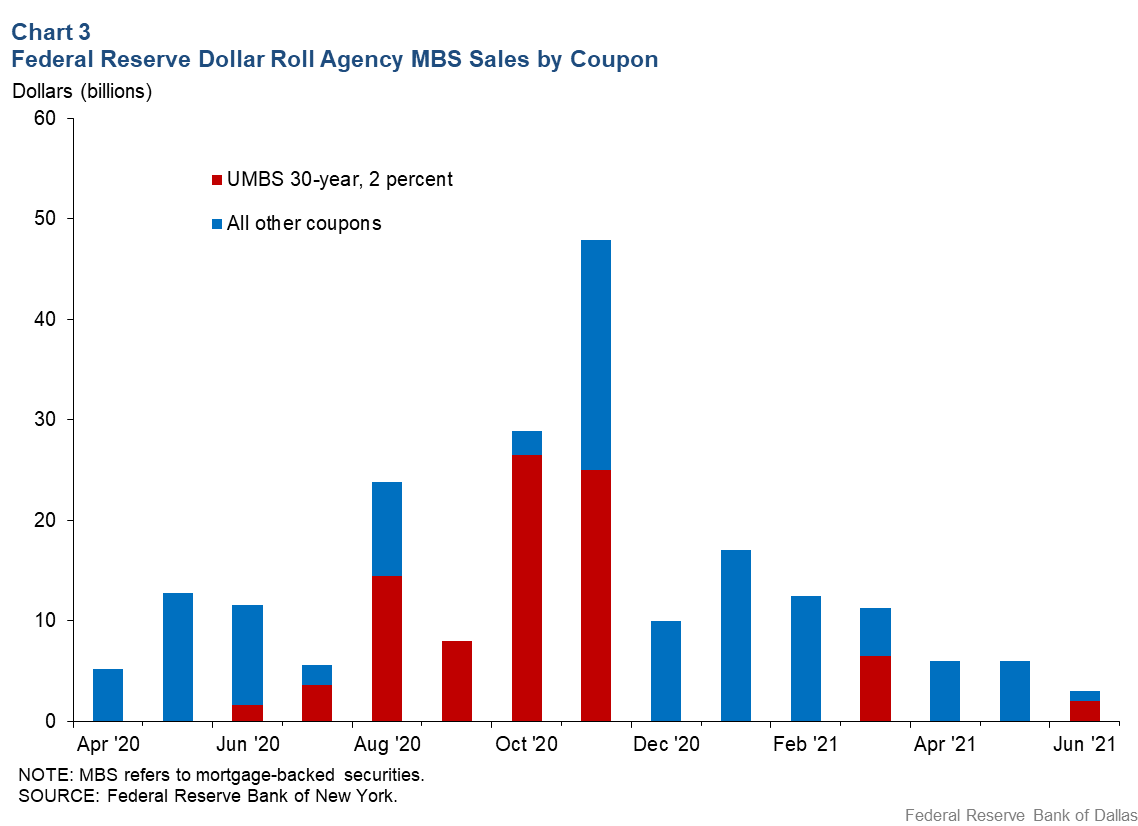
Third, the sharp decline in mortgage rates led to periods of collateral scarcity for lower coupon securities. The Fannie Mae or Freddie Mac Uniform MBS (UMBS) 30-year, 2 percent coupon provides a useful example. During the summer of 2020, mortgage originators sold the majority of TBAs forward into these securities. However, the outstanding stock of UMBS 30-year, 2 percent coupons was modest, thus limiting the ability of existing securities to be delivered for settlement. As the outstanding stock of UMBS 30-year, 2 percent securities increased, the Federal Reserve’s roll activity in the coupon declined commensurately.
Aside from the UMBS 30-year, 2 percent coupon, the Federal Reserve conducted dollar roll sales in eight other securities. This indicates that specialness was more widespread at times, although the rolling of these other coupons was more sporadic. Chart 3 presents the volume of Federal Reserve dollar roll sales for the UMBS 30-year, 2 percent coupon relative to all other TBA contracts.
The Federal Reserve’s large-scale purchases of agency MBS have likely contributed to dollar roll specialness over the course of the current purchase program. The central bank has responded by using dollar roll sales to extend the settlement of some of its TBA purchases into the future.
Tight Spreads, Low Mortgage Rates
In response to the pandemic, the Federal Reserve restarted its large-scale purchases of agency MBS and now holds more than $2.3 trillion, representing almost 30 percent of outstanding bonds. These purchases have been associated with historically tight spreads in that market, which have translated into historically low mortgage rates.
Because of periodic supply shortages, the Federal Reserve has smoothed purchases using dollar roll sales that extend settlement into the future and aid market functioning.
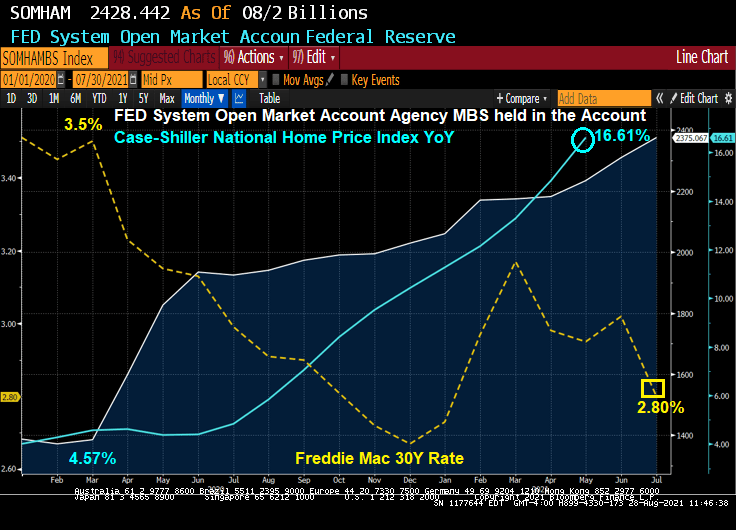
Here is the chart that The Fed Folk left out. Home price growth pre-Covid Fed surge in Agency MBS purchases was 4.57% YoY with a 30-year mortgage rate of 3.5%. The most recent Case-Shiller HPI growth rate was 16.61% and the latest Freddie Mac 30-year mortgage rate is 2.80%.
So while The Federal Reserve calmed the savage beast (mortgage markets), they also contributed to bubble-like growth in home prices.
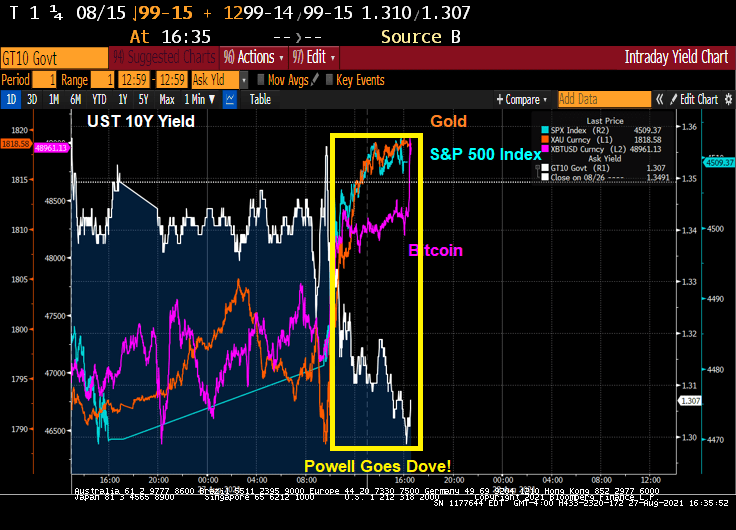
Well, I was expecting a little more guidance than Fed Chair Powell gave today at the J-Hole conference. In fact, failing to give a hard date on paring back the balance sheet and raising rates is downright dovish. A regrettable incident.
As a result of Powell’s dovish talk, GOLD, BITCOIN and the S&P500 index rose.
The S&P 500 index rose almost 1% today while the 10Y Treasury yield dropped 4 bps.


You must be logged in to post a comment.