Bad Santa! 10Y Treasury Yields Jump Above 1.60% as Expectation Of Fed Hikes Grows (Mortgage Rates Expected To Rise)

Happy New Year! And Treasuries are off to fast start with investors bailing on Treasuries and buying stocks. AND the expectation that The Fed will raise rates 3 times this year.

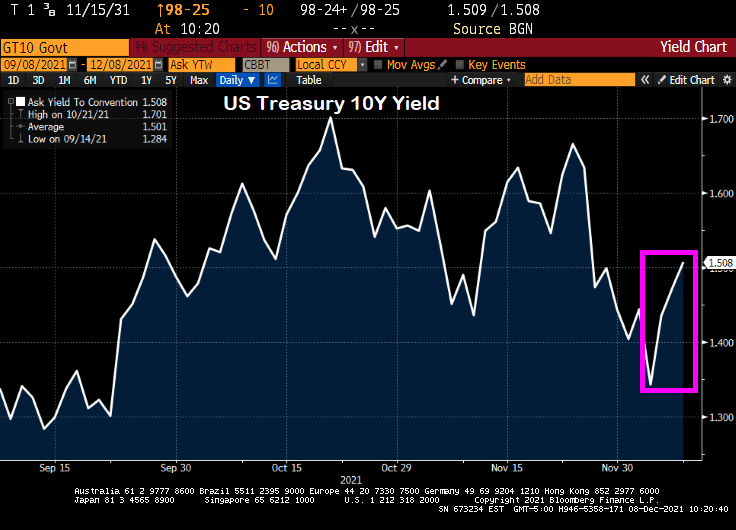
The 10-year Treasury Note yield rose above 1.60% this morning.

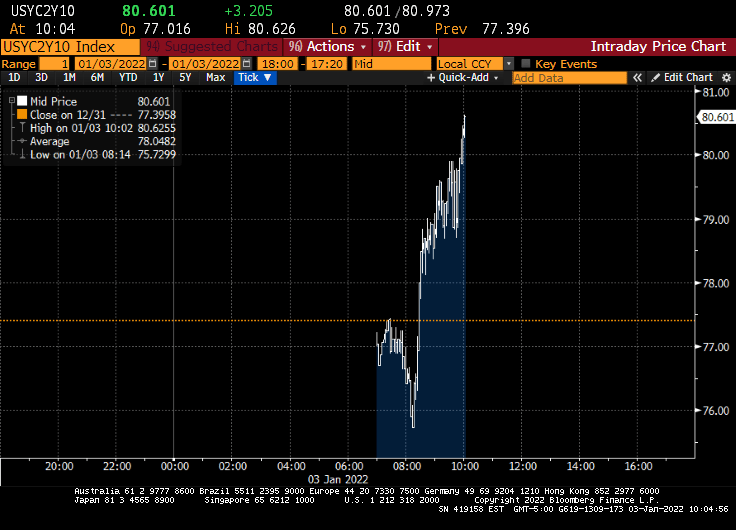
And the US Treasury 10Y-2Y curve rose to 80.601 basis points.

Fed Funds Futures data is showing 3 rates hikes in 2022. May, September and December.

The Fed Dots project is definitely showing an upward trend in the Fed Funds Target rate with FOMC member forecasting the median target rate to be above 2% by 2024.

Of course, Fed reverse repo activity grew to an all-time high (but it is expected to pare-back).

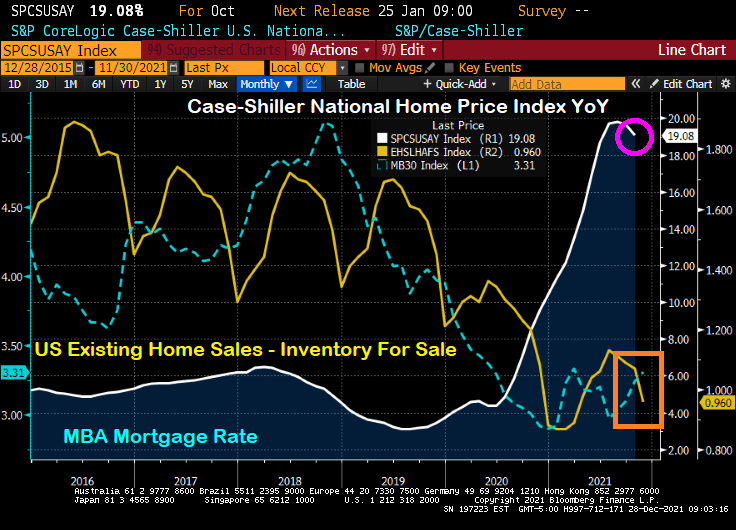
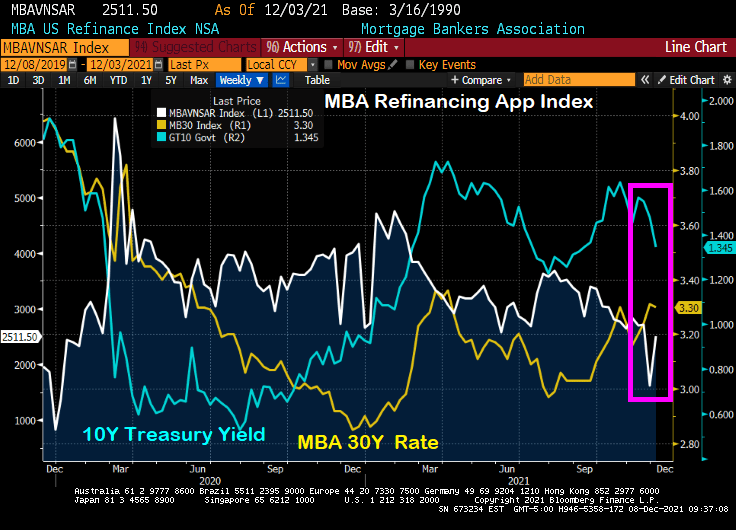
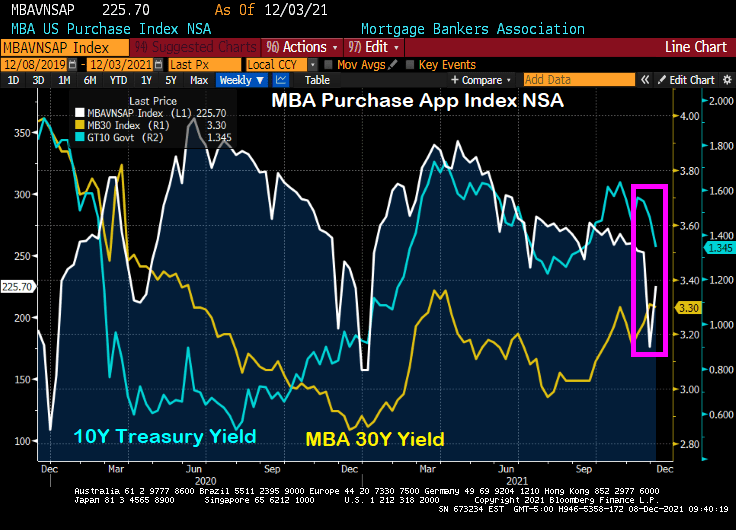
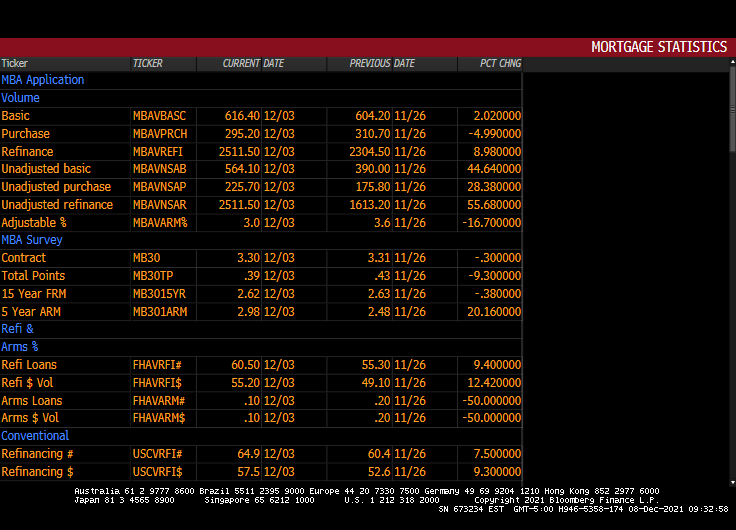
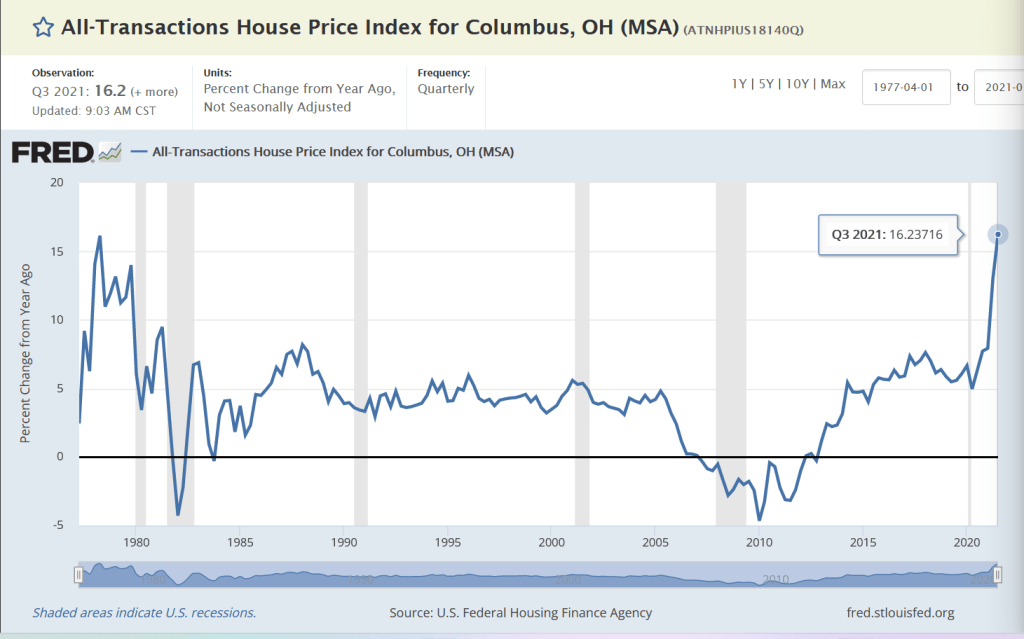
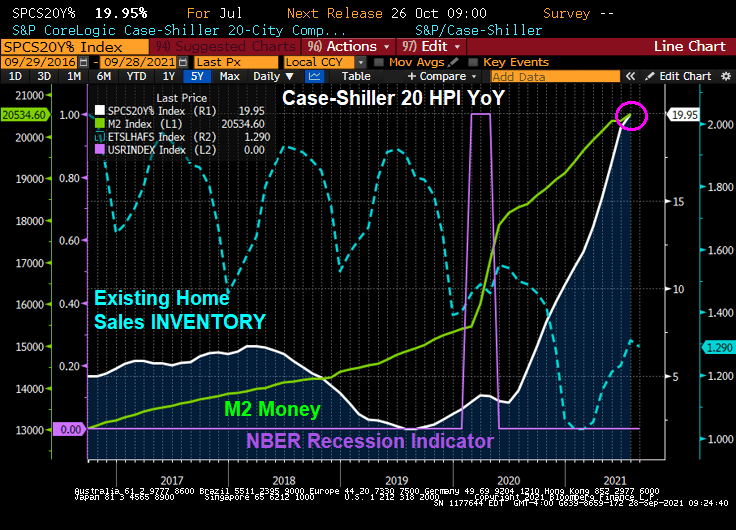
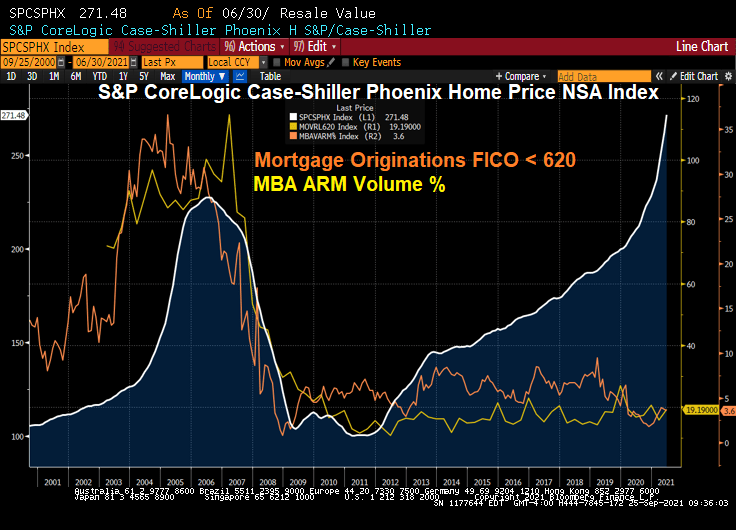
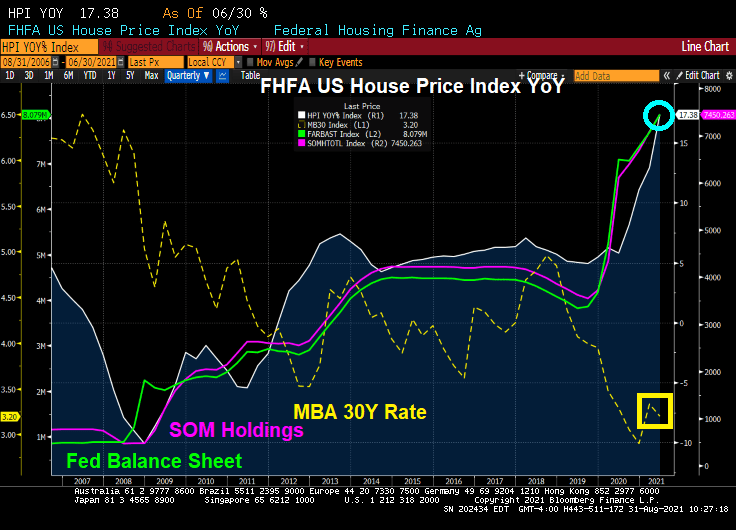
How about mortgage rates? I expect mortgages rates to rise over 2022 as the 10-year Treasury Note rises.

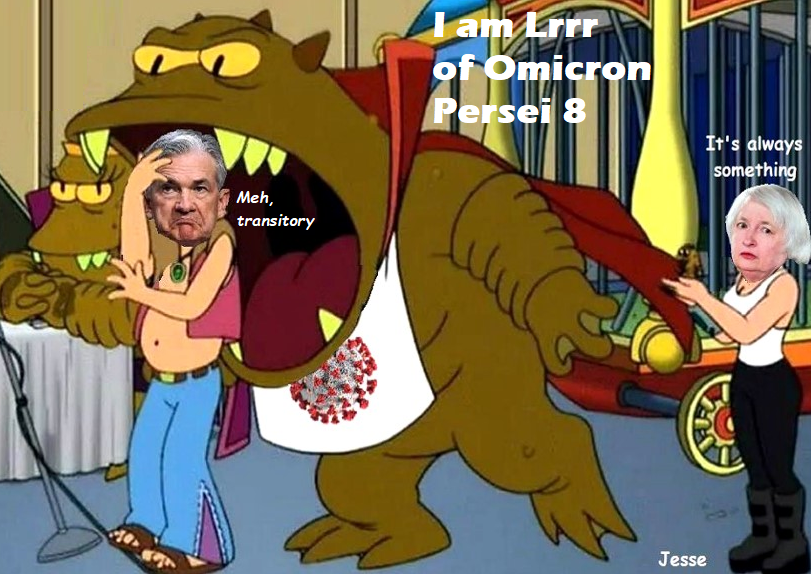
While The Fed has been acting like Santa Claus with monetary easing since 2008, they are predicted to act like Bad Santas in 2022.

6 months of telling inflation in transitory stories. Now you know why.

What do you say to the Fed Open Market Committee that has resisted raising rates while inflation is the highest in 40 years?

Cautionary note: The Fed is likely to protect economic growth and ignore inflation. So I expect FOMC will continue to reinvest prepayments into Treasury and MBS, pro-rata to the current portfolio.

FOMO Housing Market: October Home Prices “Slow” To 19.08% YoY As Mortgage Rates Rise (Phoenix Fastest At 32.3% And Minneapolis And Chicago Slowest At 11.5%)

There is a lot going on in the US housing market. Excessive monetary stimulus keeping mortgage rates low, historically low inventory available for sale, and FOMO (fear of missing out … on rapidly rising home prices).

The Case-Shiller repeat sales index for October is out … and the national home price index “slowed” to 19.08% YoY as mortgage rates rose. Note that available inventory of homes for sales remains very low.

By metro area, Phoenix AZ once again leads with 32.3% YoY. Minneapolis MN is the slowest growing metro area in terms of home prices at 11.5% (tied with Chicago, IL).

A distant relative of Anthony Fauci.

Fed Talk,Talk! Mortgage Applications SURGE 56% WoW As Treasury Yields Tank (Purchase Apps Spike 28% WoW)

Despite the “Talk, Talk” from The Federal Reserve about balance sheet taper and rate “normalization,” we actually saw the 10-year Treasury yield fall from 1.6651% on 11/23/2021 to 1.343 on 12/3/2021. While the 30-year mortgage rate only fell from 3.31% to 3.3%, it is the SIGNAL that The Fed is sending that people should refinance their mortgages ASAP.

You can see the rise in mortgage refinancing applications of 56% week-over-week (WoW) (white line) with the drop in the 10-year Treasury yield (blue line) despite the relatively small drop in the Mortgage Bankers Association (MBA) tiny drop in their 30-year mortgage rate index.

Ditto for the MBA mortgage purchase application index. The drop in the US Treasury yield (blue line) resulted in a 28% WoW increase in mortgage purchase applications.

Here is the table of MBA data for the week of 12/03.

Please note that the 10-year Treasury yield have jumped since 12/03 indicating that mortgage application activity for the week of 12/10 will be lower.

Here is the MOVE bond volatility index and the US Treasury 10-yield chart. Can you spot the COVID outbreak??

Here is a video of Fed Chair Jay Powell doing “Talk, talk” about tapering.

Annual U.S. Home Price Growth Hits 18% in October (Highest In Non-California West And Florida, Lowest In DC, NY And Illinois)

National home prices increased 18% year over year in October 2021, according to the latest CoreLogic Home Price Index (HPI®) Report . The October 2021 HPI gain was up from the October 2020 gain of 7.4% and was the highest 12-month growth in the U.S. index since the series began in 1976. The increase in home prices was fueled by low mortgage rates, low for-sale supply and an influx in homebuying activity from investors. Projected increases in for-sale supply and moderation in demand as prices grow out of reach for some buyers could slow home price gains over the next 12 months.

The non-California west (Arizona, Idaho, Utah, Nevada) and Florida have the strongest price growth while Washington DC has the slowest growth YoY.

Other “escape to” states like Vermont, Tennessee, North and South Carolina are also showing 20%+ rates of growth while the “escape from” states of Illinois, Louisiana, New York, and North Dakota are showing low growth as in 5-10% YoY.

Waiting for you in Florida!

US Home Prices “Slow” To +19.51% YoY In September (Phoenix AZ Sizzles At +33.1%, Chicago Slowest At 11.8%)

When I told Benzinga’s Phil Hall in an interview a while back that I thought US home price growth would slow, I didn’t consider the never-ending COVID epidemic (now with the Omicron Variant taking the stage. But at least the CoreLogic Case-Shiller National home price index (HPI) “slowed” in September from +19.84% to +19.51%.

Once again, low available inventory of houses for sale coupled with outlandish Fed stimulus has resulted in a housing crisis where home price growth (+19.51%) exceeds hourly wage growth (+5.76%) by almost 4x.

Where are all the home prices above 10% YoY? Every one of the 20 metro areas covered by Case-Shiller. Phoenix AZ leads at +33.1%. Chicago IL is the “slowest” at 11.8%.

Although Columbus OH is the growth hub of the state, Case-Shiller only reports Cleveland. So here is Columbus’s all-transactions home price growth for Q3: +16.2% YoY placing Columbus at the top of the midwest metro areas of Detroit, Chicago, Minneapolis and Cleveland.

With the latest Omicron Variation (sounds like a Star Trek TV show episode), I will bet that The Fed will stay a little longer and keep rates low, leading to home price growth (with limited available inventory) to continue to grow at double digit speeds.

The Fed is printing SOOOO much money that the dollar should have a double eagle on it.

US Home Price Growth Hits 20%! While Fed’s Inflation Target Is 2% (Phoenix AZ Growing At Whopping 32.4% YoY!)

The Federal Reserve is dominating the news today as two Fed regional Presidents have resigned (Rosengren [Boston] and Kaplan [Dallas]) for trading irregularities.

Speaking of The Fed, their target rate for inflation is 2%. Yet the Case-Shiller 20 metro home price index just rose to 20% YoY for July. Yes, house price growth is 10 times The Fed’s target rate!!

Now, it is September 28, so this is a report of happenings two months ago. Well, now you know why The Fed ignores housing despite being the largest asset is most household’s portfolio.

A measure of prices in 20 U.S. cities gained 19.9% in July. Phoenix led the way with a 32.4% surge. New York (17.8%), Boston (18.7%), Dallas (23.7%), Seattle (25.5%) and Denver (21.3%) were among the cities that posted record year-over-year increases.

The housing market is over, under, sideways, down thanks to The Fed pumping trillions into a market with limited available inventory.

The Fed is not talking about housing. Or the fact that home prices are growing at 10 times the rate of The Fed’s inflation target.

The Fed Helped Create Housing Bubble I And Then Helped Create Housing Bubble II: The Sequel (Case Study Of Phoenix AZ Home Price Bubble)

Phil Hall of Benzinga wrote a series of excellent articles in four parts for MortgageOrb (although “The Orb” has removed his name). Here are the links to his stories.

https://mortgageorb.com/the-fall-and-rise-of-the-housing-market-part-one

https://mortgageorb.com/the-fall-and-rise-of-the-housing-market-part-two

https://mortgageorb.com/the-fall-and-rise-of-the-housing-market-part-three

https://mortgageorb.com/the-fall-and-rise-of-the-housing-market-part-four

After re-reading these excellent articles on the housing bubble and crash, I thought I would take the opportunity to present a few charts to highlight the housing bubble, pre-crash and post-crash.

Here is a graph of Phoenix AZ home prices. Note the bubble that peaked in mid 2006. The Phoenix bubble correlates with the large volume of sub-620 FICO lending and Adjustable-rate mortgage (ARM) lending. Bear in mind, many of the ARMs prior to 2010 were NINJA (no income, no job) ARM loans.

What happened? Serious delinquenices at the national levels spiked as The Great Recession set in and unemployment spiked.

Since the housing bubble burst and surge in serious mortgage delinquencies, The Federal Reserve entered the economy with a vengeance. And have never left, and increased their drowning of markets with liquidity.

The Fed whip-sawing of interest rates in response to the 2001 recession was certainly a problem. They dropped The Fed Funds Target rate like a rock, then homebuilding went wild nationally and home prices soared thanks to Alt-A (NINJA) and ARM lending. But now The Fed is dominating markets like a gigantic T-Rex.

Oddly, then Fed Chair Ben Bernanke never saw the bubble coming. Or the burst.

Speaking of pizza, Donato’s from Columbus Ohio is my favorite. Founder’s Favorite is my favorite, but they do offer the dreaded Hawaiian pizza (ham, pineapple, almonds and … cinnamon?)

Bleech!

Hold That Tiger! US Existing Home Sales Decline As Prices Soar Thanks To Limited Inventory And Fed Stimulus

I certainly hope The Federal Reserve starts normalizing interest rates. Hold that Fed tiger!

(Bloomberg) — Sales of previously owned U.S. homes fell in August, suggesting that demand is moderating as lean inventory and high prices squeezed out some buyers.

Contract closings decreased 2% from the prior month to an annualized 5.88 million, in line with economists’ estimates, figures from the National Association of Realtors showed Wednesday.
“Clearly the home sales are settling down but above pre-pandemic conditions,” Lawrence Yun, NAR’s chief economist, said on a call with reporters.

Lawrence Yun is correct. There was a huge spike in existing home sales (EHS) following the Covid outbreak and the overreaction by The Federal Reserve (aka, when the ain’ts went marching in). Despite continuing stimulus, but EHS has simmered down.

At least the median price of EHS YoY slowed to 12.1% YoY as The Fed slows M2 Money growth.

Inventory remains relatively low compared to historic levels while price zooms with Fed stimulus.

Want home price growth to slow its insane growth? Hold that tiger! That is, The Fed has to start normalizing interest rates.

Case-Shiller 20 Metro Home Price Index Breaches 19.1% YoY As Phoenix AZ Leads The Way At 29.3%! (Is Powell The God Of Hellfire?)

Fed Chair Jerome Powell is The God of Hellfire! Or least home prices.

The Case-Shiller 20 metro home price index grew at 19.1% YoY even as The Federal Reserve has “slowed” M2 Money growth to 13% YoY.

Home prices are now growing at 4.75x hourly earnings growth. And existing home sales inventory remains low by historic standards.

All of the Case-Shiller metro areas were above 13% with Phoenix, AZ leading at 29.3% YoY. The slowest growing metro area is Chicago, IL at 13.3%.

The FHFA’s house price growth hit 17.38% YoY in June. Mortgage rates being low and Fed’s Balance Sheet and The Fed’s System Open Market Holdings sky-high.

Are Fed Chair Jerome Powell and The Fed Board of Governors the Gods of Hellfire?