On Tuesday, it was announced that Presidential candidate Kamala Harris would be supporting President Joe Biden’s tax proposals for 2025, which include a 44.6% capital gains rate and a 25% tax on unrealized gains.
Having used up all of the rest of the batshit, insane, counterintuitive economic dirty tricks left in the “we’ll literally do anything but cut spending” bag, the Biden administration began pushing this tax idea in April 2024 when I first wrote about it. Unrealized gains taxation could be the most destructive idea for our country since prohibition, I joked at the time.
As part of its budget proposal for the 2025 fiscal year, the Biden administration was trying to raise an addition $4.3 trillion over 10 years in the worst way possible: imposing a minimum tax equal to 25 percent of a taxpayer’s taxable income and unrealized capital gains less the sum of their regular tax, for taxpayers with wealth over $100 million.
Biden/Harris pushes taxes way beyond the revenue maximing point, down to the point of deminishing revenues and economic growth. Here is the Laffer Curve.
Putting aside the fact that this high-risk idea only amounts to a pittance, $430 billion per year, the introduction of taxing unrealized gains could be one of the worst slippery slopes we ever dare to roll our country’s economy down.
We could save $1 trillion just by not sending $100 billion a year to other nations for starters.
A tax on unrealized capital gains means that individuals are penalized for owning appreciating assets, regardless of whether they have realized any actual income from selling them.
If you purchased a stock for $100 this year, for example, and it increased to $110 next year, you would pay the assigned tax rate on the $10 capital gain. You didn’t sell the asset, so you don’t realize the $10 appreciation, but must pay the tax regardless.
Taxing unrealized capital gains contradicts the basic principles of fairness and property rights essential for a free and prosperous society. Taxation, if we’re going to have it on income, should be based on actual income earned, not on paper gains that may never materialize.
mplementing such a tax not only deeply infringes upon personal liberty and private property rights — but I can’t help but think about how it also sets a destructive wrecking ball rolling down a slippery slope for the first time in our nation’s history.
And, given the precarious state of our nation’s finances, it doesn’t seem like the best time to start spitballing about new risky ideas that may or may not catch on only because they sound like they are addressing the problem of a widening wealth gap that Federal Reserve policies created and continue to exacerbate to begin with.
If the administration really wanted to address the problem of wealth inequality, it would be setting its sights on the central bank that sacrificed price stability so it could spray trillions of dollars in “stimulus” toward financial assets, while cutting American families paltry checks of just $600, during COVID. When I did the math during COVID, the total amount spent to bail out the country.
Why do we trust any Democrat politiician? I certainly don’t!
Taxing unrealized gains would risk mass sale of US assets and therRich fleeing.
Joe Biden (aka, BeelzeBiden) is really a piece of … work. His policies are helping drive prices through the roof, he seeks to protect deepstate employees against removal by Trump, had a disastrous withdrawal from Afghanistan and is getting the US engaged in possible hot wars in Ukraine (against Russia), open borders allowing US crime to spike, seems to be suppoporting Hamas over our long-time ally Israel, the list goes on. Biden’s big push for electric cars is a Socialist fantasty and simply unrealistick, drives up energy costs and is EXPENSIVE. It is like Biden is the demon Beelzebub from the TV show “Supernatural.” I once referred to Washington DC as “Mordor on The Potomac.”
Throw in the Federal Reserve operating outside their mandate (excessive interference in the financial crisis of 2008, the excessive interfernce after the Covid outbreak in 2020) and the two together are destroying the US.
Look at housing prices (up 32.5% under Biden) against the purcchasing power of the US dollar (down -16.1% under Biden).
The problem has gotten so bad that Sedona, Arizona, recently set aside a parking lot exclusively for these homeless workers. The city is even installing toilets and showers for the new occupants.
Apparently, the City Council thought installing temporary utilities was cheaper than solving the area’s cost-of-living crisis.
And what a crisis it is.
The average home in the city sells for $930,000, while most of the housing available for rent is not apartments, but luxury homes targeted at wealthy people on vacation.
With such a shortage of middle-class housing and with starter homes essentially nonexistent, low- and even middle-income blue-collar workers have nowhere to go at night but their back seat.
Much like America’s Great Depression in the 1930s, this marks a serious regression in our national standard of living. But shantytowns were not prevalent in the 1920s (a decade that began with a depression) or the 1910s. Nor were they ubiquitous following the Panic of 1907, which set off one of the worst recessions in American history.
Indeed, Americans in the Great Depression faced such a cost-of-living crisis that many were forced to accept a standard of living below what their parents and even their grandparents had.
Fast-forward about 90 years, and countless families are in the same boat. Many young people today don’t think they’ll ever be able to achieve the American dream of homeownership that their parents and grandparents achieved. The worst inflation in 40 years, rising interest rates, and a collapse of real (inflation-adjusted) earnings mean a huge step backward financially.
That inflation has pushed up rents so much that young Americans are moving back in with their parents at rates not seen since the Great Depression because they can’t make it on their own. Sometimes, they can’t even make it with multiple roommates.
But many people cannot move back in with family, so the car it is.
The housing problem is not limited to wealthy towns in Arizona, however. It is systemic. The monthly mortgage payment on a median-price home has doubled since January 2021, and rents are at record highs. Like the Great Depression, this disaster stems from impolitic public policy.
For the past several years, the government has spent, borrowed, and created trillions of dollars it didn’t have. The predictable result of this profligacy was runaway inflation, followed by equally foreseeable interest rate increases.
The deadly combination of high prices and high interest rates has frozen the housing market and reduced homeownership affordability metrics to near-record lows. In several major metropolitan areas, it takes more than 100 percent of the median household after-tax income to afford a median-price home.
Since rents and virtually all other prices have risen so much faster than incomes over the past three years, even renting is unaffordable today, so many people have to go into debt to keep a roof over their heads. And for some, that’s a car roof.
This is the kind of story you might expect from a Third World country or somewhere behind the Iron Curtain during the Cold War, not the largest economy in the world—at least not outside of a depression like the one in the 1930s.
Hoover certainly deserved some blame for the Great Depression, but so did the progressives in Congress, who came from both parties and repeatedly voted to meddle in the economy instead of allowing it to recover from the initial downturn.
Similarly, President Joe Biden deserves blame for constantly advocating runaway government spending. (Runaway Joe??)
But today’s multitrillion-dollar deficits are also made possible by the big spenders in Congress, who come from both parties.
If this bipartisan prodigality of Washington continues, Bidenvilles will only become more widespread as the housing affordability crisis worsens.
Biden’s official White House portrait.
Washington DC under Biden and Schumer, Pelosi, etc.
Or as Bonnie Beecher almost sang in a Twilight Zone episode, “Come wander with China Joe Biden.” On The White House lawn. Or wander with The Federal Reserve!
The USA is a runaway train with a dead man (China Joe is about as dead as one can be) in the engineer’s seat.The conductor goes through the cars assuring the passengers that everything is fine. . . never mind the screeching wheels on the curves. . . or the blinding strobe effect of low sunlight passing through the trees out the window at a hundred and forty mph. . . or the bump that made half the stuff in the overhead luggage rack jump out. More than half the people on-board are at tachycardia levels of fright — some are screeching — but the other less than half just remain fixed on their phones and laptop screens. They can’t be bothered to look out the window…
Okay, that’s a metaphor.
But if you’re a citizen of our country and care about it, these are the matters you’d better pay attention to, because they are all going off the rails.
The war in Ukraine. We started it in 2014 to mess with Russia and Russia is going to finish it. Who knows what our real motives were. A resource grab? A desperate ploy to erase our national debt by creating a global fiasco? Sheer psychopathic hatred of this Putin fellow? We can’t bring ourselves to acknowledge the failure of this ill-conceived venture. Instead, our feckless allies in Europe are foolishly rattling their sabers, apparently forgetting that you don’t bring a sword to a nuclear missile fight.
Mr. Macron in France affects to offer up his army for slaughter on the blood-soaked plains of Ukraine, just as the Ukrainians offered up a half a million of their young men so that Victoria Nuland could feel good about herself. Mr. Macron is insane, but the society he presides over is collectively insane, so perhaps he represents them well. Similarly, Olaf Scholz in Germany, whose top generals were caught on a leaked recording last week discussing their plan to blow up the Kerch Bridge that connects Crimea to Russia. Do you understand that this would be a direct attack on Russia, an act of War by NATO? And what the obvious consequence would be?
The phantom government of “Joe Biden” is too weak and mindless to join any negotiation. Ukraine and Russia are up to some kind of cross-talk down in Riyadh with Prince MBS. Even Mr. Zelensky went down for a day, though video appears to show him coked-up, sniffling and snarfling, not a good sign. If ever there was a time to end this stupid conflict, it’s now, before the Russian election. After that, terms will only be more difficult for Ukraine, up to direct custodial supervision instead of remaining a nation. It was never any of our business (though the Biden family, BlackRock, and the CIA saw fabulous opportunity to profit there).
Next is the border. You saw last year how the blob elite greeted the transfer of illegal immigrants to their happy little island of Martha’s Vineyard. (They were not amused by Governor DeSantis’s prank, and off-loaded the mutts post-haste.) But that same smug demographic doesn’t care if hundreds of thousands are distributed to the big cities, which are now fiscally destabilized by them to an extreme, probably to bankruptcy.
Of course, that is not the main thing to worry about with what altogether amounts to millions of border-jumpers flooding our land. The main reason to worry is what the blob that invited them here intends for them to do, which, you may suspect, is to unleash mayhem in the streets, malls, stadiums, and upon our infrastructure just in time to derail the election — perhaps even to make war on us right in our homeland. The US government is paying for this whole operation, you understand, funneling our tax money to international cut-out orgs who set up the transfer camps in Panama, and buy the plane tickets for the mutts to cross the ocean, and coordinate with the Mexican cartels to shuttle this horde of mystery people among us to work their juju for the Democratic Party. The pissed-off-ness of the public has passed the red line on this.
A third FUBAR is the lawfare campaign of the Democratic Party and its regime in power against the citizens of this land. This folder includes overt and obvious political prosecutions by DA’s and AG’s who make election promises to “go after” individuals without such niceties as probable cause. It includes the gigantic new scaffold of inter-agency censorship and propaganda. It includes the psychopathic struggle sessions mandated by “diversity and inclusion” policy. It includes election-rigging directed by the likes of Marc Elias and Norm Eisen, getting states to fiddle laws on voter ID and mail-in ballots. It includes the political protection of rogue groups ranging from looter flash-mobs to Antifa anarchists who bust up things and people and burn buildings down. It includes state officials who peremptorily kick candidates off the ballot. It includes a nakedly biased judiciary, and especially the use of the DC federal district court to punish people extralegally, unjustly, extravagantly, and cruelly. In short, lawfare is the complete perversion of law, and we-the -people are entreated by reprobate officials such as Merrick Garland and Letitia James to accept it.
A fourth item on this list is the US economy which has been overwhelmed by maladministration of an overgrown monster bureaucracy, and the gross (perhaps fatal) mismanagement of the government’s money. The people of this land are not being allowed to do business, to find a livelihood, to transact fairly. “Joe Biden’s” shadow string-pullers are messing as badly with the oil and gas producers as they have messed with Ukraine. And they are doing it in pursuit of a laughable mirage: their “green new deal.”
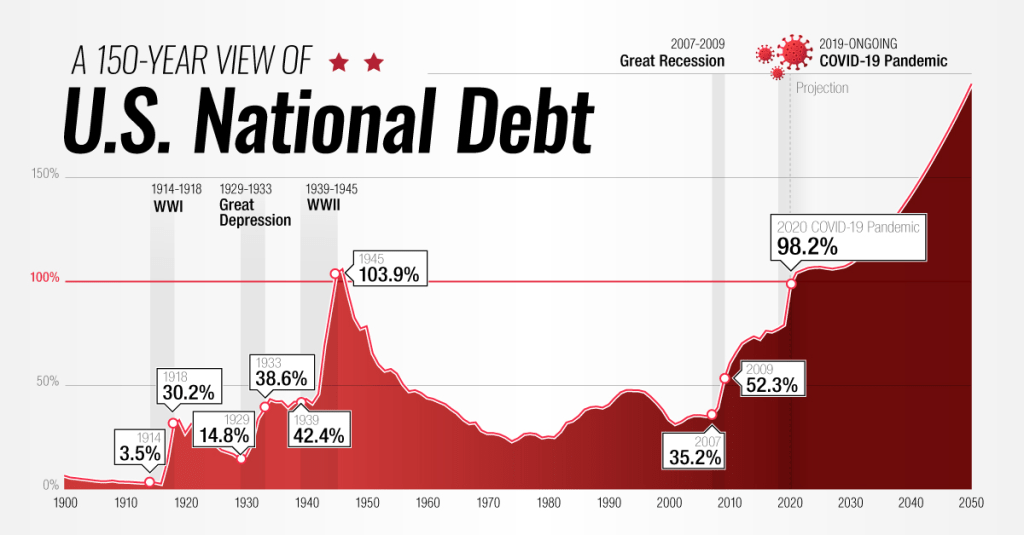
John Podesta, the “clean energy czar” who replaced the Haircut-in-search-of-a-brain called John Kerry, sits on a $370-billion slush fund that can be used to just dole out to anyone and everyone a political patronage payoff, especially to janky “community” orgs and NGOs with fake agendas. This really just amounts to an asset-stripping operation that will leave the American people busted and with broken supply chains for everything. Instead of annual budgets, Congress raises the US debt ceiling by “continuing resolutions” to keep the government from shutting down. The national debt races to the $35-trillion mark. As interest rates on debt rise, our debt payments now exceed our military spending. You can be sure that our country will break down financially very soon.
The capper on today’s list is the nation’s health, the racketeering system we’ve set up to care for it, and the public health agencies of the government that enabled the Covid-19 operation to happen. The CDC continues to push vaccines that have killed millions of Americans and more millions around the world, and has probably compromised the well-being of millions more going forward. Corporate medicine — that is, your doctor, and your hospitals — is a sinking Titanic of grift and chaos. Try to get an appointment to even see a doctor for an emergency. Try to avoid being bankrupted by your treatment. Try to get out of a hospital alive. Yeah, it’s that bad.
The doctors have surrendered your trust in them with their lying and their bullshit. The current director of the CDC, Mandy Cohen and her predecessor, Rochelle Walensky, have knowingly presided over the mass killing and injuries imposed on the mRNA vaccinated. Hundreds of their deputies should be liable for prosecution, and so should many of the other prominent characters in the Covid Saga: Fauci, Birx, Collins, Baric, Bourla, Daszak, Califf, Woodcock, Hahn, and many more.
What are we going to do about any of this? Return to the metaphor. The runaway train is still picking up speed. You can’t just jump off at 150 mph. If you’re one of the passengers watching this in horror, maybe you can decouple your car, or get the conductor to do it by any means necessary. Let’s say that each car behind the engine of this train is a state of the United States. Let the engine up front with the dead man at the controls ride that runaway to its terrible conclusion. Cut loose the cars behind it to take care of themselves, to slow down, get a grip on their situation, and make plans to find a better engine to pull the train. Decouple. Cut loose. It’s the only way.
Director John Carpenter had two films, “Escape From New York” and the less popular “Escape From LA.” Carpenter’s vision of a dystopian future with Manhattan as a prison island, filled with criminals and Los Angeles as a just a weird, dystopian area filled with gangs and sleazebags. Apparently, Carpenter read George Orwell with a splash of Franz Kafka in writing these films which are sadly becoming a reality. With Biden’s immigration “policy” (let everyone in without checking who they are) is a blueprint for a new film “Escape From The USA!” I wonder if Kurt Russell is available to reprise his role as Snake Plisken?
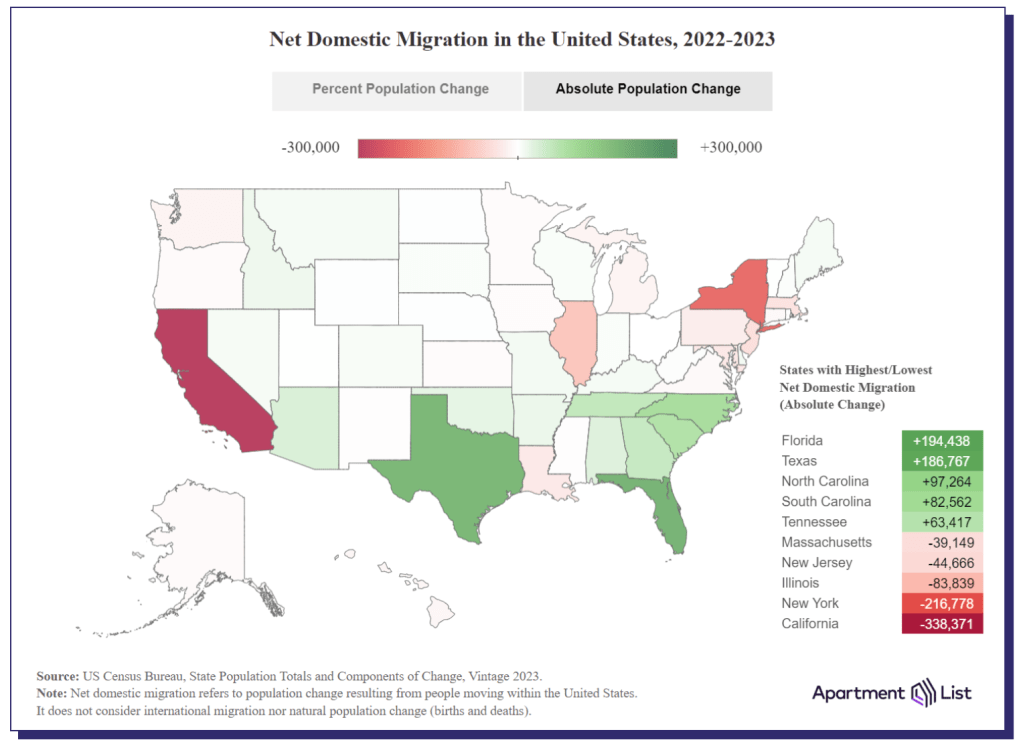
Like John Carpenter foretold, both California and New York are leading the nation in outmigration. BAD crime, high taxes, insane politicians and droves of illegal immigrants are making living in those state very difficult. Throw in the NY AG Letisha James and Judge Engmoron’s Marxist show trials of Donald Trump for doing absolutely nothing wrong and many people are are plain fed up. Illinois under the “leadership” of Chicago Fats (Governor J.B. Pritzker) and horrendous Chicago mayor Brandon Johnson (who makes former Chicago Mayor Lori Lightfoot almost look reasonable) is third in the nation for outmigration. Once again, high taxes, high crime, lots of illegal immigrants, and inane policies are causing people and businesses to flee. John Carpenter should do a film “Escape From Chicago.”
Where are people fleeing to? Florida leads followed by Texas, then the Carolinas, and Tennessee. Generally, these states have lower taxes, lower crime, and less intrusive politicians. E.g., no Gavin Newsom (CA), no Kathy Hochul (NY) and no J.B. Pritzker (IL).
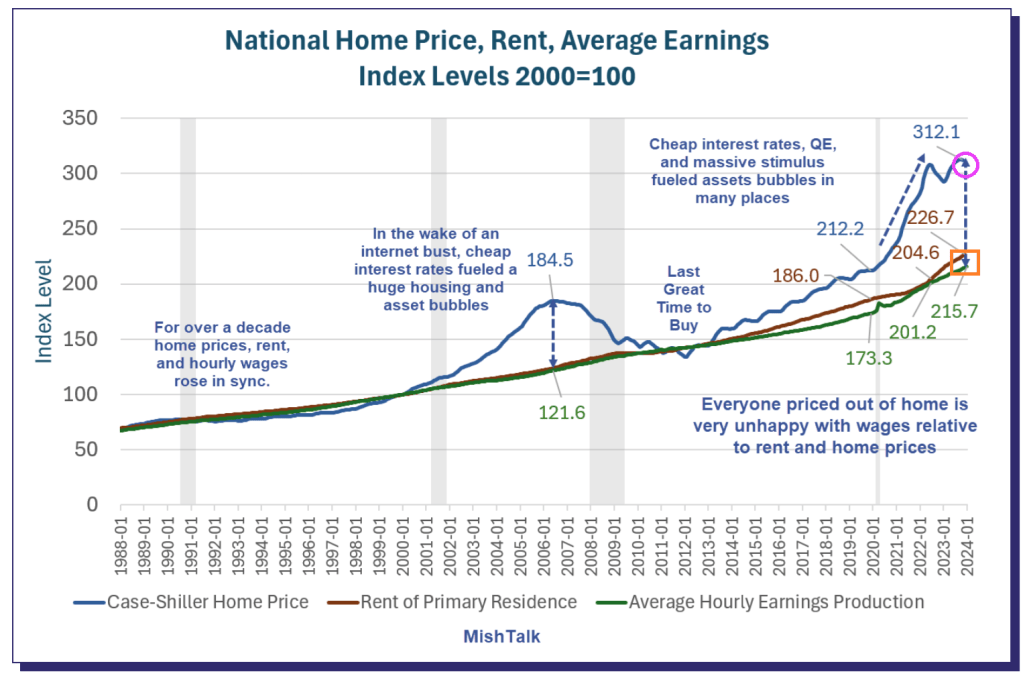
Another reason that people are fleeing New York and California is cost of living. To be sure, Bidenomics (an insidious malinvestment plan, aka, donor-nomics) has made matters worse. Home prices (blue line) and rents (red line) has soared and are far higher than the grow in average earnings (green line). Los Angeles is wonderful if you are a celebrity like Steve Spielberg, Tom Hanks and The Office’s Jenna Fischer where you live in a mansion and are protected by the police force. But other parts of Los Angeles are filled with the homeless, illegal immigrants, rampant crime, and is simply unlivable.
Escape From New York is appropriate for today’s situation. An idiot Mayor and Governor, illegals crowding the streets and hotels, crime through the roof, illegals attacking police. And Joe Biden acting like The Duke of New York, A number One! I guess the closest person we have to Snake Plisken is Donald Trump.
On a related note, Georgia is still seeing positive net in-migration. But as the Fani Willis corruption scandals unfolds and their weak-kneed Governor Kemp does nothing, we have yet another film John Carpenter could make “Escape From Atlanta.” Or a computer game like “Call of Booty.”
The Hollies said it best: Stop, stop, stop. FIAT Money Printing that is.
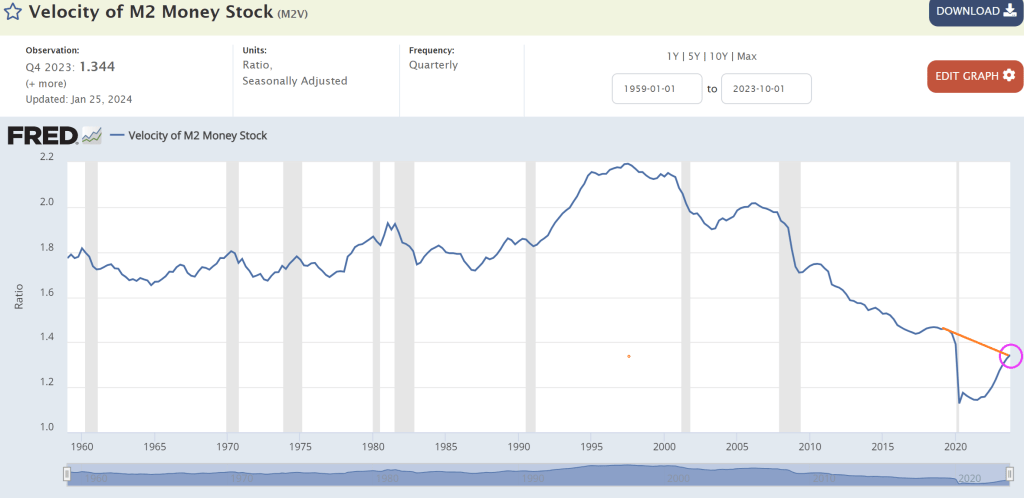
Typically, we look at M2 Money Velocity (GDP/M2) as a measure of how much the economy grows by expanding the money supply.
M2 Money Velocity is currently at 1.344, and still below where we were under Trump prior to Covid. After Powell printing palooza after Covid, M2 Money Velocity collapsed and is slowly rising, but remains low by historic standards.
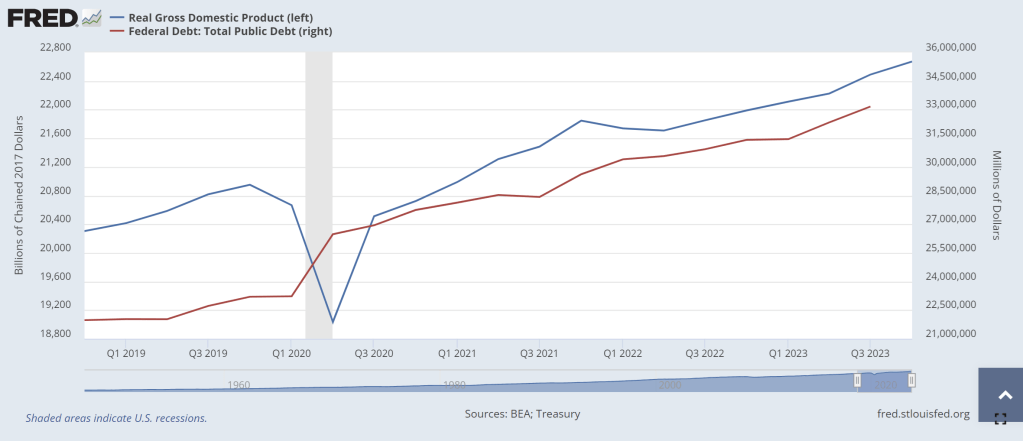
Perhaps a more interest velocity is DEBT velocity (GDP/DEBT). Under Biden’s Reign of Error, Federal debt has increased by $6,539,359 million while real GDP has increased by only $1,948.731 billion (or roughly $2 trillion in GDP growth after $6.54 trillion in debt). Or a DEBT velocity of 0.3. Yikes! No wonder China is bailing on US debt!
This chart makes debt issuance look better than it really is. Again, the DEBT VELOCITY of 0.3 is terrible meaning that for every $1 of Federal debt, we get 30 cents in Real GDP under Biden. One of my macroeconomics textbooks stated that debt growth is fine as long as real GDP growth rises faster than debt growth. Apparently, Treasury Secretary Janet Yellen didn’t read that textbook! Real GDP has grown by 9.43% under Biden while Federal debt has grown by … gulp .. 24%.
Yes, the US is borrowing like the proverbial drunken sailor while they “invest” in green energy, wars in Ukraine and the Middle East, and massive social welfare programs (like the old breads and circuses from the dying Roman Empire). When watching the media’s obsession with Taylor Swift and Chief’s Tight End Travis Kelce at The Super Bowl, it reminded me of “Breads and Circuses” as our nation is collapsing like a dying star. (That is why I Iike Gold, Silver and Bitcoin!)
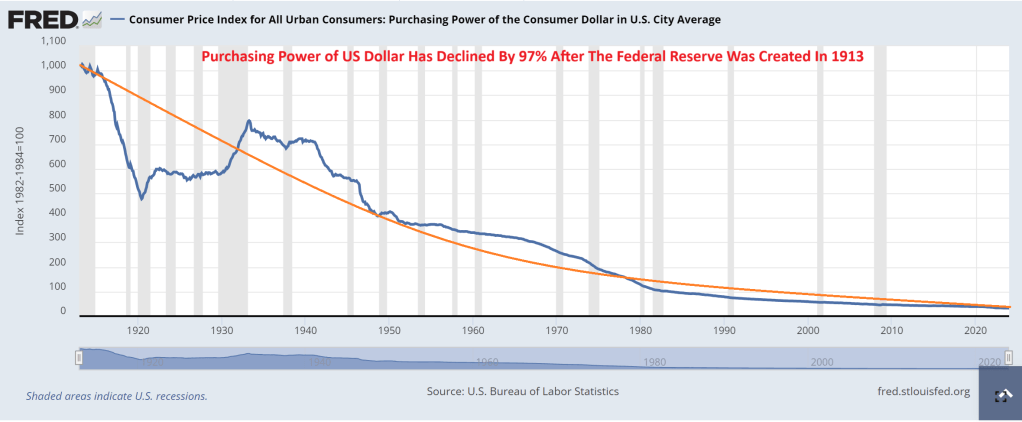
What about The Federal Reserve? It was created in 1913 after signed into existence by President Woodrow Wilson. Since The Fed’s inception, consumer purchasing power has declined by 97%.
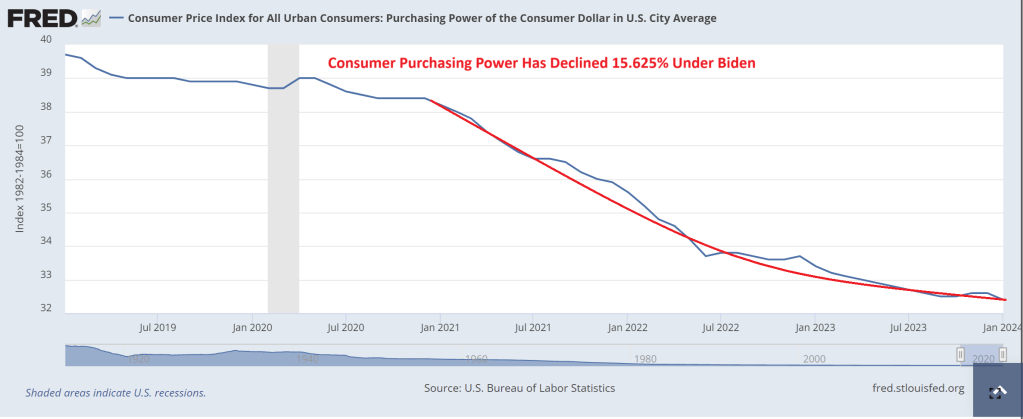
And under Biden, inflation has been so bad that consumer purchasing power is down 16%.
In summary, The Federal Reserve has been printing like crazy (I would say Batshit Crazy, but I actually think bats are adorable). And Treasury (under former Fed Chair Janet Yellen) has been borrowing like crazy too. While politicians claim the economy is in great shape, it is really because The Fed is printing wildly, Yellen is borrowing wildly, and much of US GDP is not due to the private sector, but Federal government spending … to the donor class. This is NOT a sustainable and will eventually crash into a ravine.
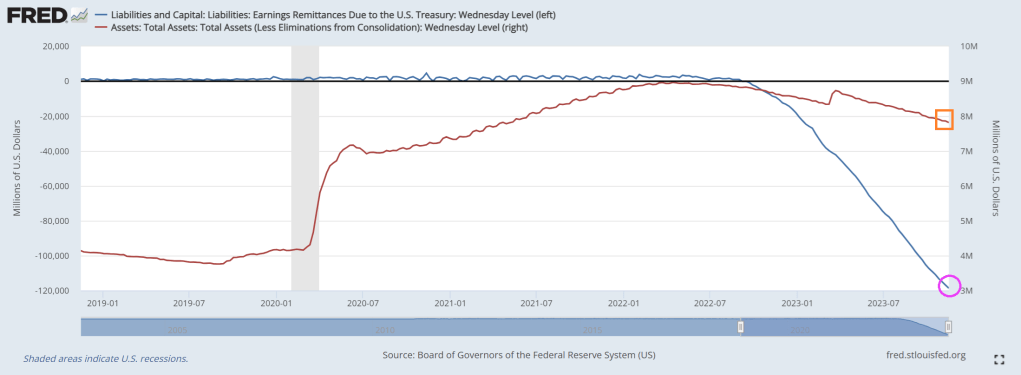
Biden’s terrible economic policies and horrid fiscal managment has put stress on The Federal Reserve. The Federal Reserve paid an estimated $76 billion to the Treasury in 2022 while banks’ willingness to lend has plummeted.
One of the key ways central banks absorb liquidity back out of the market is through reverse repo. These are short-term transactions where the Fed sells securities to banks and agrees to buy back at a higher price the next day.
This means banks are being paid to park cash with the Fed instead of injecting it into the economy through loans and fanning the fires of inflation.
That alone is costing the Fed $200M every single day.
In addition, the Fed is spending another $500M in daily interest payments on its reserve policy, i.e. balances that banks are holding in their reserve accounts at the Fed.
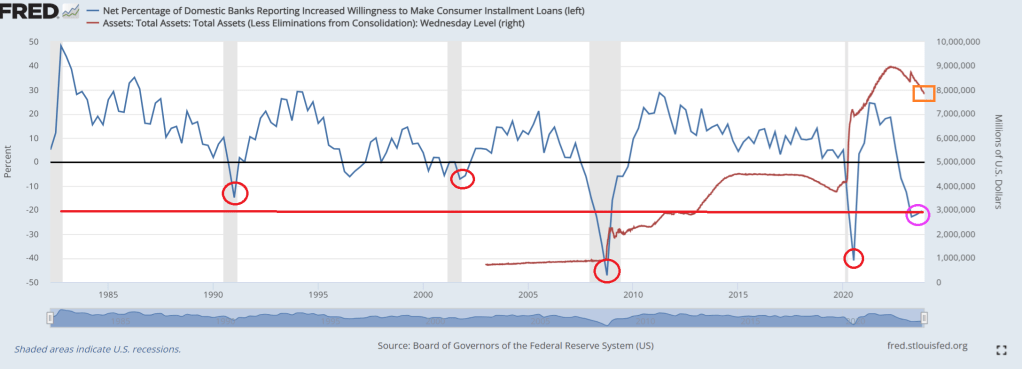
Banks’ willingness to lend has plummeted making credit availability increasingly tighter. Current levels have typically ended in recessions.This time is NOT different.
And on the energy side of the market, Biden Invokes ‘Wartime Powers’ to Attack Gas-Powered Furnaces. Of all the stupid things Biden has done, invoking wartime powers to make households use inefficent electric heat pumps instead of gas furnaces in stupid of two levels. First, invoking wartime powers for things unrelated to national defense is reckless and capricious. Second, electric heat pumps in the colder areas of the country is stupid as well. Electric heat pumps are inefficient, unless the goal of Biden and his Idiocracy is to “cull the herd” or kill off people during winter months (I had an electric heat pump in a condo I owned and it was terrible in winter months).
Yes, the Biden Administration and The Fed are economic mutilators!
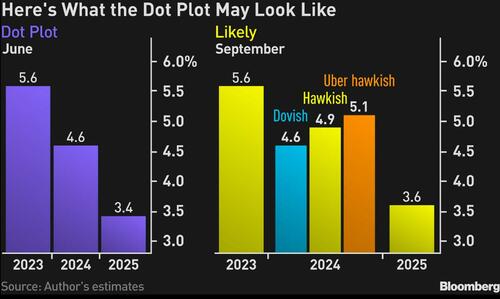
The median of indications will show that policymakers expect a decline in the benchmark rate of as little as 50 basis points or 75 basis points for 2024, compared with the 100 basis points their plot showed in June. I expect the Fed to leave its dot plot for 2023 intact, with the funds rate indicated at 5.6%.
Investors have, of late, swung between pricing rate cuts between the spring and the summer of 2024, which the Fed isn’t in a position to acknowledge based on the current strength of the US economy. The most definitive way of pushing back against that notion is to pencil in less by way of policy loosening than the central bank did in June.
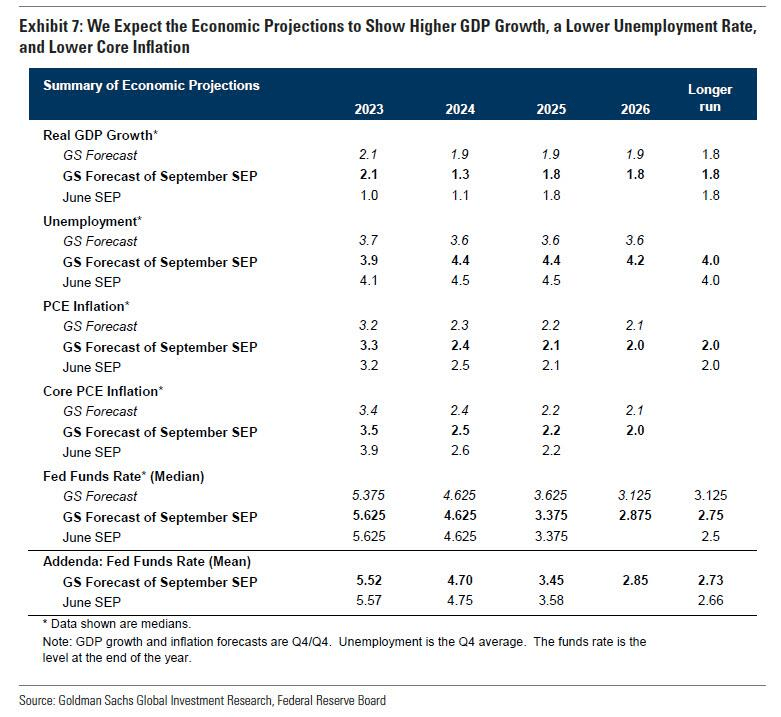
Since that meeting, headline inflation has accelerated, while inflation stripped of housing and energy is still hovering above 4%. Meanwhile, the jobless rate has averaged 3.6% so far this year, around as low as we have ever seen historically — and way below what the Fed estimates will be required to bring the labor market into balance.
The resilience of the job market may, in fact, spur policymakers to pencil in a lower unemployment rate for 2024 than the 4.5% they indicated in June.
Consistent with that outlook, the Fed may be disinclined to revise its 1% growth projection for next year by more than a whisker.
Those revisions are likely to mean that the Fed has reduced scope to loosen policy at the first sign of material weakness in the economy.
Given that James Bullard quit the Fed in August, the new set of projections will be lacking a prescient hawk, whose dot plot has been a rewarding schemata to follow for investors in this cycle. That suggests the skew between the median of the Fed rate projections for next year and top range will be considerably narrower.
An interesting corner of the summary of economic projections to watch will be the Fed’s assumption on the neutral real policy rate, which neither stokes inflation nor crimps output. For several years now the Fed has penciled in a longer-run funds rate of 2.50% predicated on inflation of 2%, thereby projecting a neutral rate of 50 basis points.
However, researchers at the New York Fed reckon that the real neutral rate will reach a staggering 250 basis points by the end of the year, one reason why Treasury long-dated yields have been sticky this late in the policy cycle.
All told, the dot plot and summary of economic projections is what will guide the Treasury market reaction, and from the looks of it, the markets may not like what they see.
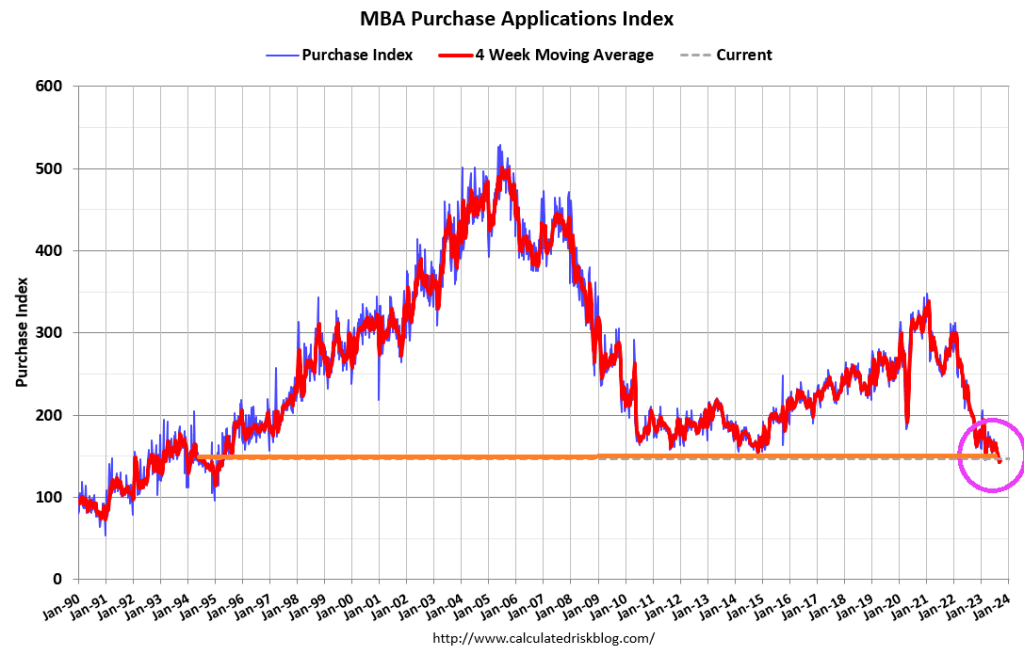
Mortgage applications increased last week, despite the 30-year fixed rate edging back up to 7.31 percent – its highest level in four weeks.
Mortgage applications increased 5.4 percent from one week earlier, according to data from the Mortgage Bankers Association’s (MBA) Weekly Mortgage Applications Survey for the week ending September 15, 2023. Last week’s results included an adjustment for the Labor Day holiday.
The Market Composite Index, a measure of mortgage loan application volume, increased 5.4 percent on a seasonally adjusted basis from one week earlier. On an unadjusted basis, the Index increased 16 percent compared with the previous week. The Refinance Index increased 13 percent from the previous week and was 29 percent lower than the same week one year ago. The seasonally adjusted Purchase Index increased 2 percent from one week earlier. The unadjusted Purchase Index increased 12 percent compared with the previous week and was 26 percent lower than the same week one year ago.
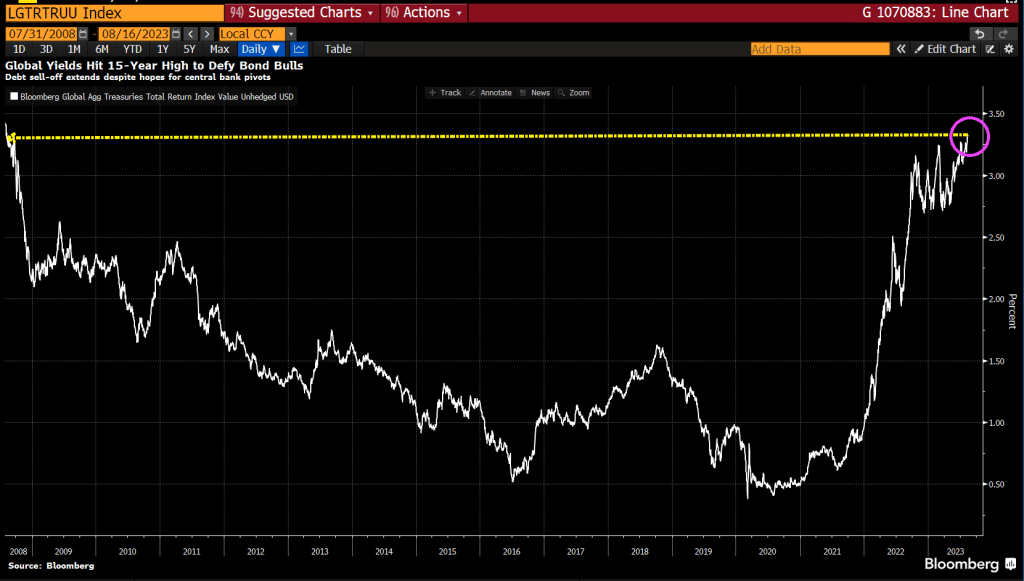
This is very strange. Global Treasury Yields just rose to a 15-year high (2008). This is primarily due to Central Bank moneta
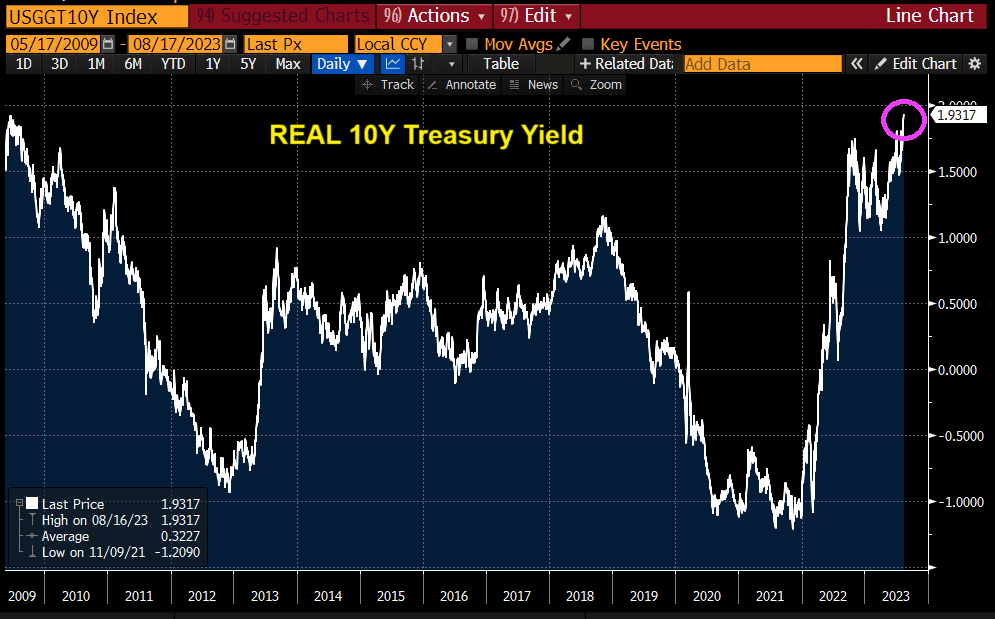
And REAL 10-year Treasury yields also the highest since 2009.
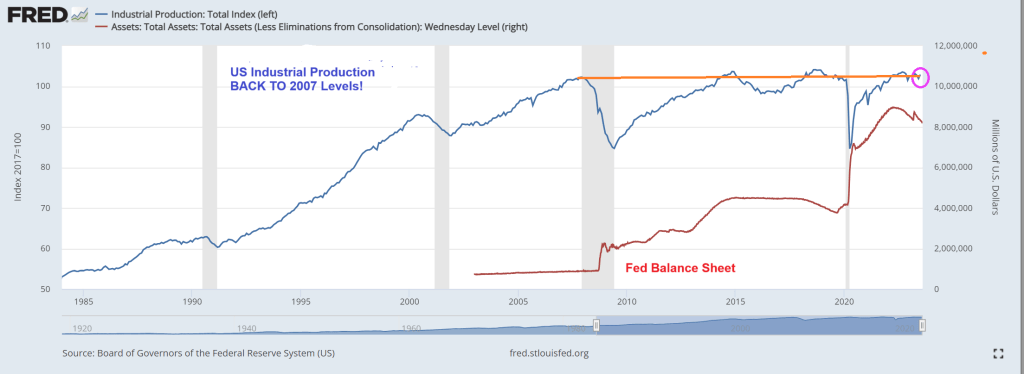
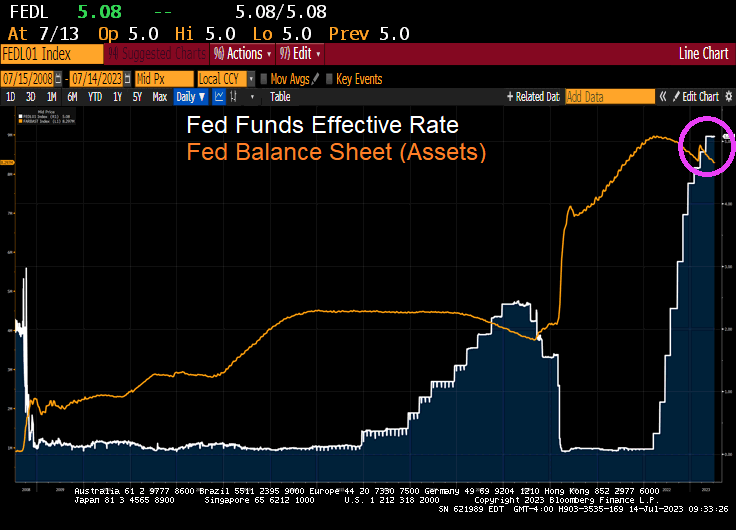
At the same time, US industrial production is at the same level as pre-financial crisis (2007). Despite Federal Reserve monetary stimulypto (remember, The Fed’s balance sheet remains abouve $8 trillion.
This is Obama/Biden/Yellenomics. Trillions of dollars of fiscal (green) stimulus and monetary stimulus only to have industrial production be at the same level BEFORE The Great Recession and financial crisis.
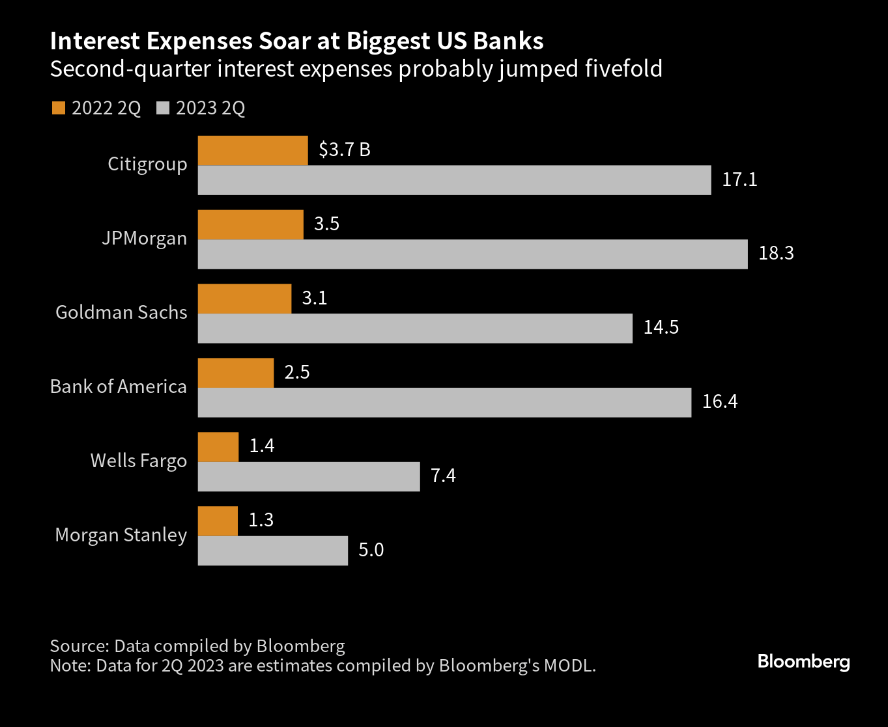
What screams may come! Actually, the aftermath of excessive monetary policies under Bernanke, Yellen and Powell are coming home to bit the big banks.
Interest expenses at big US banks are rising much more quickly than interest income. Across the six largest US banks, interest expenses are set to climb to roughly $78.7 billion from $15.5 billion in the same period last year.
There is still $8.3 Trillion in monetary stimulus sloshing around the monetary system.


You must be logged in to post a comment.