This will not end well. We’ve got trouble in (Potomac) River City!
Credit card interest rates have skyrocketed to a shocking 21.51%. Moreover, credit card debt has hit record highs1.51%.

Confounded Interest – Anthony B. Sanders
Financial Markets And Real Estate
This will not end well. We’ve got trouble in (Potomac) River City!
Credit card interest rates have skyrocketed to a shocking 21.51%. Moreover, credit card debt has hit record highs1.51%.
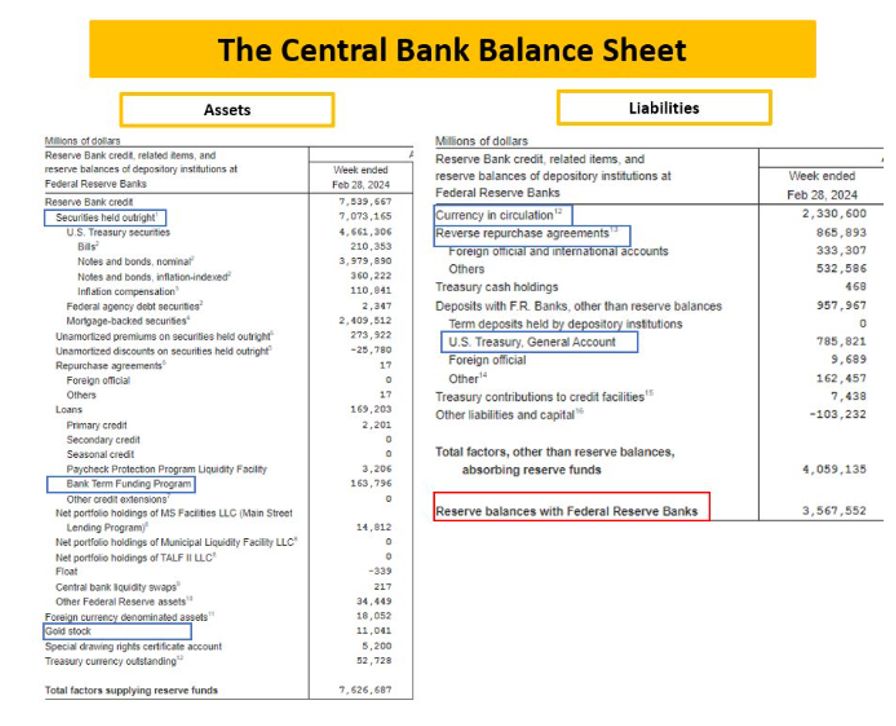
Kamala Harris, despite being VP for almost 4 years, is going to annouce her plans for taming inflation. Why doesn’t she do it now?? What Harris can’t control is The Federal Reserve that is losing money at breakneck speed.
Here is The Fed’s balance sheet.
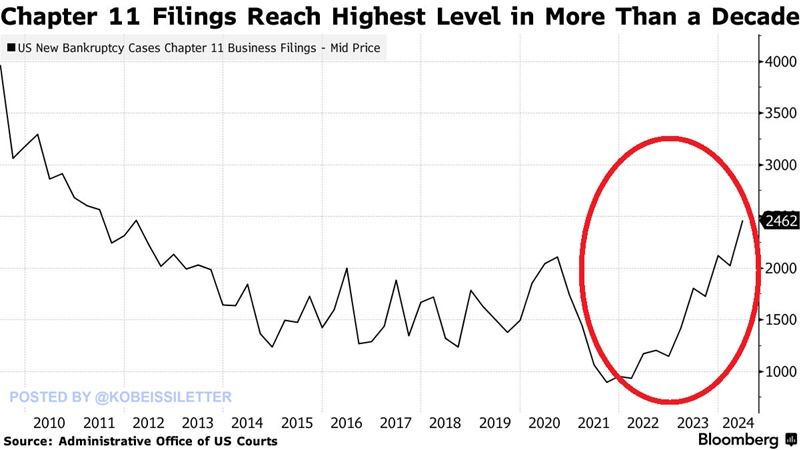
I shudder to think what Harris will propose to solve the highest bankrupty (Chap 11) rate in 13 years. Probably more Bidenomics (big wealth transfers to large corporations/donors).
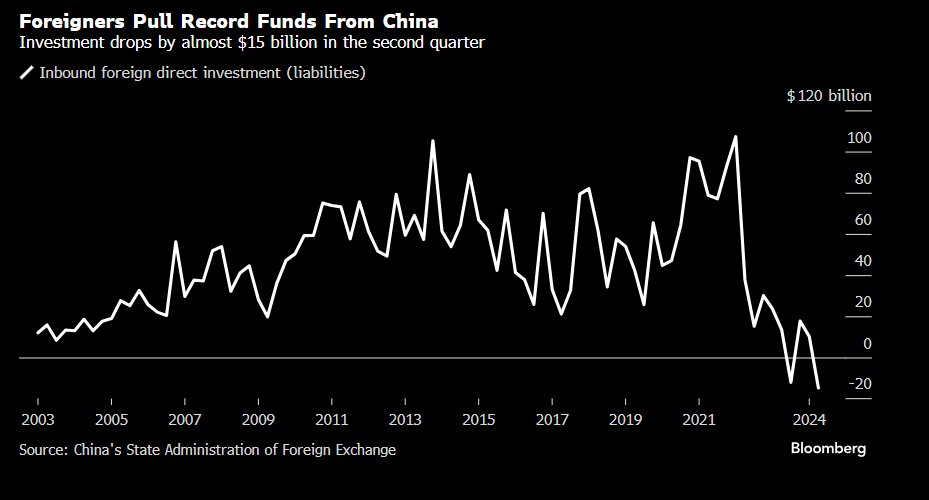
Meanwhile, foreigns pulled a record amount of funds from ailing China.
Kamala Harris will say anything to get elected, then fall back on her Communist agenda.

I have another use for VIX … to wipe out stock market gains. VIX is the S&P 500 volatility index, also known as “The Fear Index.”
Over the last 35yrs, the whole life of VIX history, there have only been 2 prior episodes of VIX trading >60: The 1st was during GFC, the collapse of Lehman, the 2nd episode occurred during Covid and we had a 3rd occurrence: that was last Monday.
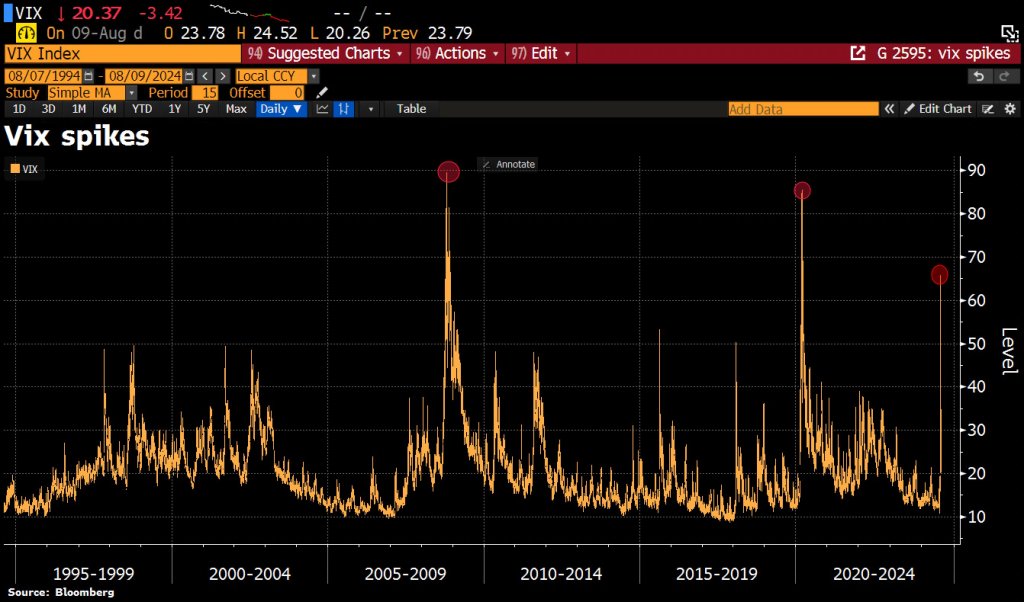
VIX … wiping out stock returns!

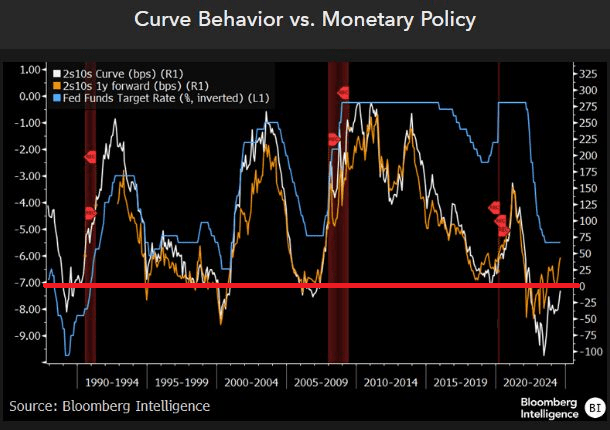
We know several things about the yield curve. First, it goes negative before recessions. Second, it is related to the inverse of The Fed’s target rate (blue line).
How about the US mortgage rate? Generally, US Mortgage rates are inverse to the 10Y-3M yield curve, but lately the US mortgage rate (pink circle) have declined with the 10Y-3M yield curve.
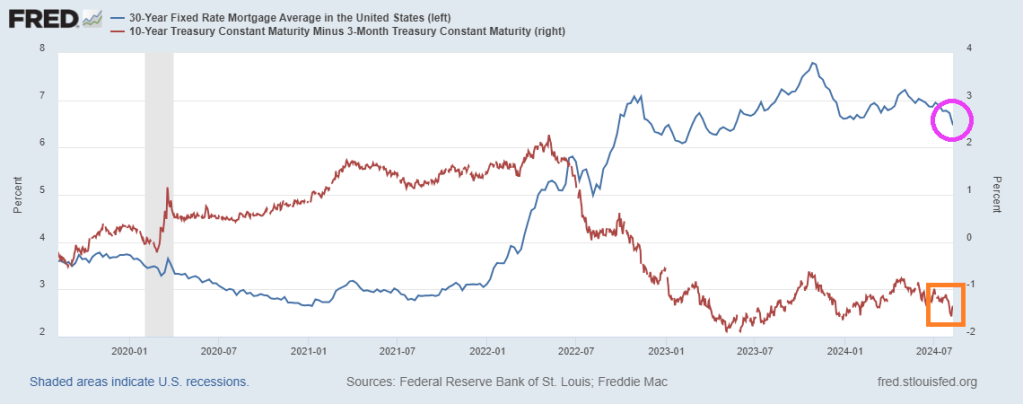
The yield curve does forecast recessions, but is unreliable in forecasting mortgage rate movements.

The slowing US economy has a silver lining: Treasury and mortgage rates are declining. And the is spurring faster mortgage prepayments.
Mortgage applications increased 6.9 percent from one week earlier, according to data from the Mortgage Bankers Association’s (MBA) Weekly Applications Survey for the week ending August 2, 2024.
The Market Composite Index, a measure of mortgage loan application volume, increased 6.9 percent on a seasonally adjusted basis from one week earlier. On an unadjusted basis, the Index increased 6 percent compared with the previous week. The seasonally adjusted Purchase Index increased 1 percent from one week earlier. The unadjusted Purchase Index increased 0.3 percent compared with the previous week and was 11 percent lower than the same week one year ago.

The Refinance Index increased 16 percent from the previous week and was 59 percent higher than the same week one year ago.

The average contract interest rate for 30-year fixed-rate mortgages with conforming loan balances ($766,550 or less) decreased to 6.55 percent from 6.82 percent, with points decreasing to 0.58 from 0.62 (including the origination fee) for 80 percent loan-to-value ratio (LTV) loans.

The deciine in rates led to an increase in MBS convexity.

Watch out! Mortgage convexity continues to rise!

Meanwhile, Kamala “The Kommie” Harris laughs.

The Fed’s theme song: Keep on printing!
Look at this chart of the S&P 500 index against M2 Money stock.

And this chart of Case-Shiller home prices against M2 Money.

Bottom line? The Fed has to keep on printing money. Otherwise, the US economy will collapse like a cheap building.
Here is Fed Chair Jerome Powell creating assets bubbles.

The wheels are coming off Bidenomics. Code for corporate welfare and massive government spending. Coupled with misguided and burdensome regulations, we got gut wrenching inflation.
The result? A disastrous stock market showing yesterday.
What has Biden/Harris’ economic agenda wrought? Record high personal debt and record low savings rates.

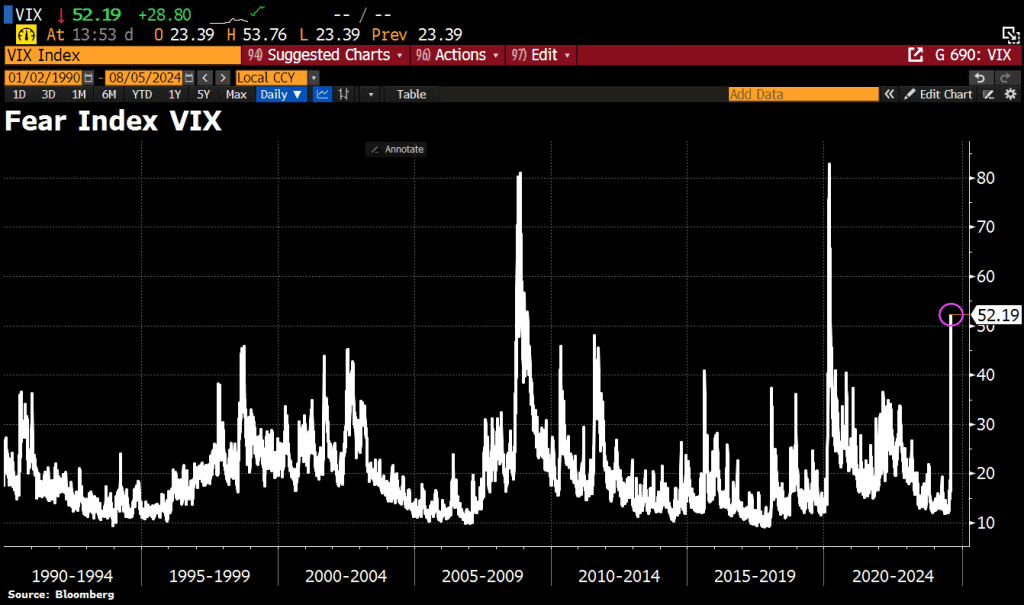
Like the Go-Go’s song Manic Monday, it is a manic Monday for stocks. The awful jobs report from last Friday is reverberating through markets. The VIX (fear index) soared to 52.2 this morning.
MY fear is that Congress will go wild and start (mis)spending trillions of dollars again on hare-brained projects like green energy (and electric cars) when our electric grid can’t support the increase in electric cars.
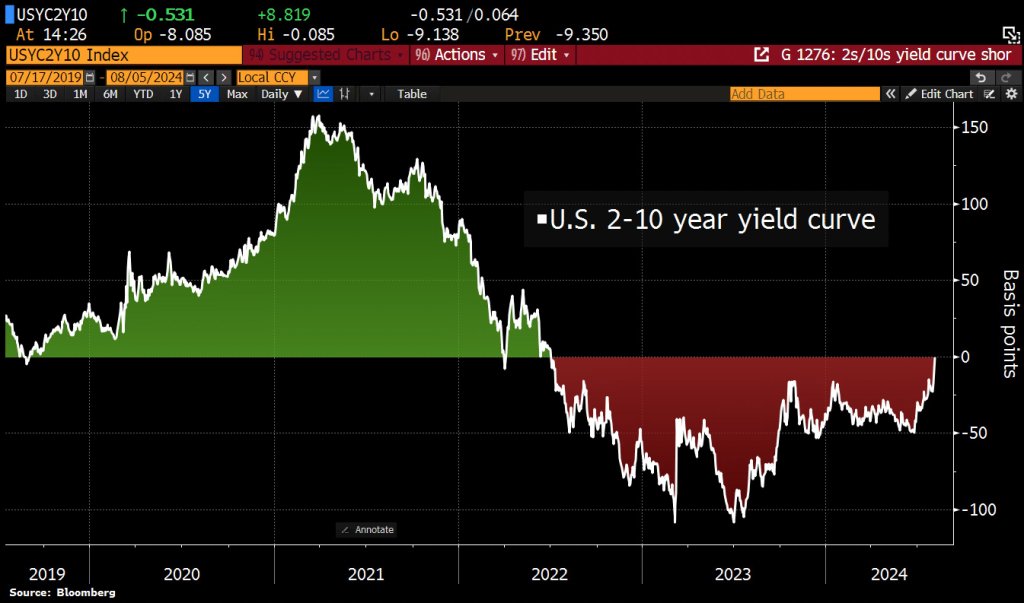
US 2s/10s yield spread is now flat for the 1st time since 2022 on aggressive repricing of Fed rate cuts. US 2y yields have plunged by 70bps to 3.69% since last Wed while US 10y yields only dropped by 40bps in the same time.
Voters are head-over–heels for Kamala Harris, a dim-witted Marxist authoritarian.
Remember the TV show “The Biggest :Loser”? That show was about weight loss.
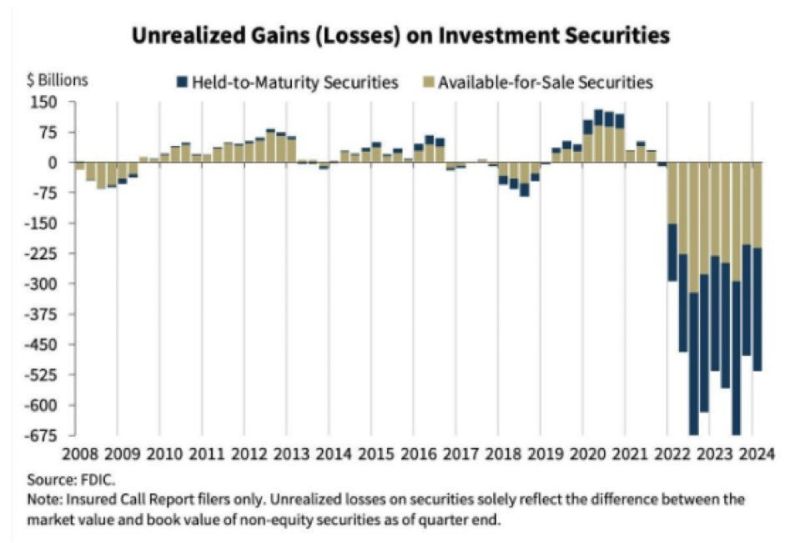
Now The Federal Reserve has posted a record loss of $114 BILLION IN 2023.

The cause of the loss? Massive expansion of The Fed’s balance sheet coupled with rising interest rates. The two year track record of The Fed is truly appaling. With a bloated balance sheet, rising interest rates have caused staggering losses.

The Fed is the biggest loser!
And the biggest losers!

Bidenomics (actually Biden/Harrisnomics) is all about huge payoffs to large, powerful donors. A good example is The Chips Act, intended to bring chip manufacturing back to the US from Taiwan, China, etc. Biden/Harris doled out $8.5 BILLION to Intel … which just laid off 15% of it’s labor force or 15k workers.
Intel has suspended dividends and its stock price has crashed from above $45 in March now down to $21.48, a 53% loss in 4 months.

Bear in mind that a Harris Presidency would be more of the same wasteful, Communist-style centralized economic (mis)management. Perhaps even worse.
And on that dreadful jobs report on Friday, the VIX fear index soared (white line) to its highest level since March 2023.


You must be logged in to post a comment.