Remember the TV show “The Biggest :Loser”? That show was about weight loss.
Now The Federal Reserve has posted a record loss of $114 BILLION IN 2023.
The cause of the loss? Massive expansion of The Fed’s balance sheet coupled with rising interest rates. The two year track record of The Fed is truly appaling. With a bloated balance sheet, rising interest rates have caused staggering losses.
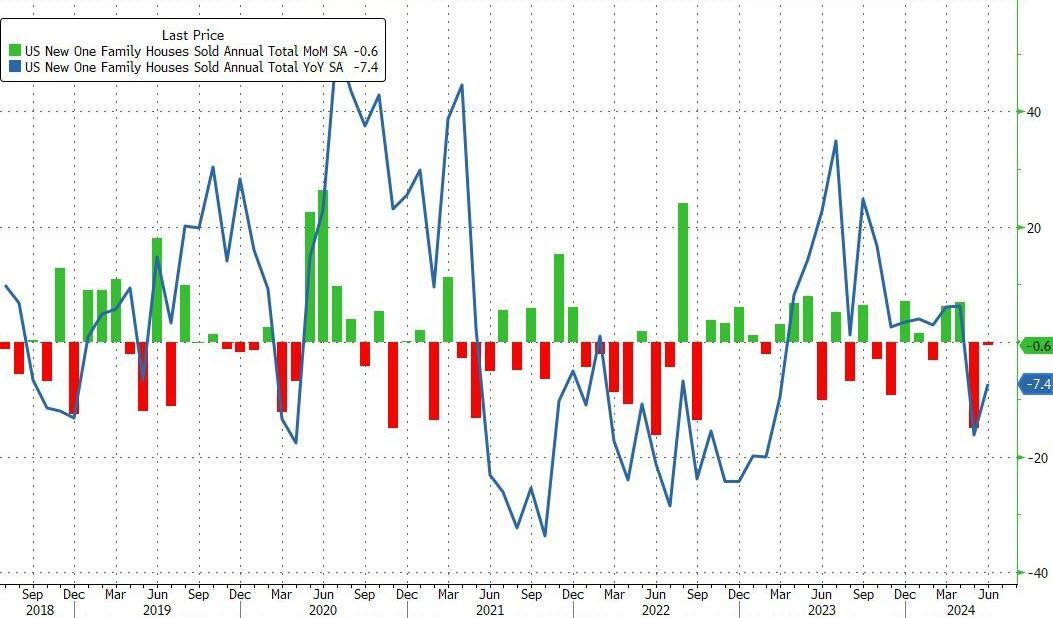
After a disappointing dump in existing home sales in June, new home sales just confirmed the slowdown, dropping 0.6% MoM (notably below the 3.4% MoM expected) and also saw a major downward revision in May from -11.3% MoM to -14.9% MoM. That leaves new home sales down 7.4% YoY…
Source: Bloomberg
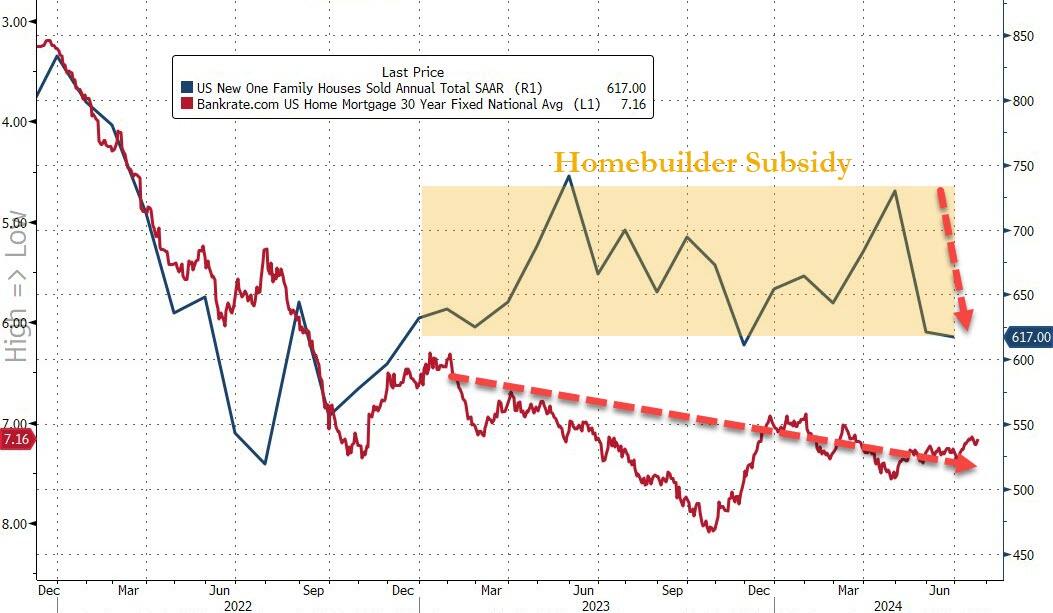
That shift dragged the new home sales SAAR down to 617k – basically unchanged since 2016…
Source: Bloomberg
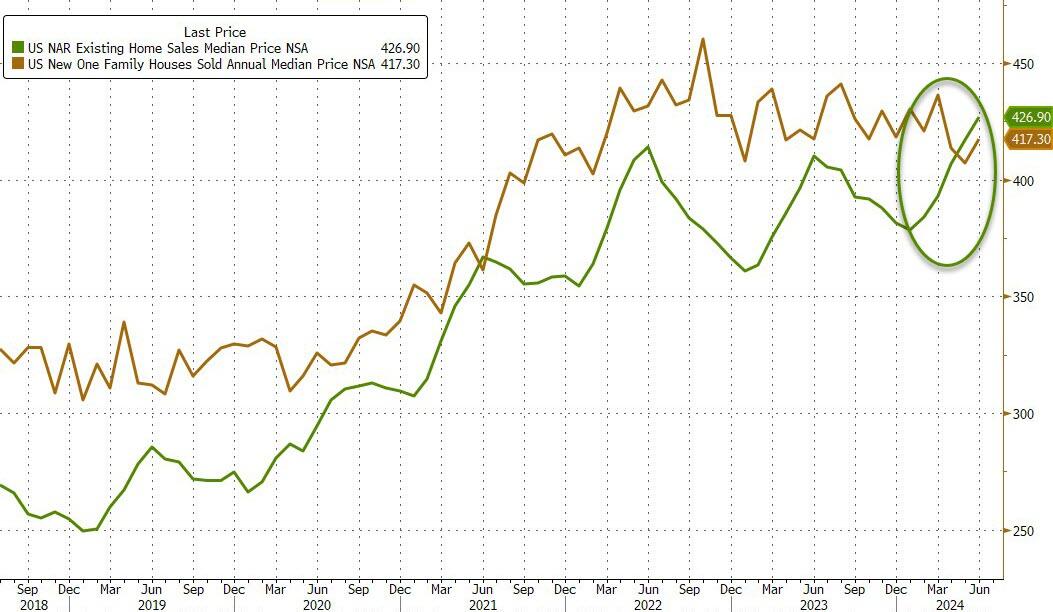
While the median new home price rose in June, it remains below the median existing home price…
Source: Bloomberg
It appears the homebuilder subsidy fad is wearing off as mortgage rates show no signs of easing significantly…
Source: Bloomberg
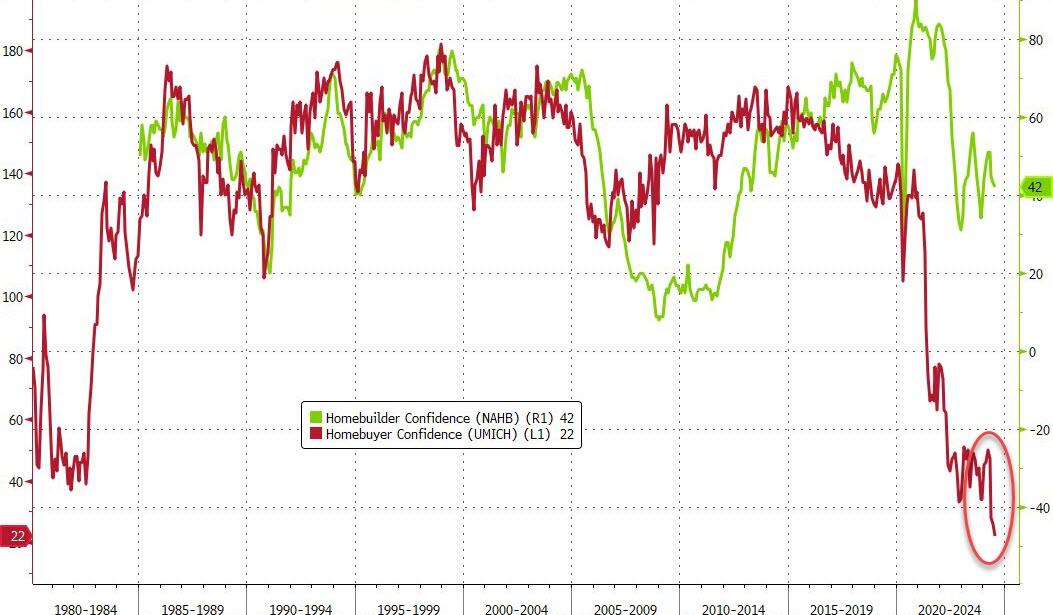
Of course, none of this should be a surprise as homebuyer confidence has collapsed to an all-time record low…
Source: Bloomberg
Will cutting rates help?
Probably not. Bidenomics is now called Harrisnomics (or Cacklenomics) since Harris as VP was the tiereaker in the US Senate. So, she holds some responsibility for the outrageous, wasteful spending in Washington DC.
Here is a chart of Non-commerciak net positions for US Treasuries, currently showing more bailing out of Treasury positions. Has the world sours on DC’s fiscal train wreck and The Fed?
Of course, budget deficits are a disaster with Biden/Congress spending like drunken sailors in port and showing no signs of letting up. The good news? At least a court struck down Biden’s illegal cancelation of student debt (a desperate attempt to win votes). That would have spiked the budget deficit.
As I pointed out yesterday, the UNFUNDED entitlements promised by the Federal government are now larger than that total national assets (business, household). In other words, if the US liquidated ALL assets, they couldn’t pay off the UNFUNDED entitlements. And good luck taking away the entitlements!
President Biden was expected yesterday to propose a cap of 5% on annual rent increases for tenants of major apartment landlords, and he did. Whether it can happen is something else.
As the White House communicatedon Tuesday, the administration is looking for Congress to pass legislation for landlords with more than 50 units in their portfolios, that being the proxy for institutional owners, although it would also affect private investors, family offices, and others that might own at least that many units. According to administration calculations, the total pool would cover 20 million rental units.
The law would then give landlords a choice. They could either restrict annual rent increases to no more than 5% a year or they would forfeit the ability to take fast depreciation of rental housing. There would be an exception for new construction or “substantial renovation or rehabilitation.”
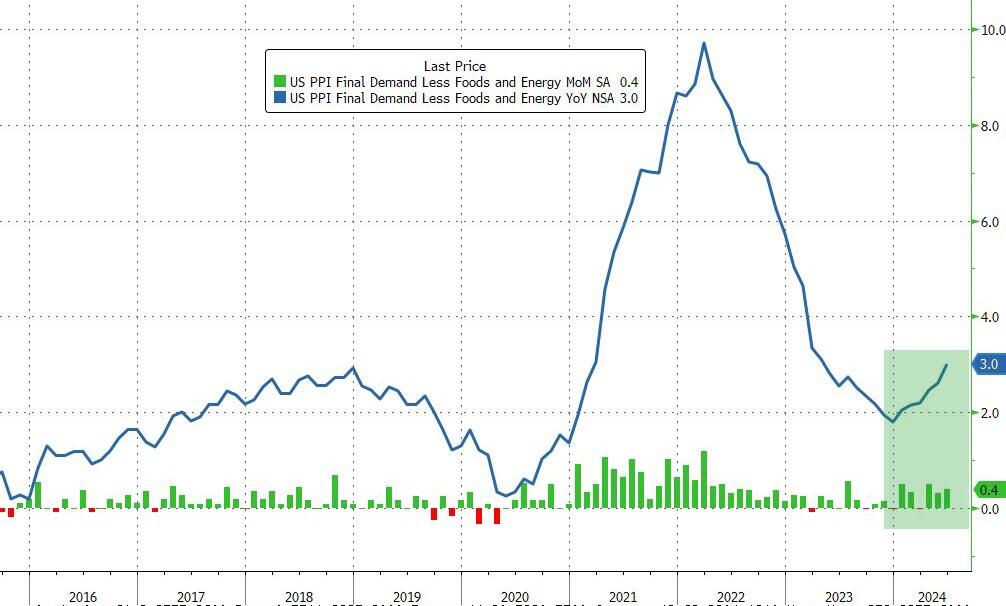
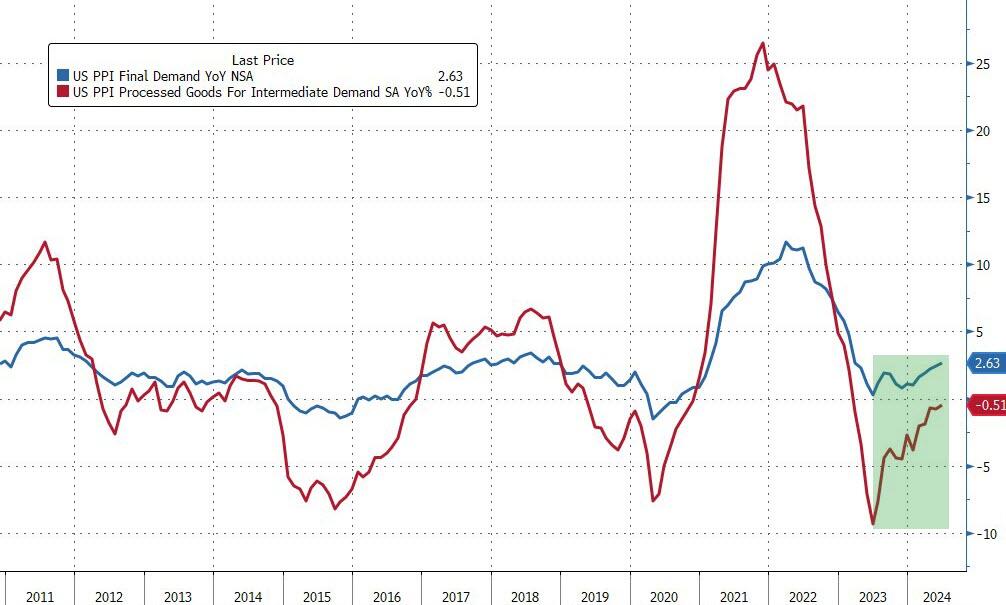
Core PPI rose by 0.4% MoM (double the 0.2% exp), sending the YoY price rise up by 3.0% (also the hottest since March 2023)…
Source: Bloomberg
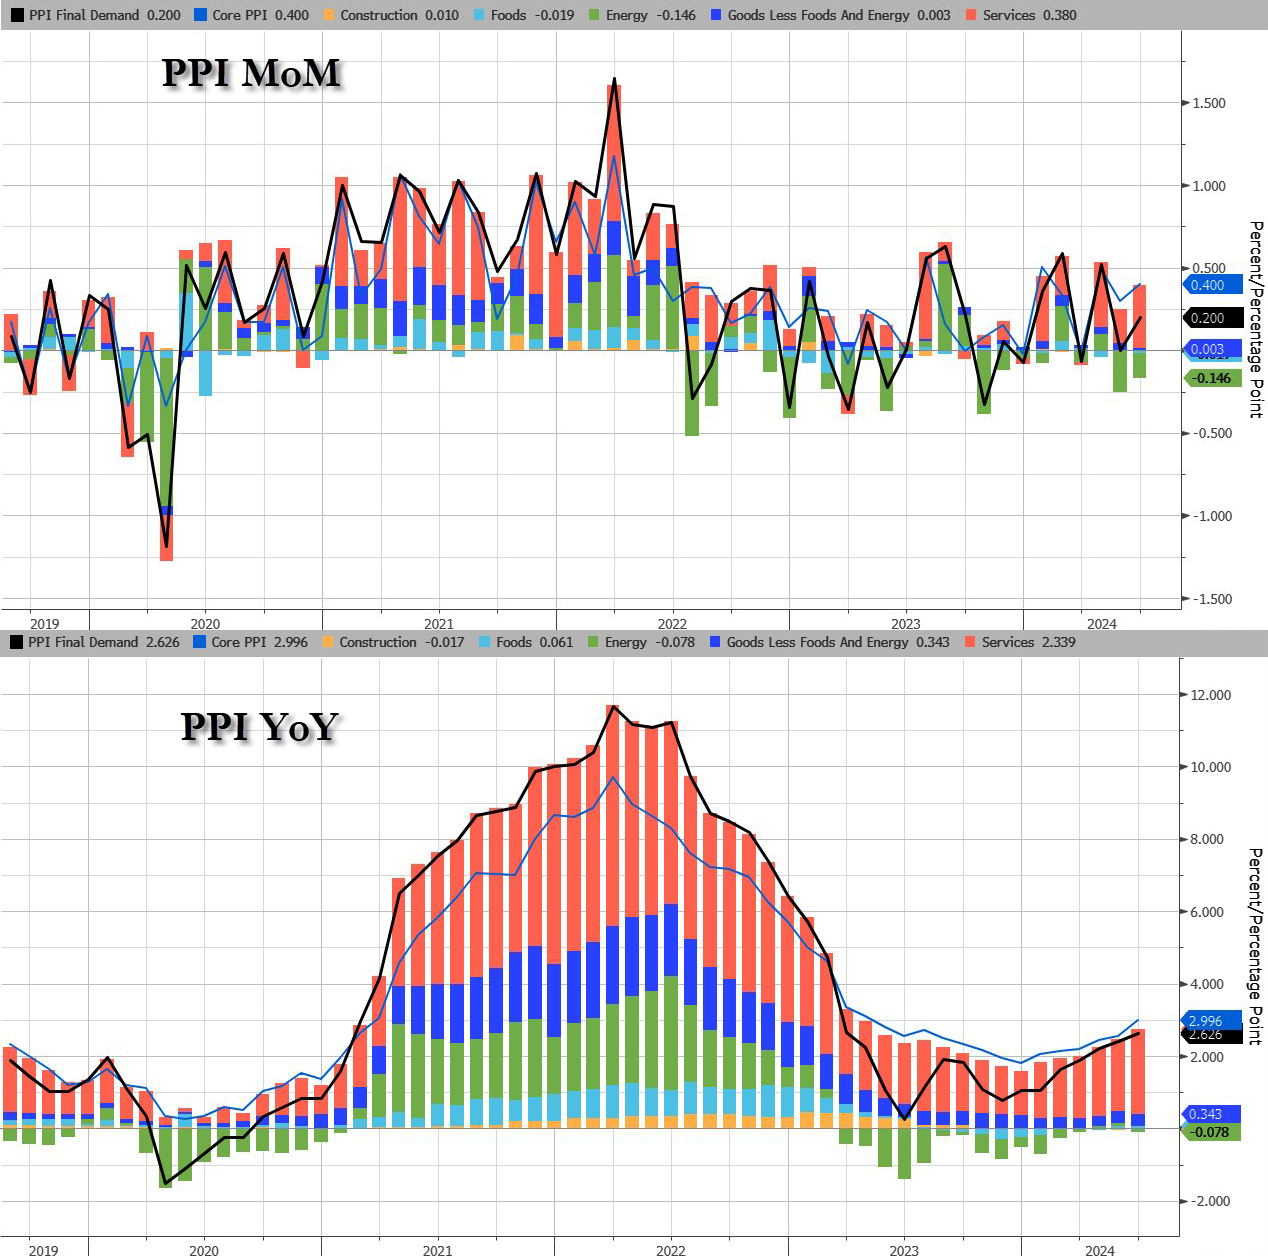
The jump in PPI was driven by a resurgence in Services costs as Energy remains deflationary (for now)…
Source: Bloomberg
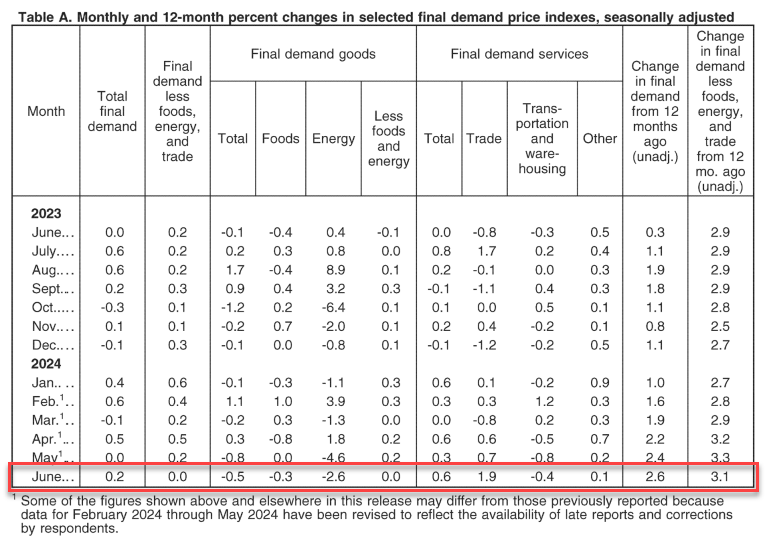
The June rise in the index for final demand can be traced to a 0.6-percent increase in prices for final demand services. In contrast, the index for final demand goods decreased 0.5 percent
Perhaps worse still, the pipeline for PPI (intermediate demand) is accelerating…
Source: Bloomberg
On the housing side, buying conditions for housing tanks to all-time low.
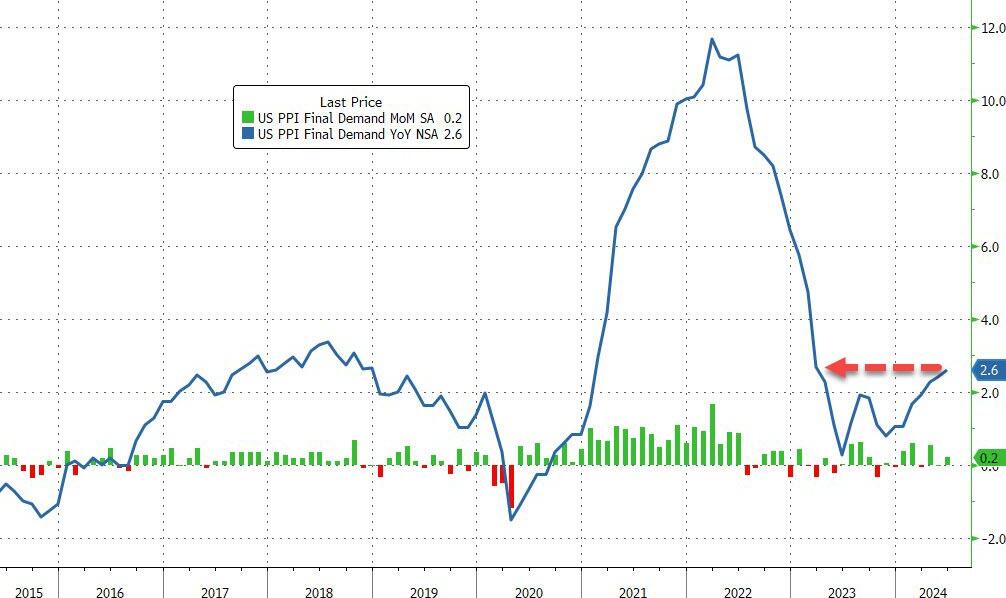
Are you ready? You can tell an election is on the radar since inflation numbers are settling down for the most part. According to the BLS, overall inflation fell slightly in June to 3.0%.
Shelter CPI is up 5.14% YoY as M2 Money growth has been rising slowly … again.
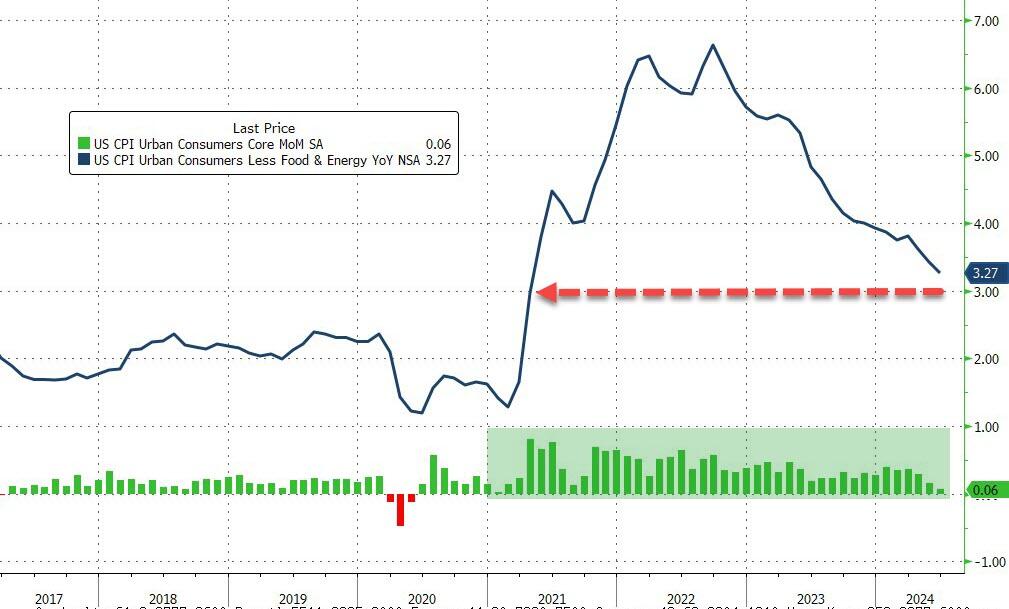
Core CPI also ‘missed’, rising just 0.1% MoM (vs +0.2% exp), dragging the YoY Core CPI down to +3.27% – its lowest since April 2021…
Source: Bloomberg
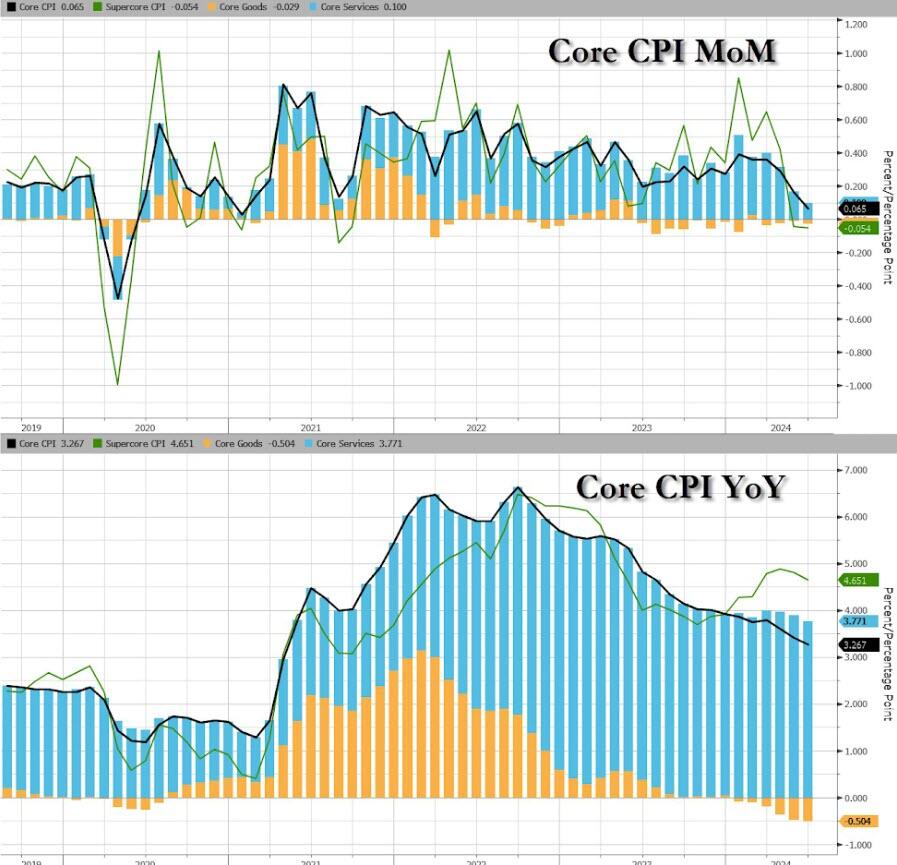
Goods deflation also dominates core prices disinflationary trend…
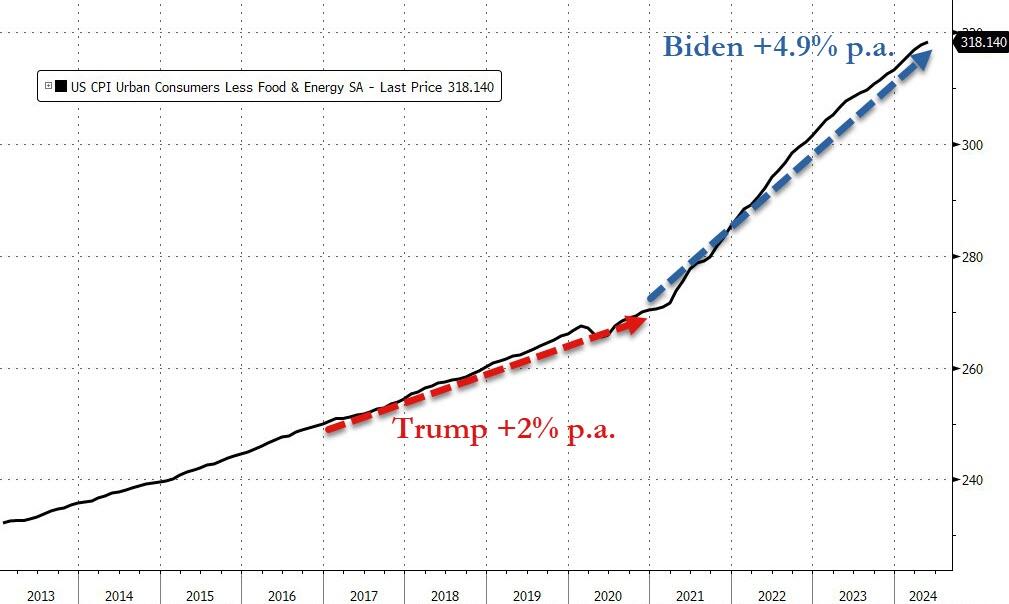
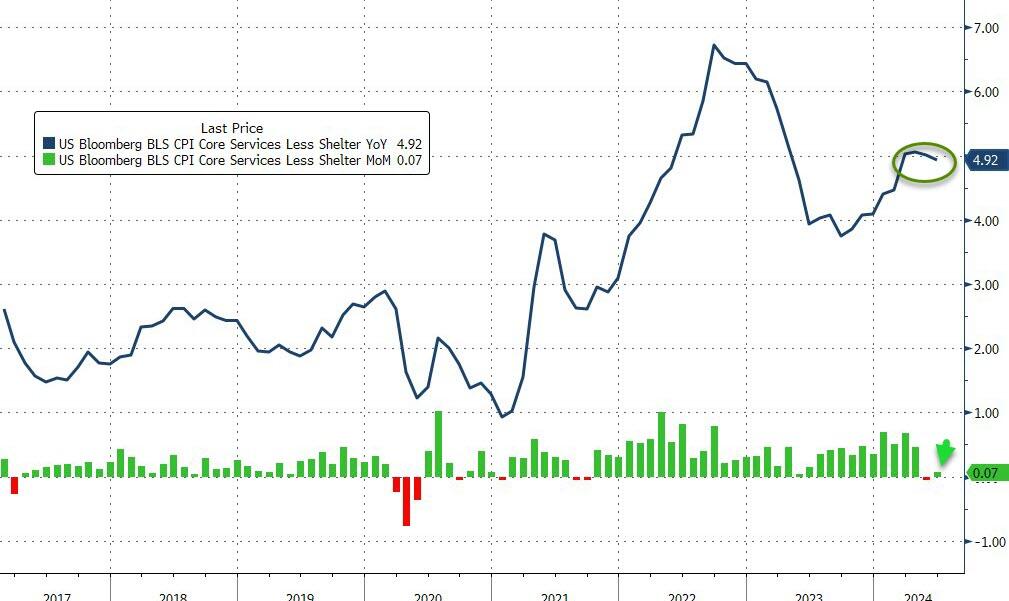
We do note that Core consumer prices have still not seen a single monthly decline since Bidenomics began.
Core consumer prices are up just under 18% since Bidenomics began (+4.9% per annum) – that is dramatically higher than the 2.0% per annum Americans experienced under Trump…
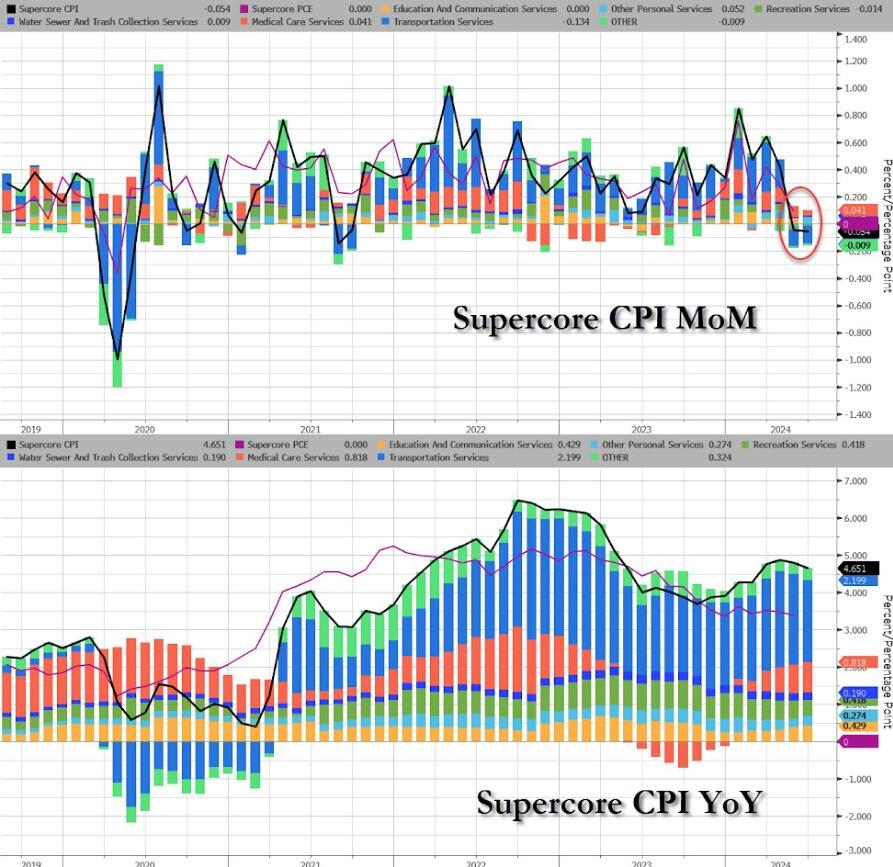
The much-watched SuperCore CPI rose on a MoM basis but declined (back below 5.0%) on a YoY basis (but obviously remains extremely elevated)…
Source: Bloomberg
Transportation Services are seeing prices fall…
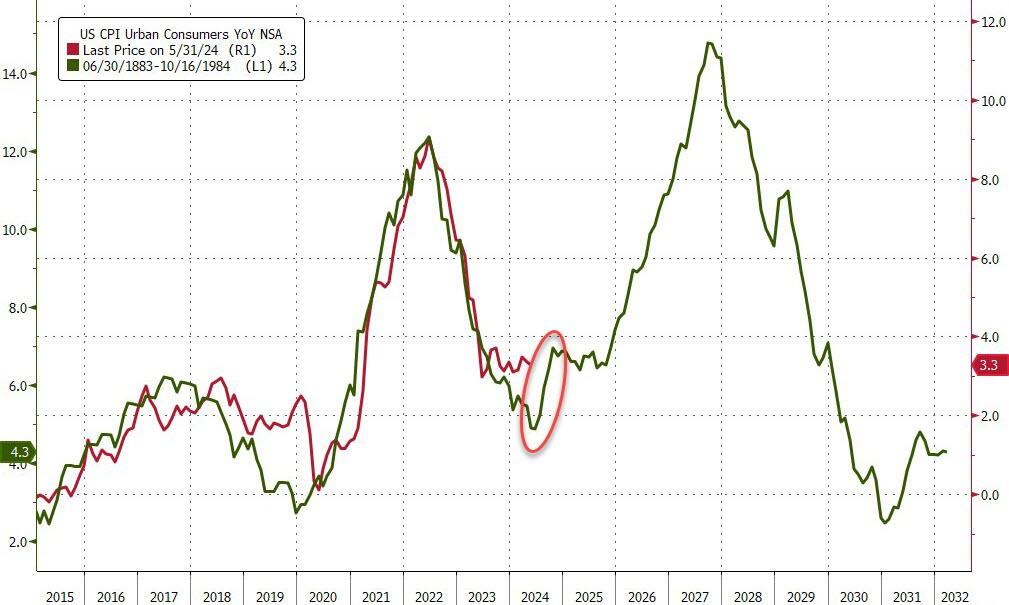
Finally, we can’t help but get a sense of deja vu all over again here. What if… The Fed cuts (because bad – recession – data), Biden loses (because dementia), and inflation re-accelerates (just like in the 80s)…
Source: Bloomberg
Challenger job cuts in construction we the highest since 2008 putting downward pressure on wages.
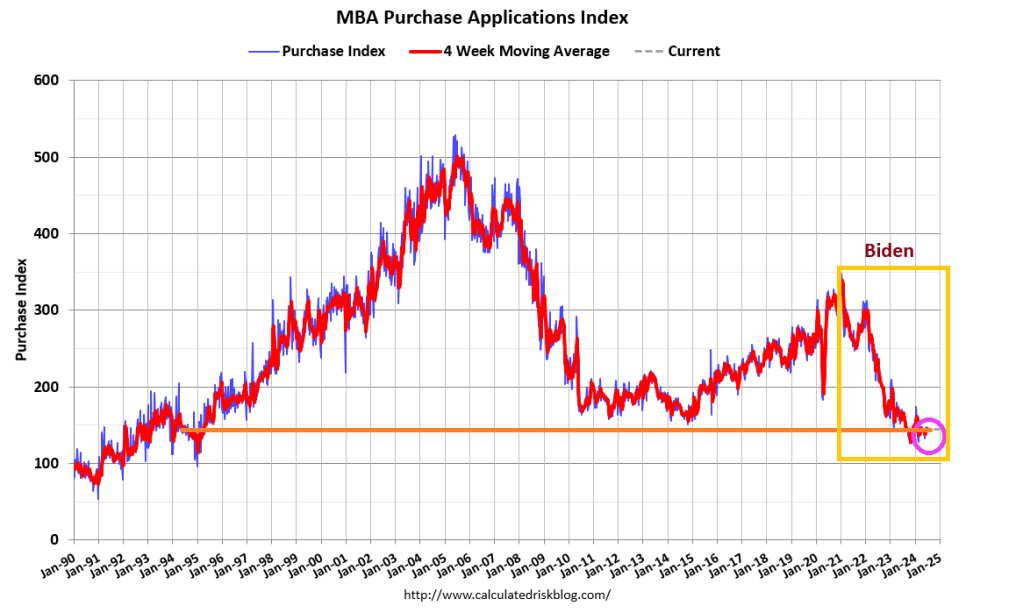
Mortgage applications decreased 0.2 percent from one week earlier, according to data from the Mortgage Bankers Association’s (MBA) Weekly Applications Survey for the week ending July 5, 2024. Last week’s results included an adjustment for the July 4th holiday.
The Market Composite Index, a measure of mortgage loan application volume, decreased 0.2 percent on a seasonally adjusted basis from one week earlier. On an unadjusted basis, the Index decreased 20 percent compared with the previous week. The seasonally adjusted Purchase Index increased 1 percent from one week earlier. The unadjusted Purchase Index decreased 19 percent compared with the previous week and was 13 percent lower than the same week one year ago.
The Refinance Index decreased 2 percent from the previous week and was 28 percent higher than the same week one year ago.
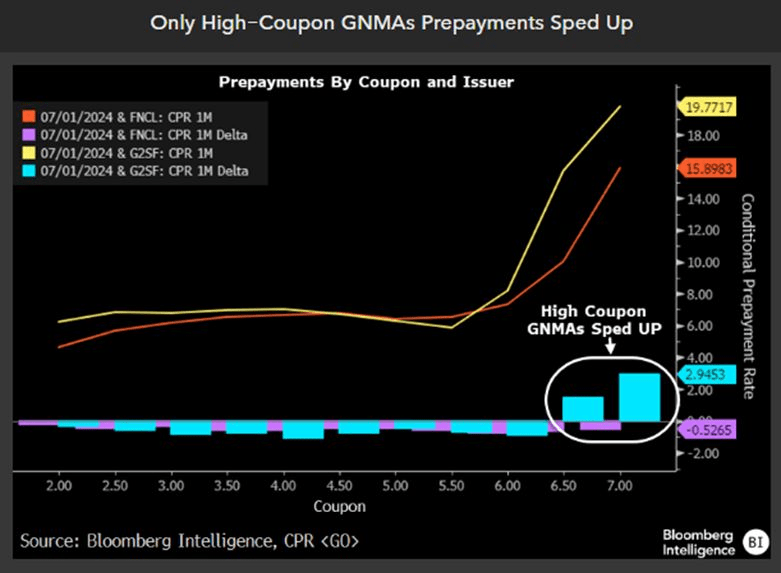
Mprtgage prepays fell less than daycoiunt.
But on;y high-coupn GNMAs prepayments sped up.
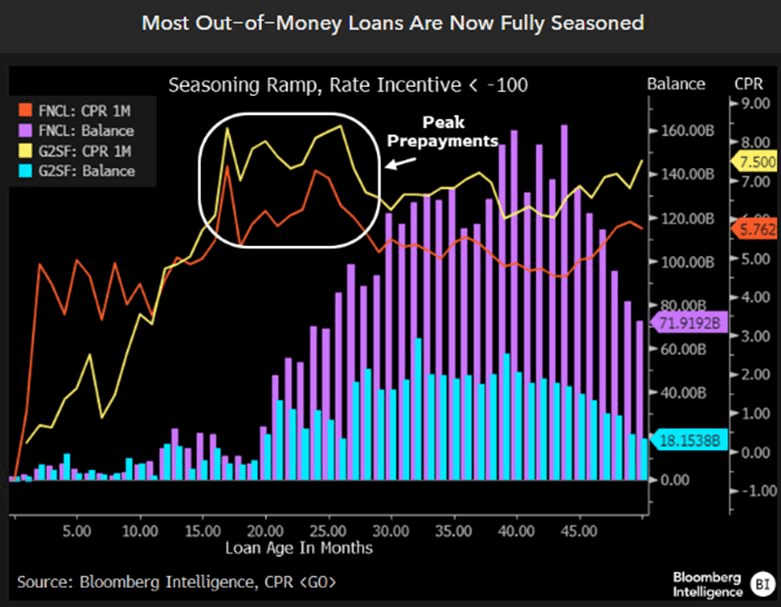
Finally, most out-of-the-money loans are now fully seasoned.


You must be logged in to post a comment.