Another bad housing report for July, this time its housing starts.
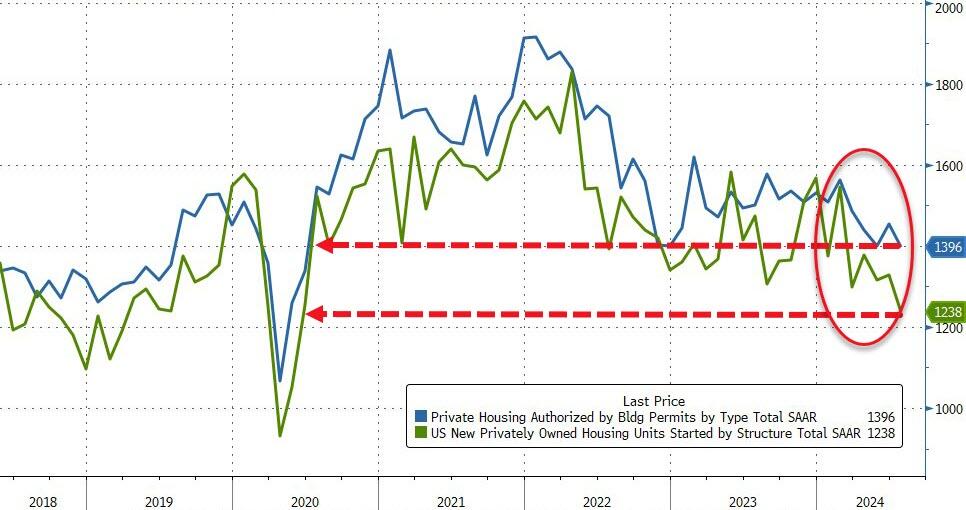
Housing starts declined in July to the lowest level since the Covid economic lockdowns.
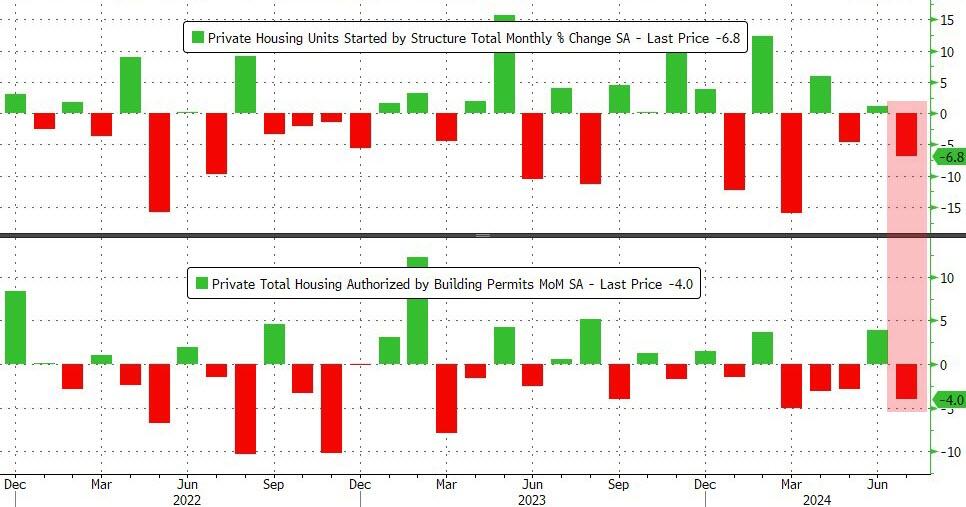
Housing starts fell -6.8% in July.
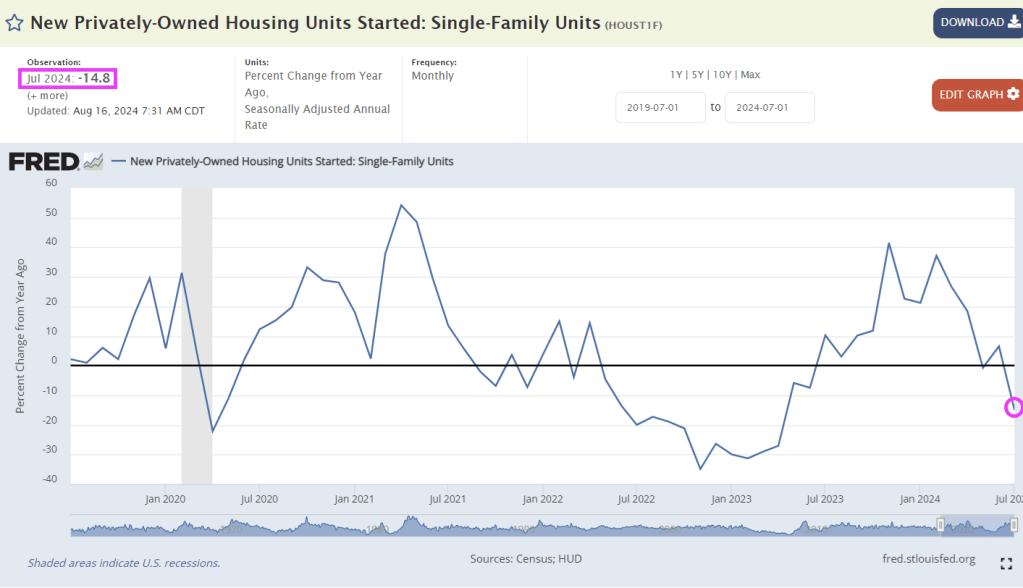
On a YoY basis, housing starts fell -14.8% YoY.
Confounded Interest – Anthony B. Sanders
Financial Markets And Real Estate
Another bad housing report for July, this time its housing starts.
Housing starts declined in July to the lowest level since the Covid economic lockdowns.
Housing starts fell -6.8% in July.
On a YoY basis, housing starts fell -14.8% YoY.
After the unoriginal Vice President Kamala Harris stole former President Trump’s proposed ‘no tax on tips’ policy, she’s at it again with yet another recycled idea. This time, she’s echoing President Biden’s actions and rhetoric to crack down on sky-high food prices by proposing the first-ever federal ban on “corporate price-gouging in the food and grocery industries”—a move that reeks of socialism.
“There’s a big difference between fair pricing in competitive markets, and excessive prices unrelated to the costs of doing business,” the Harris campaign wrote in a statement, adding, “Americans can see that difference in their grocery bills.”
The Harris campaign said the vice president will unveil the new federal proposed ban on Friday at a campaign rally in the battleground state of North Carolina as part of a broader economic policy platform. The proposal will ensure food companies can’t exploit consumers to increase profits, according to CBS News, citing Harris-Walz campaign officials.
Harris’ policy speech will also call on the Federal Trade Commission and state attorneys to examine corporations violating price-fixing rules. Her remarks are expected to echo Biden’s actions and rhetoric, especially with his war against meat processing companies that he alleges are responsible for higher burger prices at the supermarket.
VP Harris’ campaign argues that lowering Americans’ costs is a function of socialist-style price controls. Yet this is the quickest way to understand that Harris’ economic team has no actual understanding of inflation.
Heritage Foundation’s EJ Antoni explained, “Here’s your “price gouging” narrative: average costs paid by businesses have risen just as much as costs charged to consumers – if businesses are being “greedy,” they’re doing it all wrong…”

Instead of curbing out-of-control government spending, which debt rises $1 trillion every 100 days, and understanding that monetary inflation driven by the Federal Reserve’s money creation is the root cause of inflation, Harris deflects the actual problem: The Fed. She instead goes after big corporations for ‘illegal price gouging.’
Here’s a snippet of Money Metals Midweek Memo’s Mike Maharrey commenting on Harris’ proposed price-fixing ban on big food companies:
The second “dumb” idea Maharrey discussed came from Vice President Kamala Harris, who was recently asked about her plan to combat inflation. Maharrey criticized her response, which he described as “word salad,” pointing out that she merely acknowledged the problem without offering any concrete solutions. Instead, she promised to take on “big corporations” engaging in “illegal price gouging,” corporate landlords, and big pharma.
Maharrey argued that Harris’s approach misses the root cause of inflation, which is monetary inflation driven by the Federal Reserve’s money creation. He cited the July budget deficit data, revealing that the Biden administration spent another $574 billion in just one month, running a $243 billion deficit. Maharrey emphasized that inflation is not caused by corporate greed but by the government’s excessive spending and borrowing.
“Price inflation is a symptom of monetary inflation, which has everything to do with money creation by the Federal Reserve,” Maharrey explained. He warned that Harris’s proposed policies, including price controls, would likely lead to shortages and exacerbate the problem rather than solve it.
Kamalanomics = ‘communist economics’ as some X users describe…
“We are no longer talking about hypothetical communism, we are talking about two straight up communists who want to institute a federal price ban on food and a federal minimum wage that is going to make every corporation go out of business.
…
Voting for communism is not the solution to your precious feelings.”
Grocery stores have a 3-4% profit margin if they are lucky.

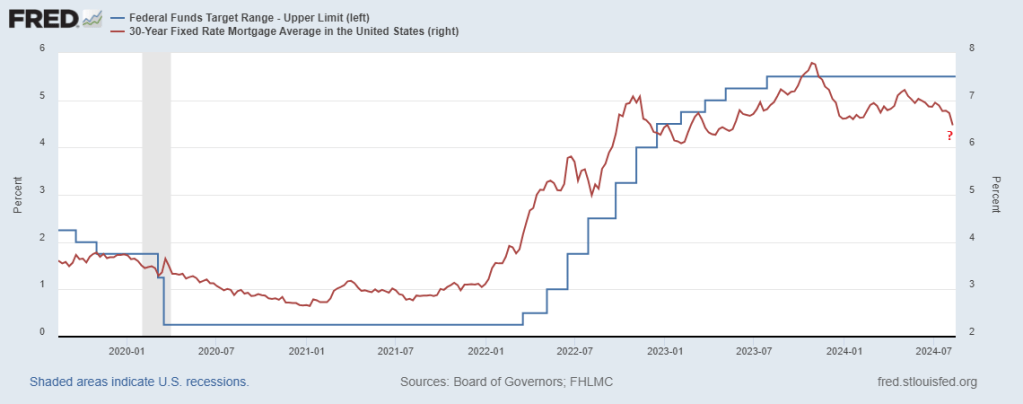
Freddie King said it best! Interest rates are goin’ down!
Yes. traders expect The Fed to cut their target rate from 5.50% (current rate) tp 4.297% by the December meeting. That is a whopping 120 basis points.
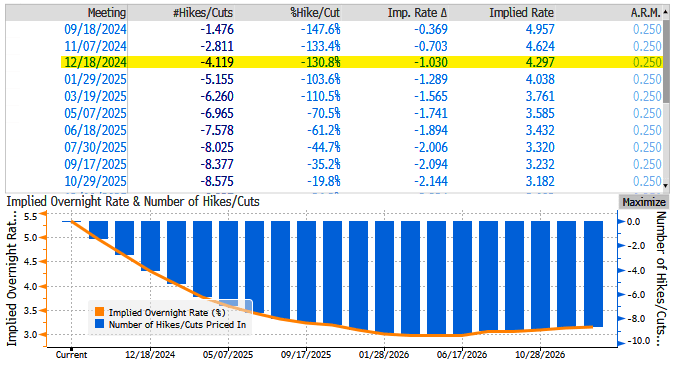
And expect another 100 basis points of cuts by the September 2025 Fed FOMC meeting. Down to 3.232%.
Mortgage rates will fall.
Like the Roman Empire. Et tu Kamala?

Core inflation is still hot at 3.2% YoY, although cooling.
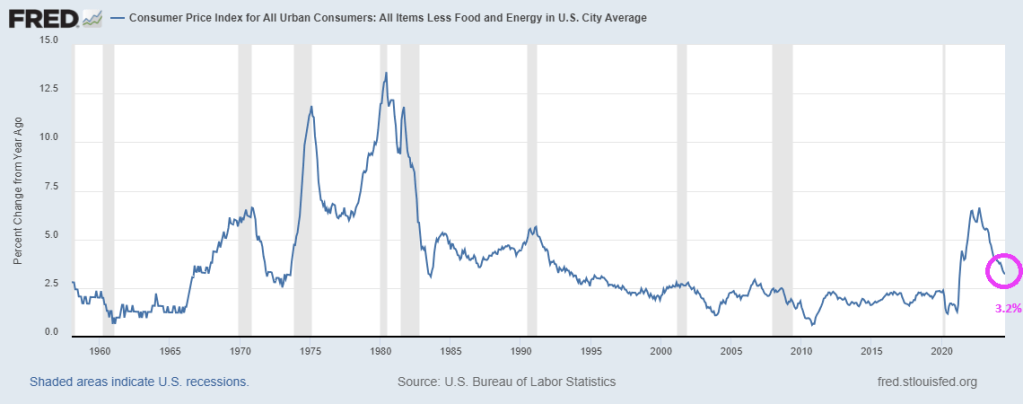
Core CPI also rose 0.2% MoM (as expected), and the YoY rate of inflation slowed to 3.2% (from 3.3%) – the lowest since April 2021…

However, that is the 50th straight month of MoM increases in Core CPI, and a record high…
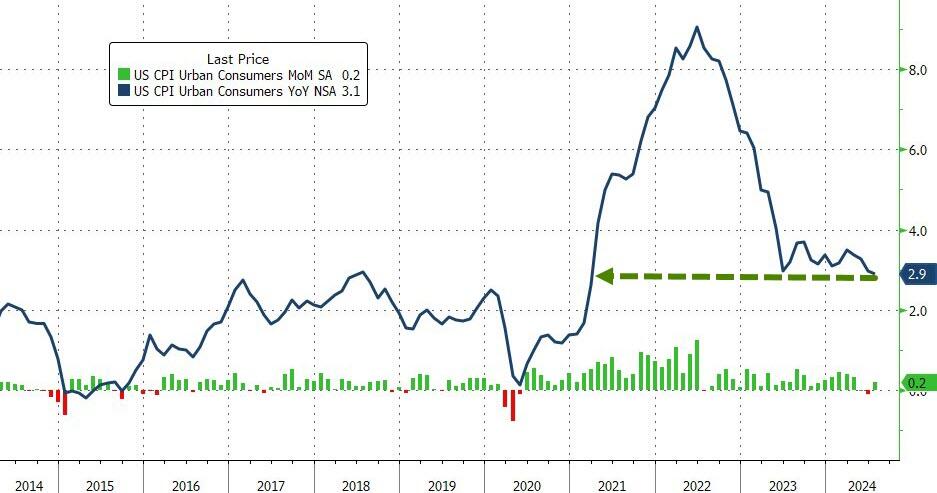
Under the hood, used car prices fell 2.3% along with airline fares (-1.2%) while Car insurance costs jumped 1.2% and furniture prices rose 0.3%…
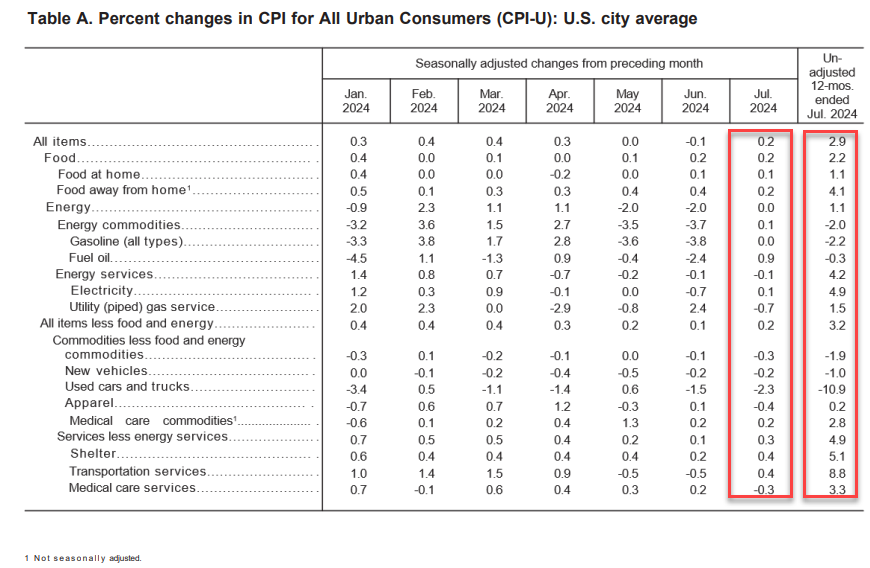
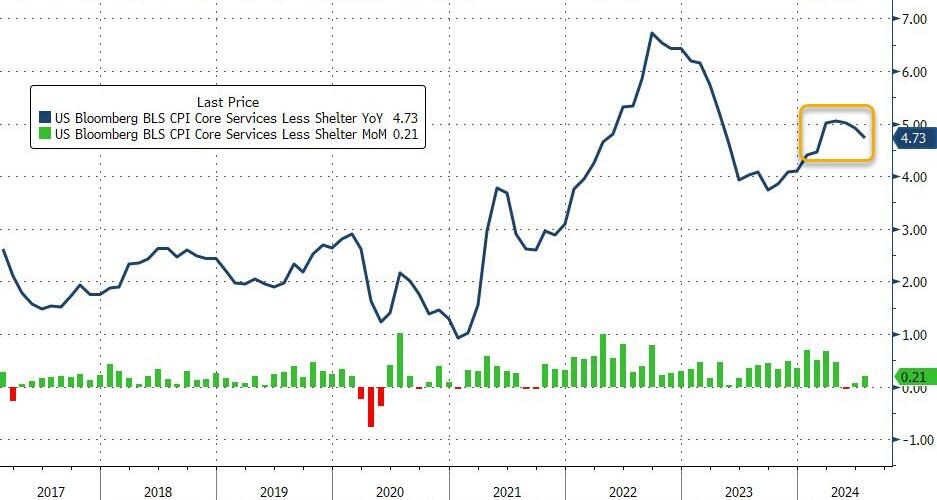
Finally, the so-called SuperCore CPI rose 0.2% MoM (same as the rest), dragging the YoY down to 4.73% (still notably elevated)…
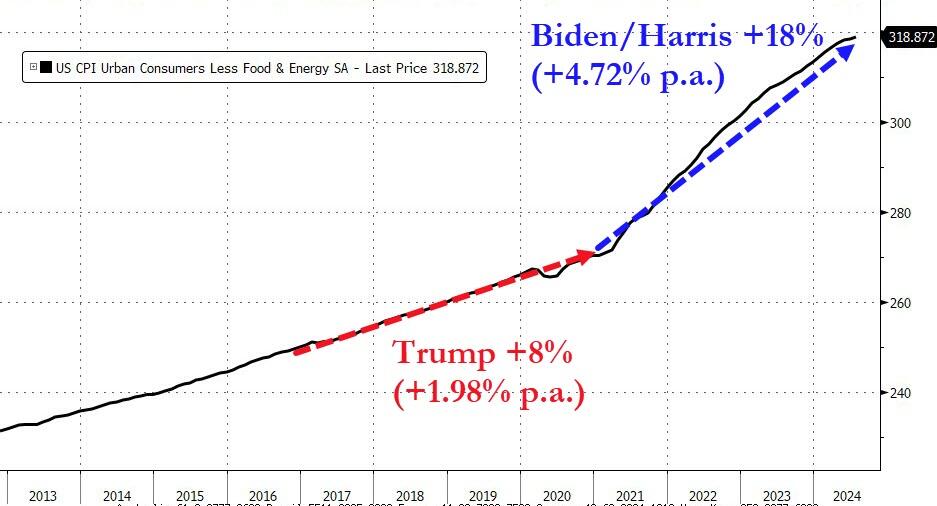
A sad reminder about the impact of Biden/Harrisnomics on food prices.

Inflation is still crazy after 4 years of Biden/Harris. What will The Fed do?
Is this The Big Short, CMBS style?
The delinquency rate on commercial mortgage-backed securities (CMBS) for offices spiked to 8.1% in July, the highest in 11 years.
The delinquency rate of office CMBS loans has QUADRUPLED in 1.5 years.
Delinquencies are currently rising at a faster pace than during the 2008 Financial Crisis.
A top AAA-rated CMBS experienced a $40 million loss in May for the first time since the 2008 Financial Crisis.

While not an office, Edward Hopper painted some great real estate properties!

Kamala Harris, despite being VP for almost 4 years, is going to annouce her plans for taming inflation. Why doesn’t she do it now?? What Harris can’t control is The Federal Reserve that is losing money at breakneck speed.
Here is The Fed’s balance sheet.
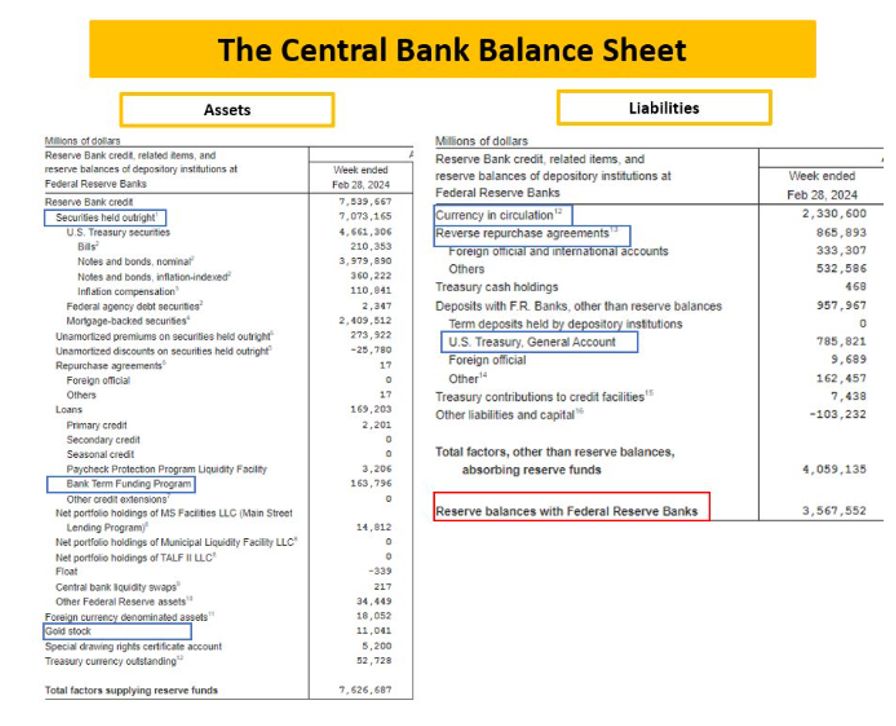
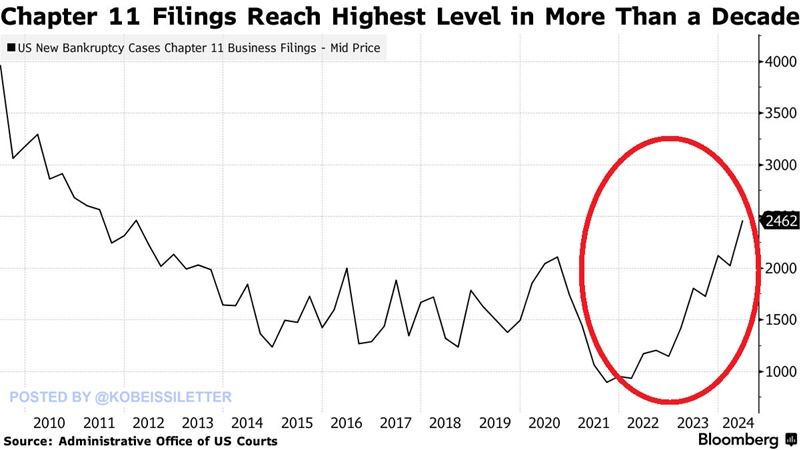
I shudder to think what Harris will propose to solve the highest bankrupty (Chap 11) rate in 13 years. Probably more Bidenomics (big wealth transfers to large corporations/donors).
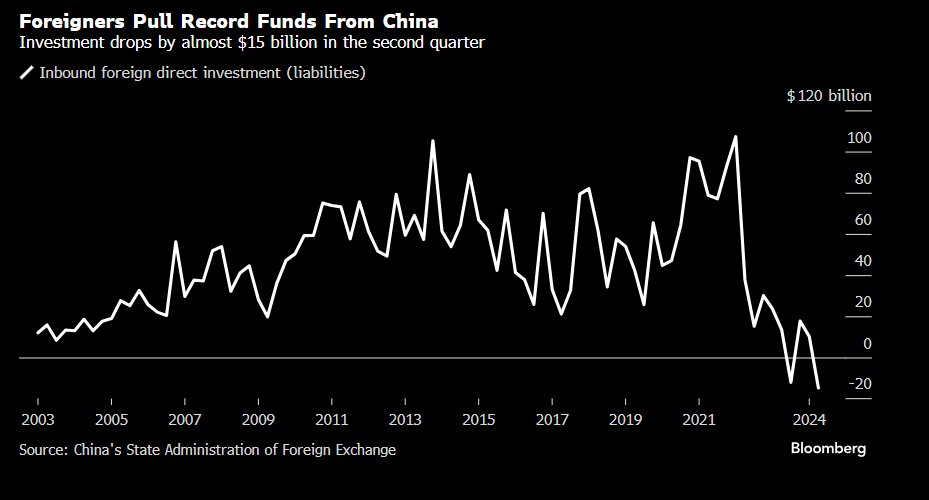
Meanwhile, foreigns pulled a record amount of funds from ailing China.
Kamala Harris will say anything to get elected, then fall back on her Communist agenda.

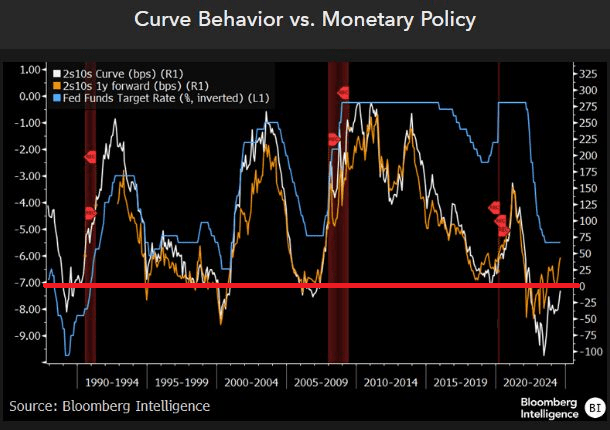
We know several things about the yield curve. First, it goes negative before recessions. Second, it is related to the inverse of The Fed’s target rate (blue line).
How about the US mortgage rate? Generally, US Mortgage rates are inverse to the 10Y-3M yield curve, but lately the US mortgage rate (pink circle) have declined with the 10Y-3M yield curve.
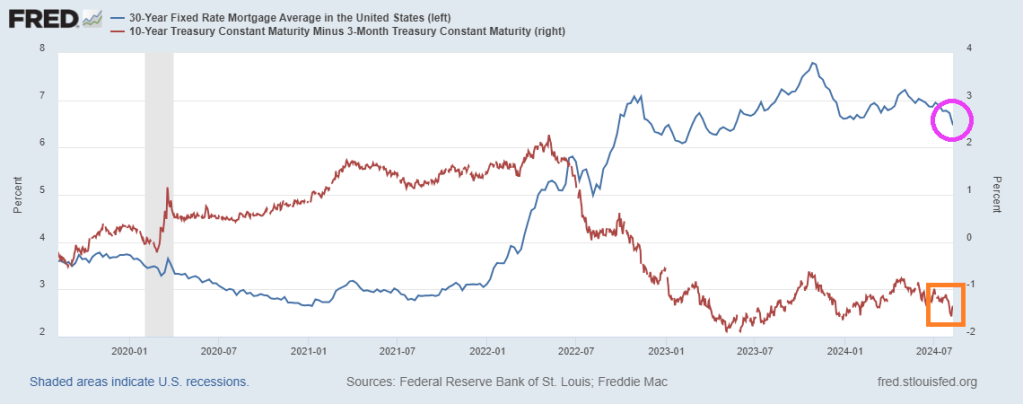
The yield curve does forecast recessions, but is unreliable in forecasting mortgage rate movements.

The slowing US economy has a silver lining: Treasury and mortgage rates are declining. And the is spurring faster mortgage prepayments.
Mortgage applications increased 6.9 percent from one week earlier, according to data from the Mortgage Bankers Association’s (MBA) Weekly Applications Survey for the week ending August 2, 2024.
The Market Composite Index, a measure of mortgage loan application volume, increased 6.9 percent on a seasonally adjusted basis from one week earlier. On an unadjusted basis, the Index increased 6 percent compared with the previous week. The seasonally adjusted Purchase Index increased 1 percent from one week earlier. The unadjusted Purchase Index increased 0.3 percent compared with the previous week and was 11 percent lower than the same week one year ago.

The Refinance Index increased 16 percent from the previous week and was 59 percent higher than the same week one year ago.

The average contract interest rate for 30-year fixed-rate mortgages with conforming loan balances ($766,550 or less) decreased to 6.55 percent from 6.82 percent, with points decreasing to 0.58 from 0.62 (including the origination fee) for 80 percent loan-to-value ratio (LTV) loans.

The deciine in rates led to an increase in MBS convexity.

Watch out! Mortgage convexity continues to rise!

Meanwhile, Kamala “The Kommie” Harris laughs.

The Fed’s theme song: Keep on printing!
Look at this chart of the S&P 500 index against M2 Money stock.

And this chart of Case-Shiller home prices against M2 Money.

Bottom line? The Fed has to keep on printing money. Otherwise, the US economy will collapse like a cheap building.
Here is Fed Chair Jerome Powell creating assets bubbles.

Remember the TV show “The Biggest :Loser”? That show was about weight loss.
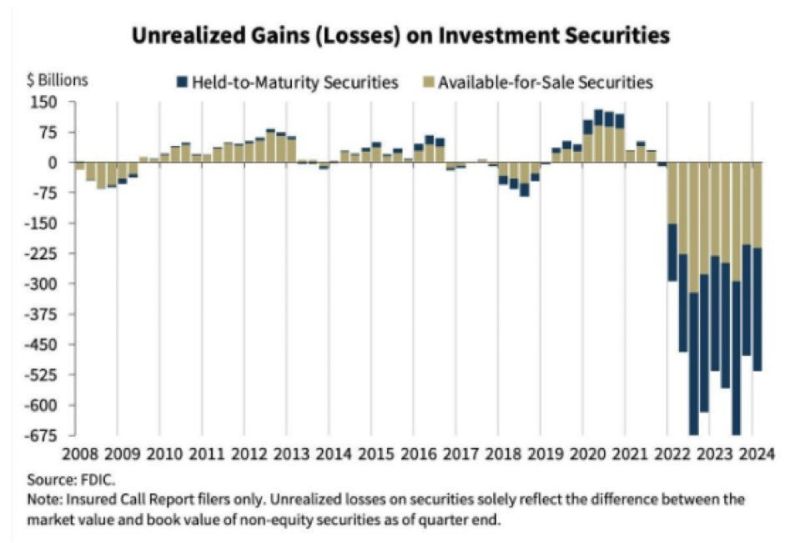
Now The Federal Reserve has posted a record loss of $114 BILLION IN 2023.

The cause of the loss? Massive expansion of The Fed’s balance sheet coupled with rising interest rates. The two year track record of The Fed is truly appaling. With a bloated balance sheet, rising interest rates have caused staggering losses.

The Fed is the biggest loser!
And the biggest losers!


You must be logged in to post a comment.