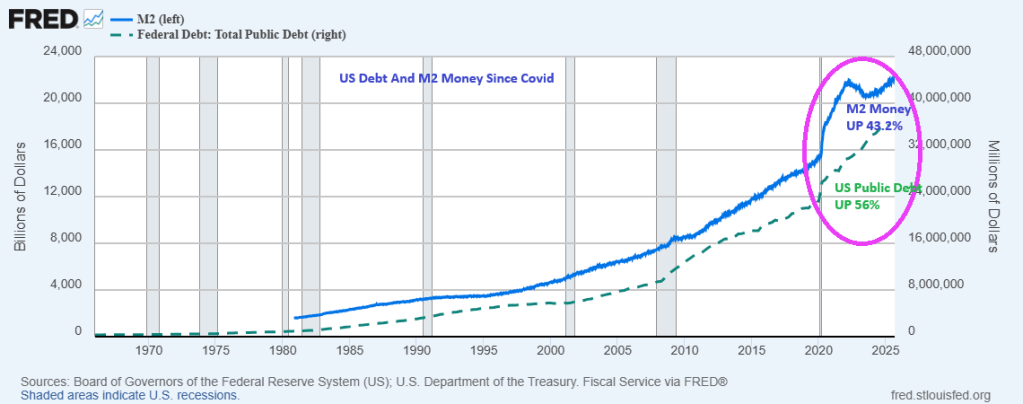
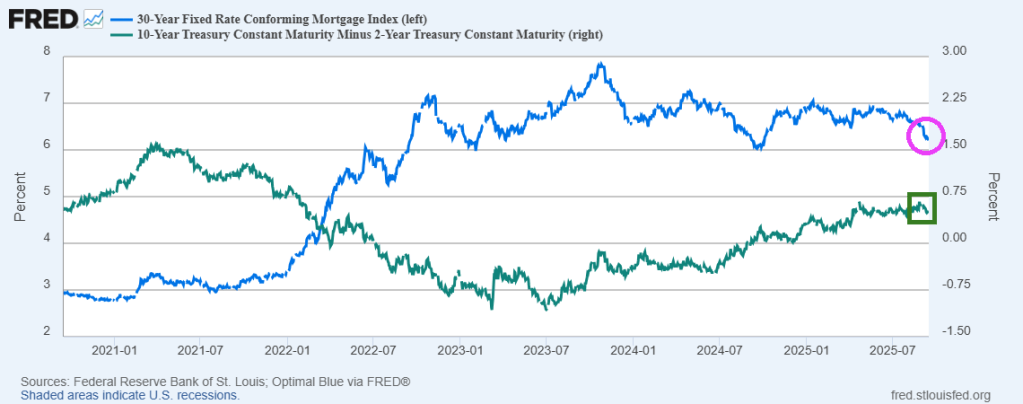
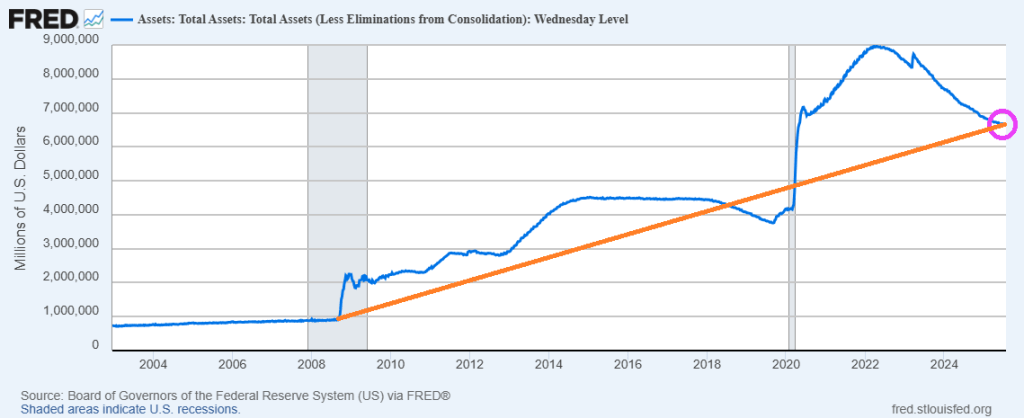
The Federal government is having a party! A spending party requiring massive growth in Federal borrowing AND Fed M2 money printing.
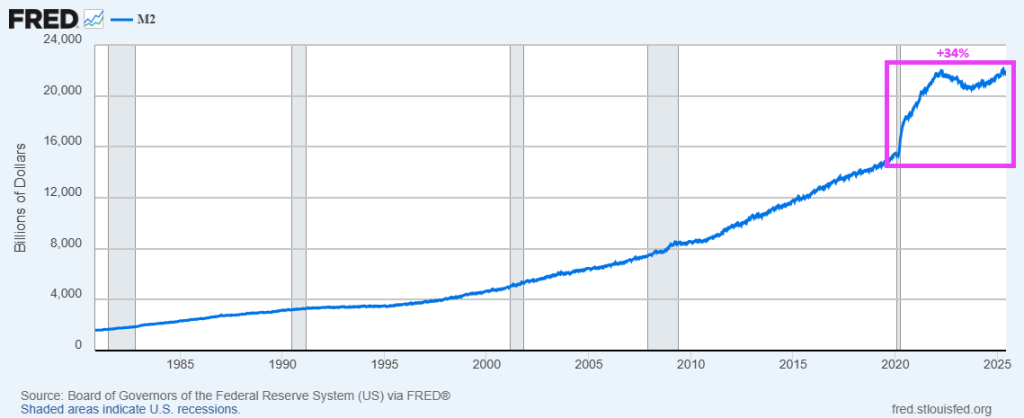
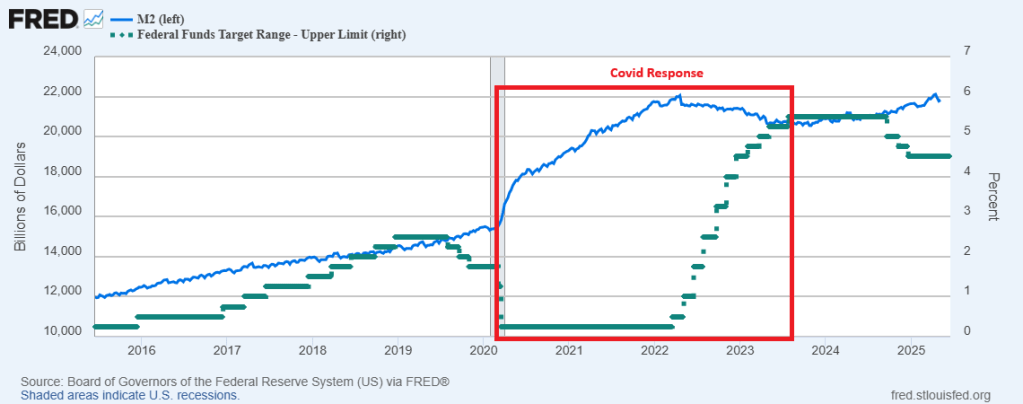
Federal borrowing has increased by 56% since Covid in 2020. And Fed M2 Money increased by 43.2% since Covid outbreak.
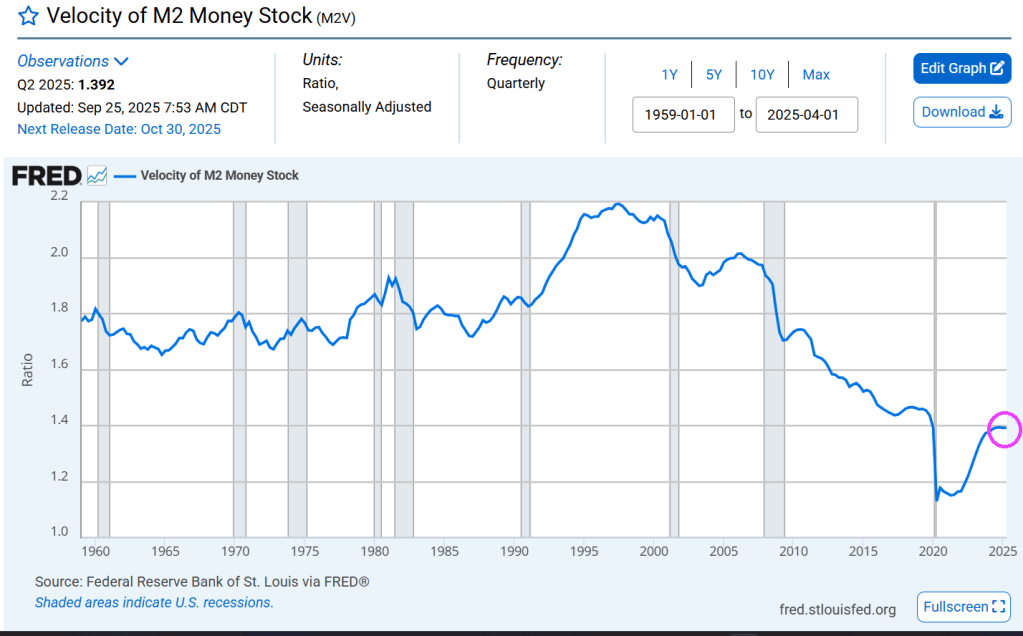
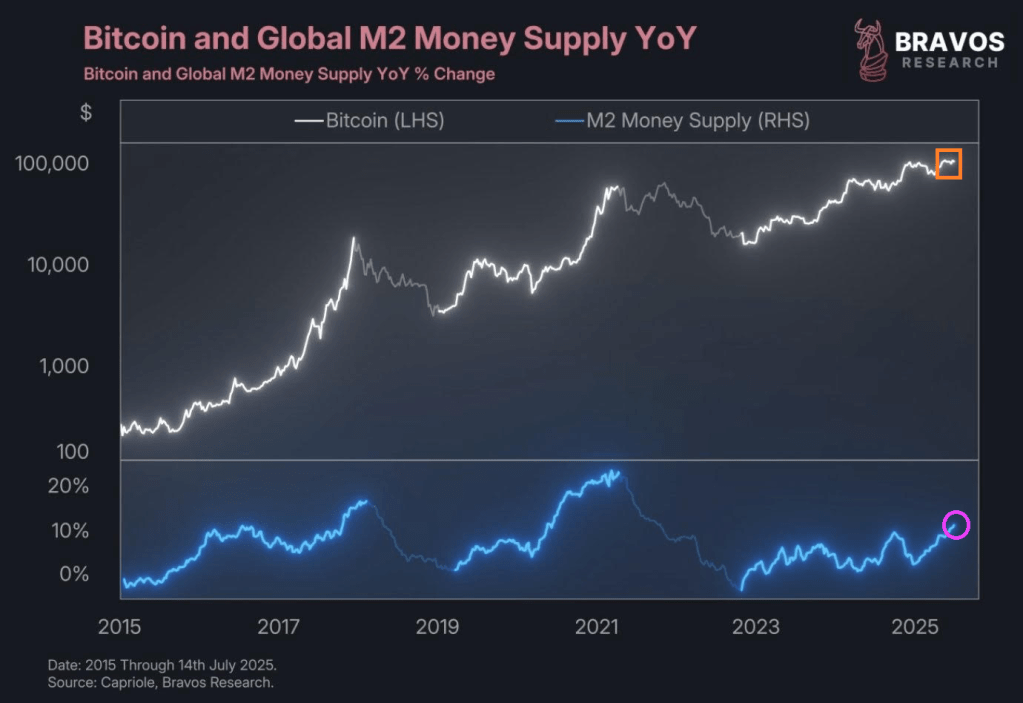
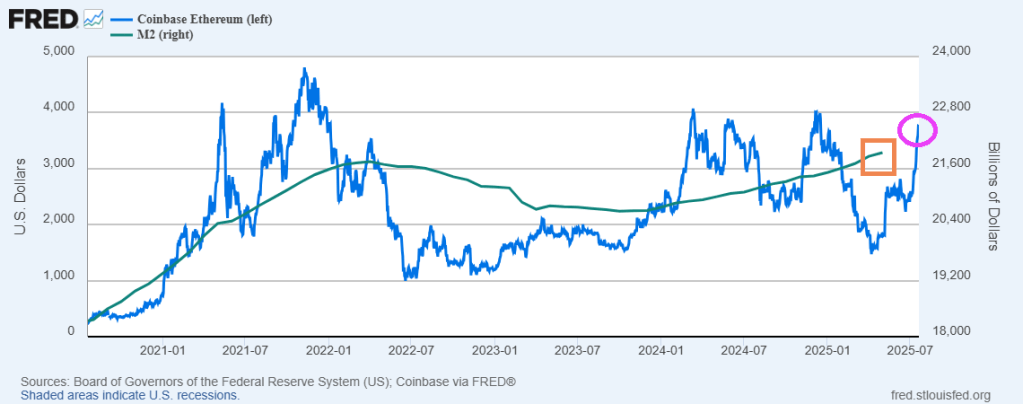
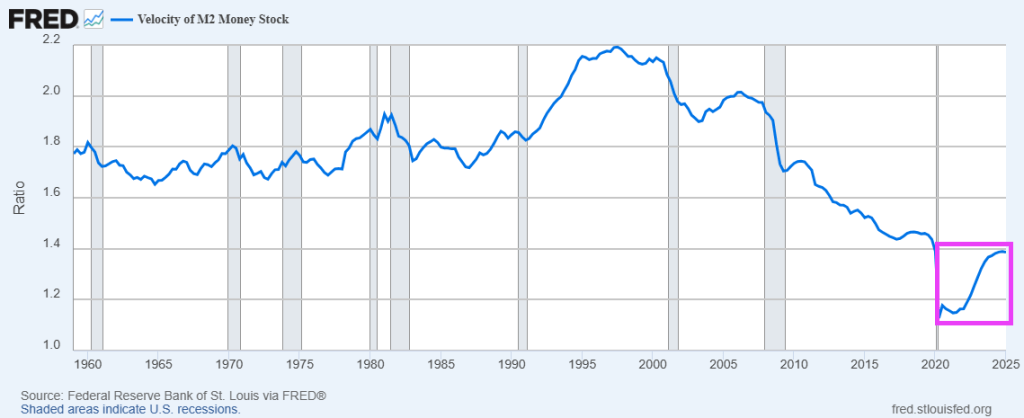
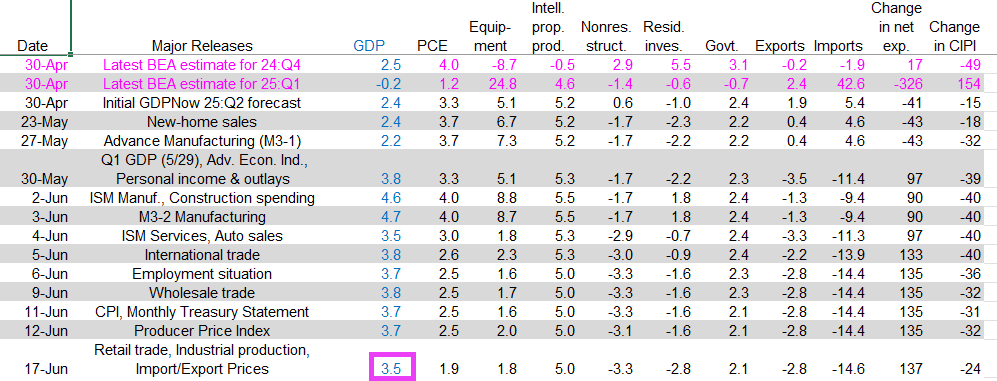
M2 money velocity (GDP/M2) is now at 1.392.
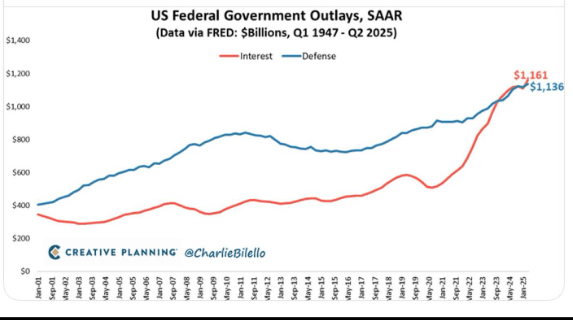
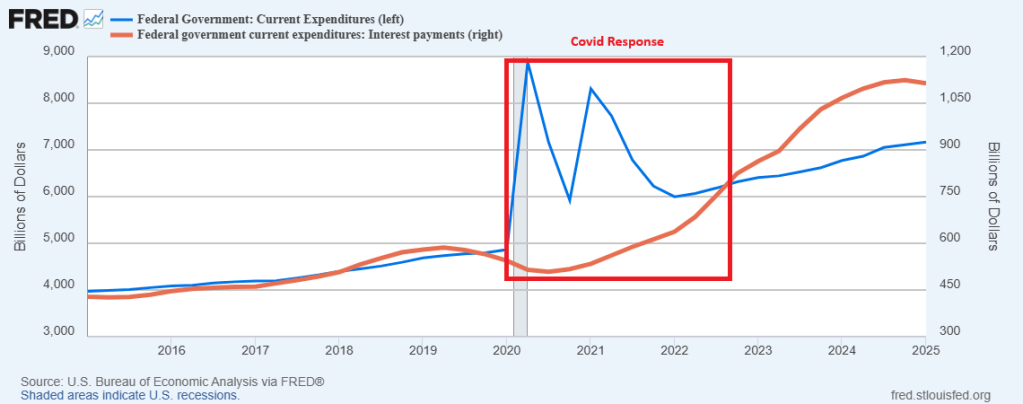
As of Q2, interest payments on the national debt exceeds spending on defense.
Despite being shut down by Democrats and Chucky Schumer, The Federal government and Federal Reserve continue to borrow and print money like crazy.


You must be logged in to post a comment.