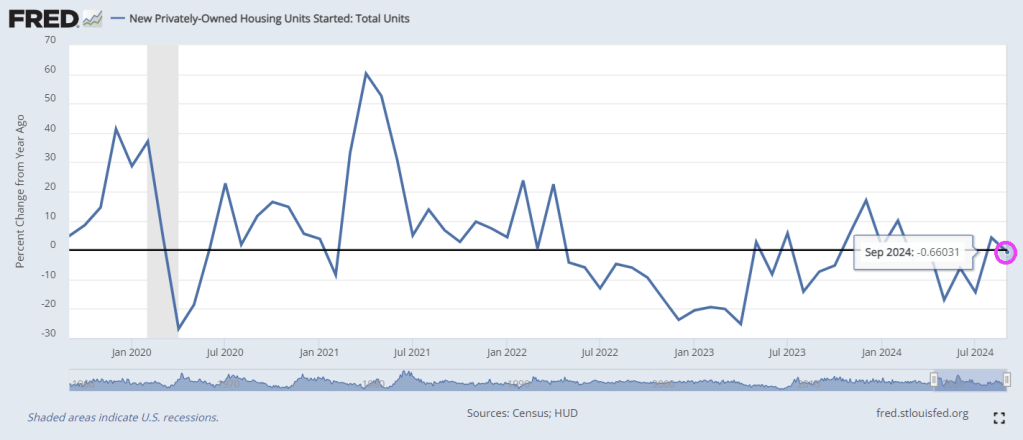
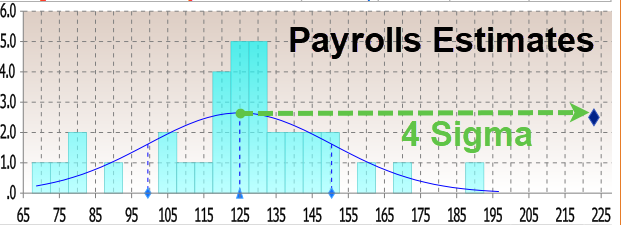
After surprising top the upside in August, Housing Starts and Building Permits disappointed in September, declining more than expected (-0.5% MoM and -2.9% MoM respectively)…
Source: Bloomberg
Under the hood, multi-family permits plunged 10.8% MoM (and multi-family starts dropped for the second straight month). Single-family starts rose 2.7% MoM and permiots inchjed higher by 0.3% MoM…
Source: Bloomberg
Rate-cut expectations appear to have taken the excitement out of the building market…
Source: Bloomberg
Housing Completions also dropped (but the BLS thinks construction jobs continue to rise non-stop)…
Source: Bloomberg
So, The Fed cuts short-term rates… mortgage-rates rise… and builders slow their building plans… that’s not how it’s supposed to work!
I would like to see Kamala Harris explain why mortgage purchase applications are down -60% under Biden/Harris Presidency. Other than a word salad answer. Or Cottage Cheese.
Mortgage applications decreased 17.0 percent from one week earlier, according to data from the Mortgage Bankers Association’s (MBA) Weekly Applications Survey for the week ending October 11, 2024.
The Market Composite Index, a measure of mortgage loan application volume, decreased 17.0 percent on a seasonally adjusted basis from one week earlier. On an unadjusted basis, the Index decreased 17 percent compared with the previous week. The seasonally adjusted Purchase Index decreased 7 percent from one week earlier. The unadjusted Purchase Index decreased 7 percent compared with the previous week and was7 percent higher than the same week one year ago.
The Refinance Index decreased 26 percent from the previous week and was 111 percent higher than the same week one year ago.
Housing prices are up 34.2% under Biden/Harris while mortgage rates are up 138.6%.
Perhaps Harris/Walz should adopt the Imperial March from Star Wars as their theme song. Between Biden/Harris uncontrolled immigration disaster helping to destroy New York City, Harris’ statement that she won’t do anything differntly from Biden/Harris is alarming.
The NY Empire survey crashed from +11.5 to -11.9 – the lowest since May. That is the biggest MoM drop since January…
A measure of current new orders plunged nearly 20 points to -10.2 after climbing a month earlier to the highest since April 2023.
The index of shipments decreased almost 21 points to minus 2.7.
The employment index, however, rebounded to 4.1 – the first expansion in a year – while a measure of hours worked also climbed.
Meanwhile, the New York Fed’s gauge of prices paid for materials increased to a six-month high of 29, while an index of prices received by state manufacturers also accelerated.
And with this awful news, the US Treasury yield curve remains downward/upward sloping. I call this the schizophenic yield curve.
There have been to significant jumps in the Federal Debt. The first coming after the financial crisis of 2008 and election of Obama/Biden in 2008. The second with the outbreak of Covid in 2020 and the election of Biden/Harris in 2021.
The Federal (public) debt was just over $10 million when Obama/Biden were elected and it now stands at a staggering $35.7 trillion. That represents over a tripling of the Federal debt under Obama/Biden/Harris. So when asked what she would do diffeerent than Biden, Harris replied “Nothing comes to mind.” That means MORE spending, MORE debt and MORE unproductive Government jobs.
Here is a chart of public debt and GDP under the triumvirate of Obama, Biden and Harris. No, not Julius Caesar, Pompey, and Crassus). But it is feeling like the Roman Empire prior to its collapse.
Here is a chart of government jobs and government expenditures. Great for government workers, bad for everyone else.
Of course, SOMEBODY has to pay the growing gov’t debt burden. Rest assured it won’t be Obama/Biden/Harris.
It turns out that Powell’s “emergency” 50bps rate cut was – drumroll – another major policy mistake by the Fed. Or it is Presidential election interference by The Biden/Harris Administration giving Cacklin’ Kamala as talking point?
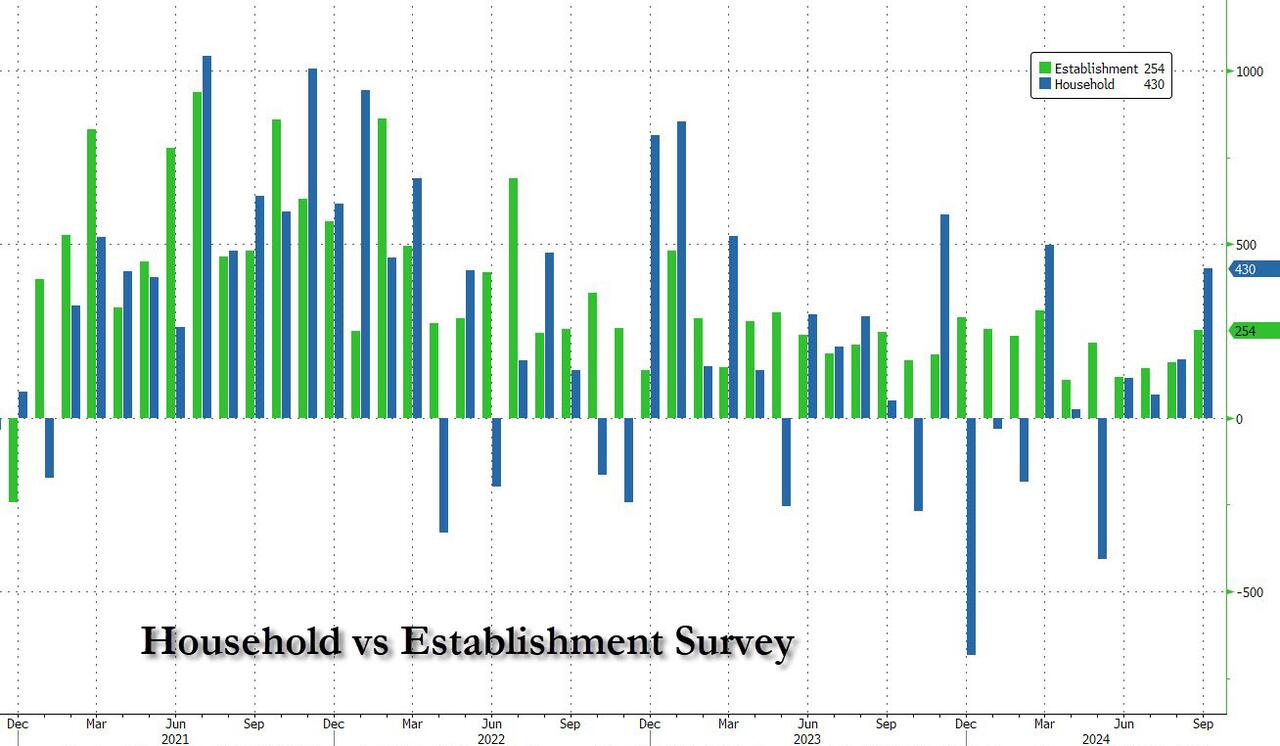
Moments ago, the BLS reported that at a time when prevailing consensus was for jobs to continue their recent downward slide sparked by the near-record annual jobs revision and several months of downbeat jobs reports, in September the US unexpectedly added a whopping 254K jobs, the biggest monthly increase since March…
There’s more: unlike previous months where we saw repeat downward job revisions, the BLS said that both prior months were revised up, to wit: the change in total nonfarm payroll employment for July was revised up by 55,000, from +89,000 to +144,000, and the change for August was revised up by 17,000, from +142,000 to +159,000. With these revisions, employment in July and August combined is 72,000 higher than previously reported.
Some context: as UBS notes, the moving six-month average on nonfarm payrolls is 167k. The estimate is that 150k is about consistent with a return of the economy to trend growth. Which means that inflation is about to come back with a vengeance, just as the Fed launches its easing cycle.
Remarkably, while payrolls jumped by the most in half a year, the number of employed people also surged, rising by a whopping 430K, also the biggest one-month jump since March.
It wasn’t just the payrolls, however, which came in far stronger than estimates: the unemployment rate also came in stronger than expected, and thanks to the jump in employed workers coupled with the decline in unemployed workers (from 7.115MM to 6.834MM), it dropped from 4.2% to 4.1% (and down from 4.3% two months ago which spared the entire recession panic).
Among the major worker groups, the unemployment rate for adult men (3.7 percent) decreased in September. The jobless rates for adult women (3.6 percent), teenagers (14.3 percent), Whites (3.6 percent), Blacks (5.7 percent), Asians (4.1 percent), and Hispanics (5.1 percent) showed little or no change over the month.
And here is the rub, because in a vacuum the super strong jobs numbers would have been fantastic, the only issue is that the September blowout comes as the Fed launches an easing cycle and as wages are once again rising as we have warned for the past 3 months. Indeed, in September, the average hourly earnings rose 0.4% sequentially, beating the estimate of 0.3%, while on an annual basis, wage growth was 4.0%, up from an upward revised 3.9% and beating the 3.8% estimate.
One note here: the average workweek for all employees edged down by 0.1 hour to 34.2 hours in September, which means the hourly earnings increase is not “pure” but rather a function of denominator adjustments. In manufacturing, the average workweek was unchanged at 40.0 hours, and overtime edged down by 0.1 hour to 2.9 hours. The average workweek for production and nonsupervisory employees on private nonfarm payrolls remained at 33.7 hours.
What sector had the biggest growth? UNPRODUCTIVE government workers! A record 785,000 government workers were added in September, pushing total govt workers also to a new record high.
The Biden/Harris Administration has given away billions of dollars to foreign nations (like Ukraine) and illegal immigrants so far this year,
– $24,400,000,000 to Ukraine.
– $11,300,000,000 to Israel.
– $1,950,000,000 to Ethiopia.
– $1,600,000,000 to Jordan.
– $1,400,000,000 to Egypt.
– $1,100,000,000 to Afghanistan.
– $1,100,000,000 to Somalia.
– $1,000,000,000 to Yemen.
– $987,000,000 to Congo.
– $896,000,000 to Syria.
– $9,000 per illegal immigrant that has entered the U.S.
And claim that FEMA has no money left for Hurricane Helene victims who have received only $750 per person. So I have plenty of reasons to have no trust or confidence in the Biden/Harris Mal-administration.
The University of Michigan consumer survery is out and the results are startling.
Under Biden/Harris, buying conditions are far worse than under Trump/Pence.
In fact, buying conditions were extremely favorable (above 100) under Trump and dismal under Harris. Particularly for housing (where higher than normal mortgage rates and high housing prices made the “American Dream” the American Scream.
But Biden/Harris had help from their deep state partner, The Federal Reserve.
The purchasung power of the US dollar has fallen by a whopping -20% under Biden/Harris. No wonder Harris is afraid to talk to reporters about her plans.
The children in Congress went on a spending spree as a result of COVID resulting in record inflation.
The deep state’s financing arm, The Federal Reserve, certainly helped create inflation by ramping up M2 Money supply around Covid.
Of course, children in Congress and Harris/Walz will use ANY excuse to tax and spend (and borrow/spend). The most recent inflation report had CPI growng at 2.5% YoY resulting in a further decline of purchasing power of the US dollar of -2.5% YoY.
Harris/Walz fully intend to keep shoveling TRILLIONS into green energy transformation and supporting illegal immigrants.
If this isn’t election interference, I don’t know what is.
The Fed today slashed interest rates by the biggest amount in 16 YEARS, a whopping 50 basis points from 5.50% to 5.00%. With the economy roaring along (thanks to Covid-related massive Federal spending), there was no good reason to slash rates. Other than to get Kamala (Hyena) Harris across the finish line.
The Fed’s bloated balance sheet remains bloast at 7.115 TRILLION.
Options imply a +/-1.1% move in S&P 500 for the 18-Sept FOMC meeting; this compares to an average of +/-1.2% move priced into SPX ahead of FOMC meetings since the beginning of 2022.
Arguably, this is an unusually important FOMC meeting due to the expected start of a cutting cycle.
On average, the S&P 500 has moved +/-1.3% during FOMC events since the beginning of 2022, coming above options implied moves.
In the July FOMC meeting the index moved +/-1.6% vs. an options implied expectations for a +/-1.1% move.
Goldman’s economists expect the September FOMC meeting to be the start of the Fed easing cycle with a 25bp rate cut followed by two consecutive 25bp rate cuts in November and December, and an eventual terminal rate of 3.25-3.5%.
They see differing asset performances around the start of the easing cycle depending on what motivated the Fed cuts.
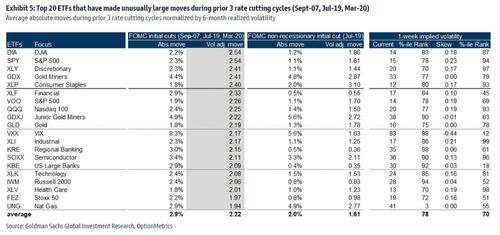
Goldman analyzed moves across stocks and ETFs during the first Fed rate cut in the prior 3 Fed easing cycles (18-Sep-2007, 31-Jul-2019 & 3-Mar-2020).
Rate cuts during the 2007 and 2020 easing cycles were associated with a recession while the 2019 cut was due to a growth scare.
In the tables below are the top 20 names that saw unusual moves during the prior 3 Fed easing cycles and for the 2019 cycle separately.
Financials and Tech were major movers during the beginning of the prior 3 Fed easing cycles while the 2019 cycle also saw unusual moves in Consumer Staples.


You must be logged in to post a comment.