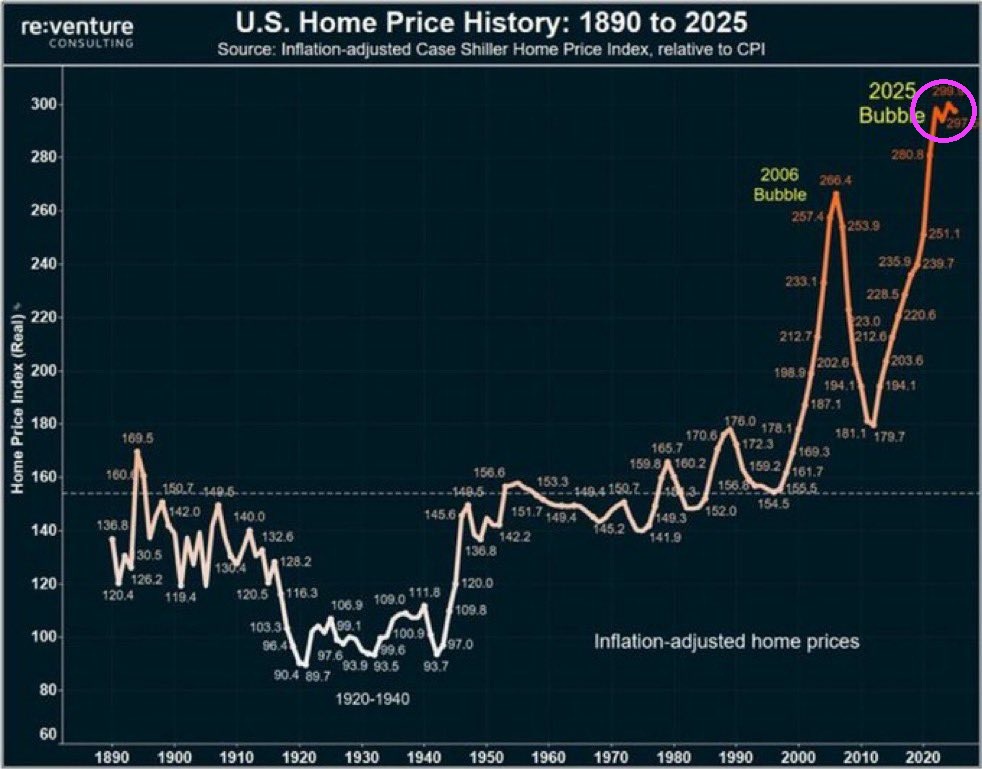
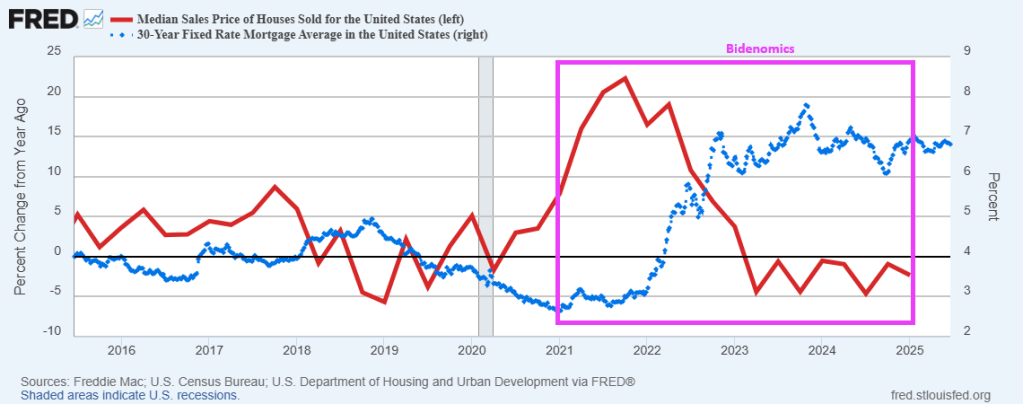
House prices have exploded since Covid, primarily due to massive Federal spending.
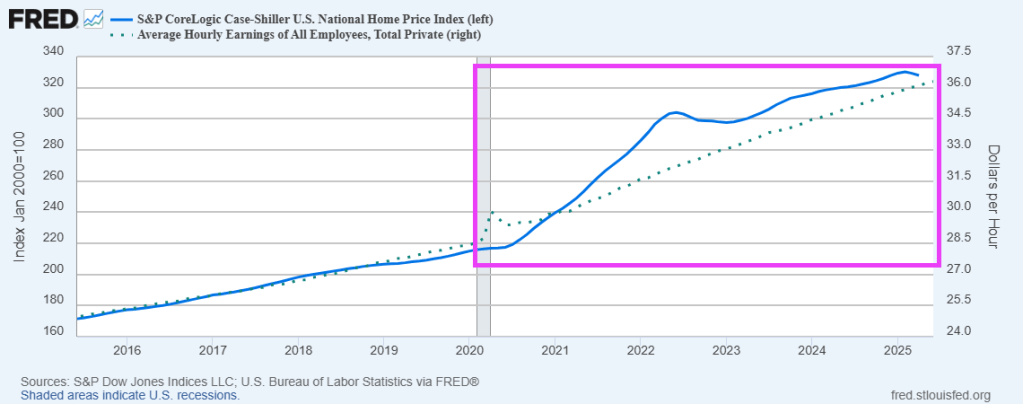
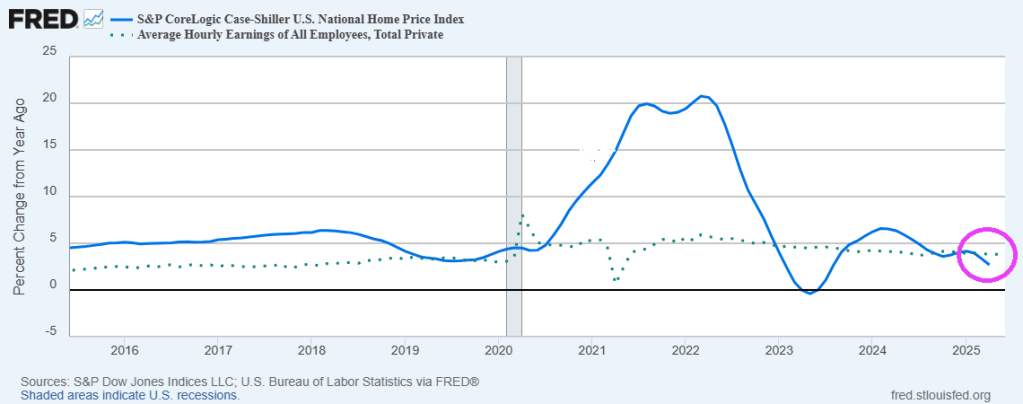
In terms of YoY growth, average hourly earning are exceeding home price growth.
Affordable housing is difficult to achieve at the national level since local politicians control local economies badly. Think LA Mayor Karen Bass who is taking Pacific Palisades which recently burned down and wants to build multifamily housing for low income households. This reminds me of the folly in Long Branch New Jersey where they built low income housing on the beach front. It failed, of course.
US prices rose 0.3% MoM in June according to the Bureau of Labor Statistic (BLS). And on a YoY basis, inflation rose 2.7% while core inflation rose 2.9%.
Supercore inflation was up 3.017% YoY.
As of May, import prices rose a scant 0.0% MoM and 0.2% YoY.
Shelter rose 3.8% YoY in June while gas utilities rose 14.2%.
And on this news, the yield on 30-year Treasuries rose 5%.
Thank goodness “Statist Joe” Biden is gone. Kamala Harris is still lingering around the edges, while the mortgage and housing markets are still suffering from the Biden/Harris regulatory overreach.
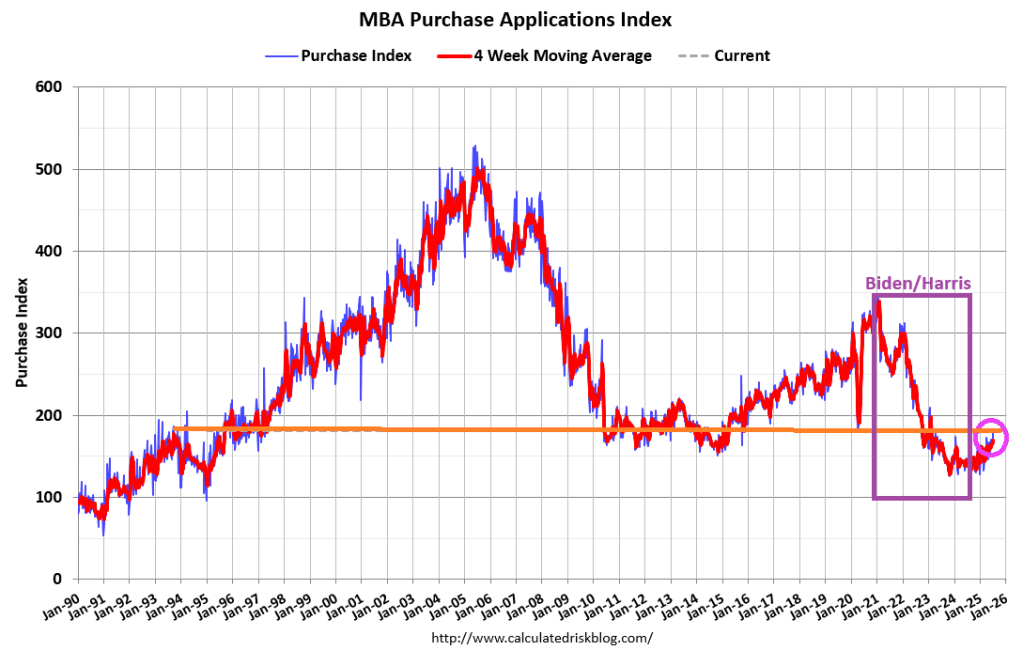
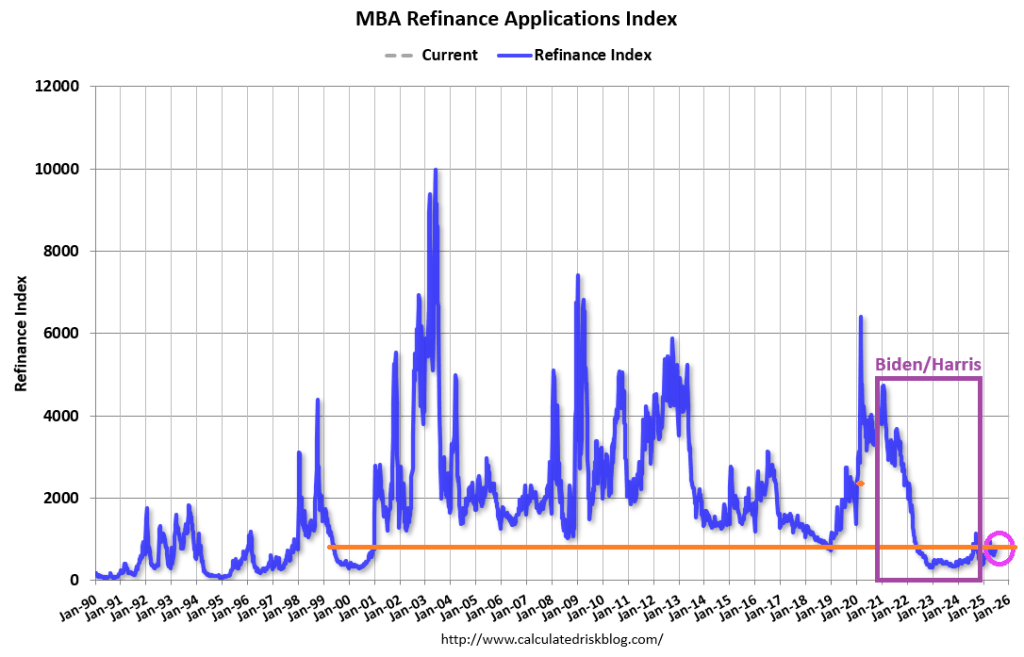
Mortgage applications increased 9.4 percent from one week earlier, according to data from the Mortgage Bankers Association’s (MBA) Weekly Mortgage Applications Survey for the week ending July 4, 2025. Last week’s results included an adjustment for the July 4th holiday.
The Market Composite Index, a measure of mortgage loan application volume, increased 9.4 percent on a seasonally adjusted basis from one week earlier. On an unadjusted basis, the Index decreased 13 percent compared with the previous week. The seasonally adjusted Purchase Index increased 9 percent from one week earlier. The unadjusted Purchase Index decreased 13 percent compared with the previous week and was 25 percent higher than the same week one year ago.
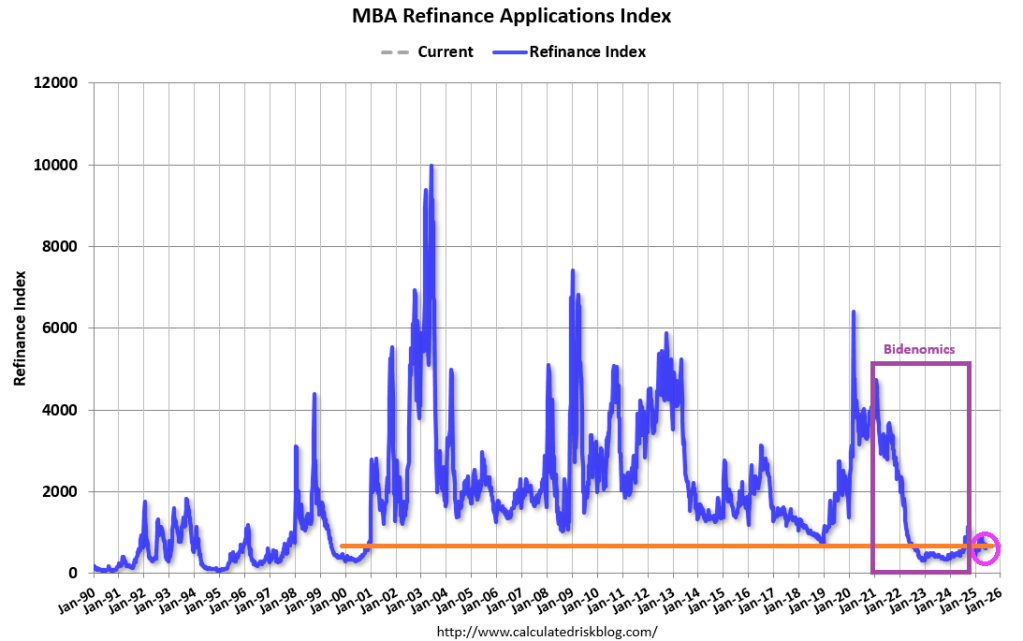
The Refinance Index increased 9 percent from the previous week and was 56 percent higher than the same week one year ago.
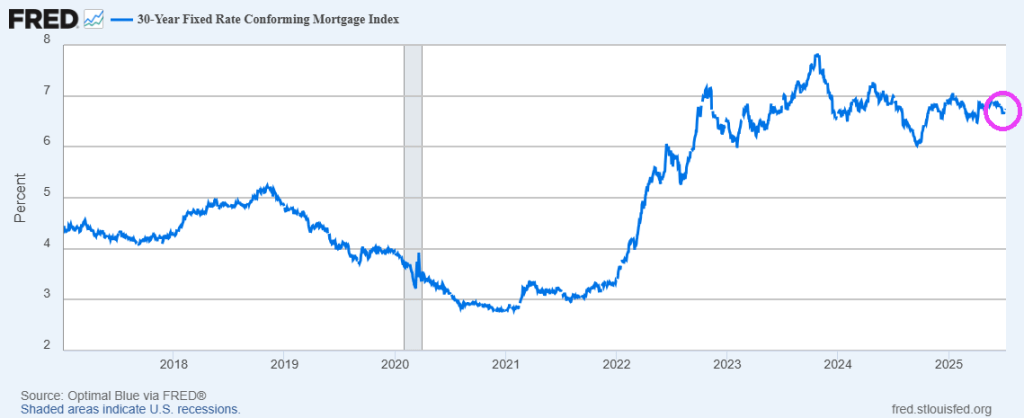
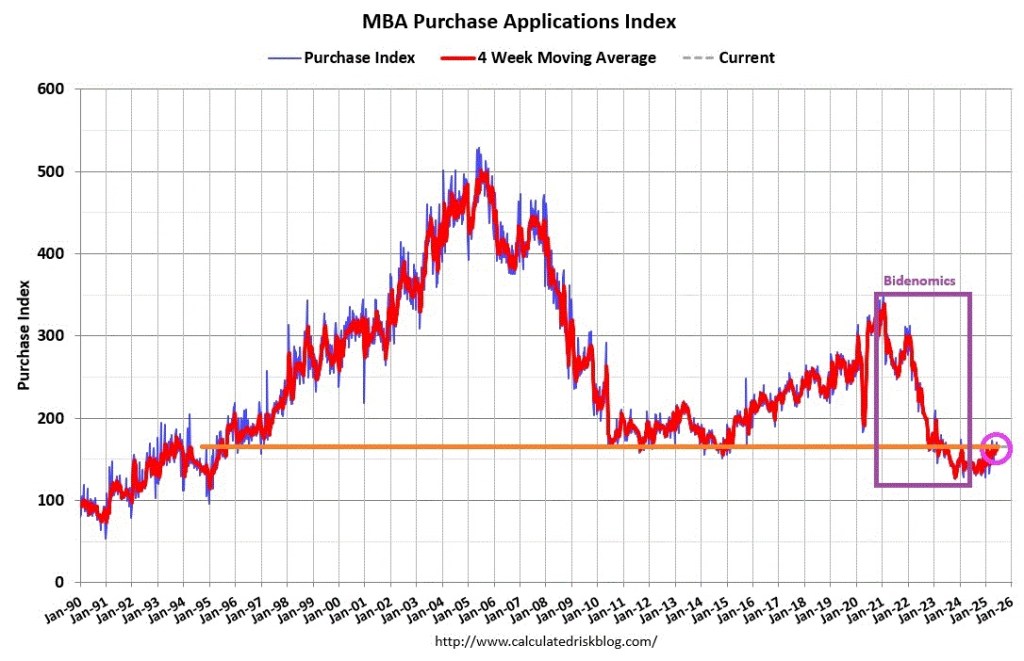
Mortgage rates moved lower last week, with the 30-year fixed rate decreasing to 6.77 percent, its lowest level in three months. After adjusting for the July 4th holiday, purchase applications increased to the highest level of activity since February 2023 and remained above year-ago levels.
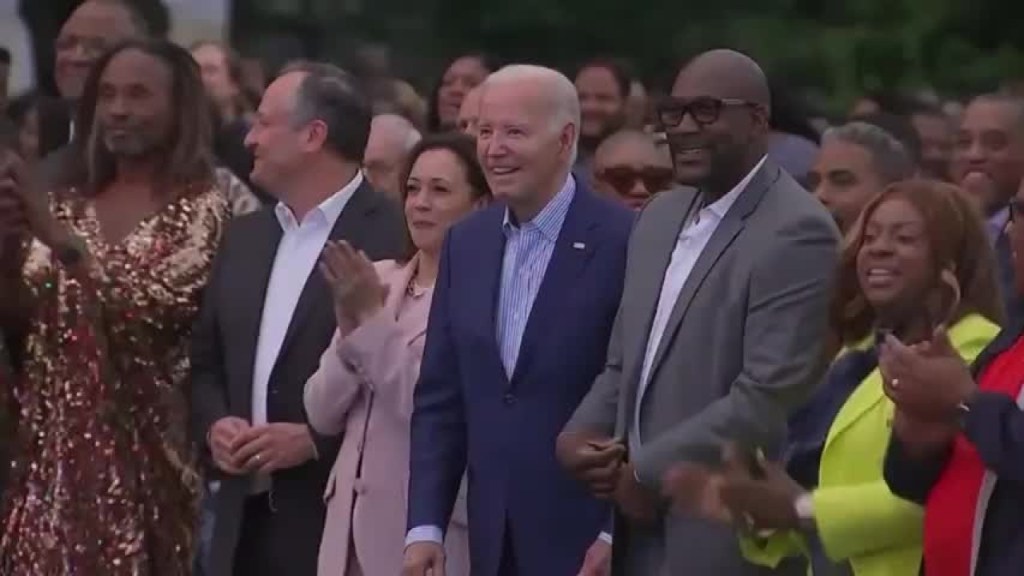
Biden claims the foreign leaders have been calling him for advice. Here is one example.
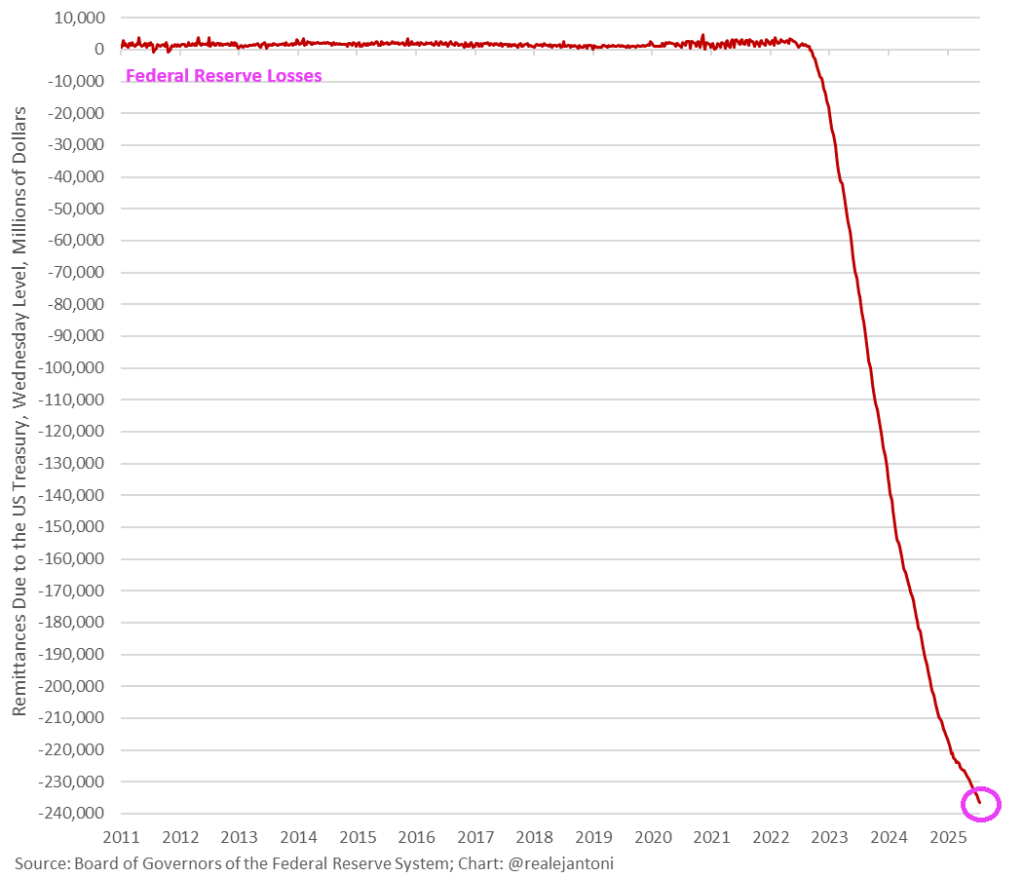
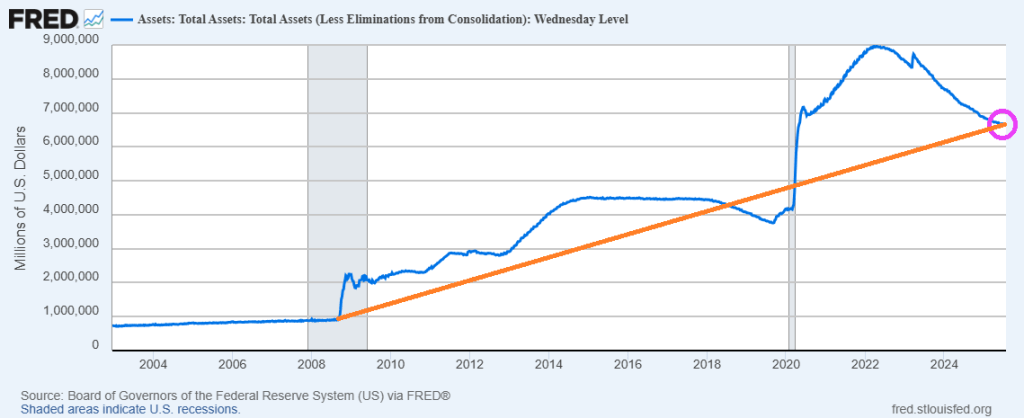
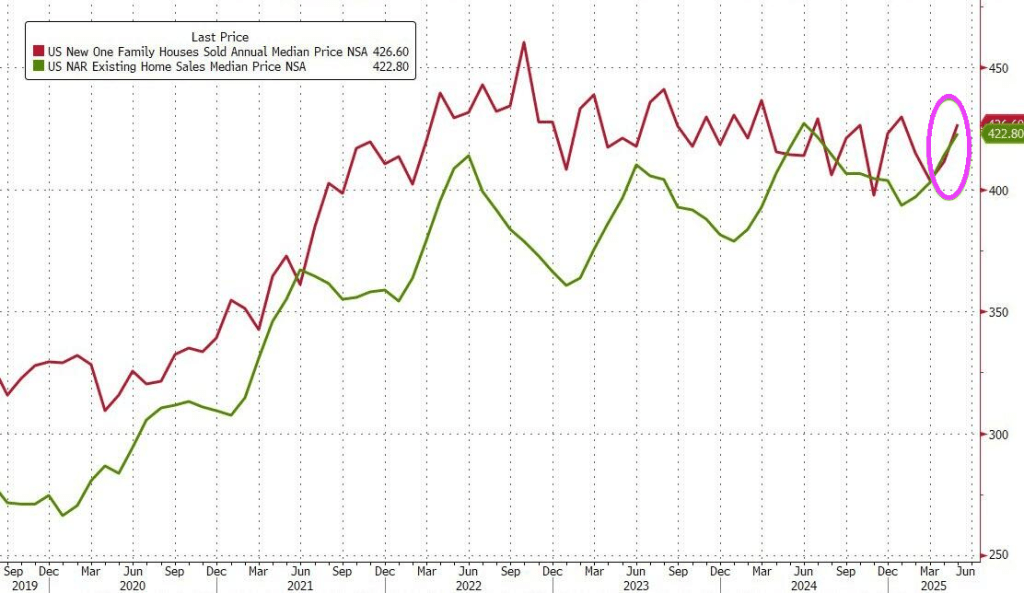
The Fed continues printing money! And home prices continue to rise on year-over-year basis, but falling on a month-over-month basis.
Home prices in April tumbled 0.31% MoM (-0.02% exp) – the biggest MoM drop since Dec 2022.
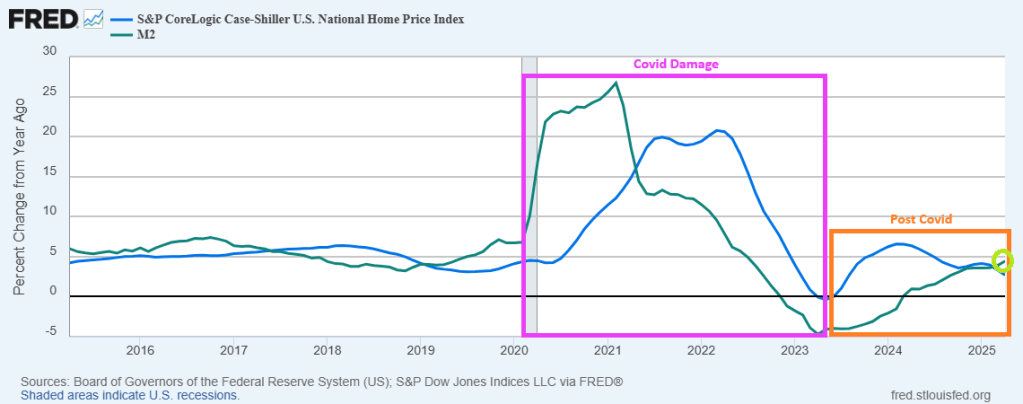
But if we look at the national home prices via S&P Case-Shiller and YoY rather than MoM, home prices ROSE 2.64% YoY.
You can see the damage to homeownership caused by Covid and The Fed. The massive expansion of M2 Money in 2020 was followed shortly by rapid increases in home prices. This was followed by a normalization in Fed M2 Money printing. Consequently, home price growth has slowed.
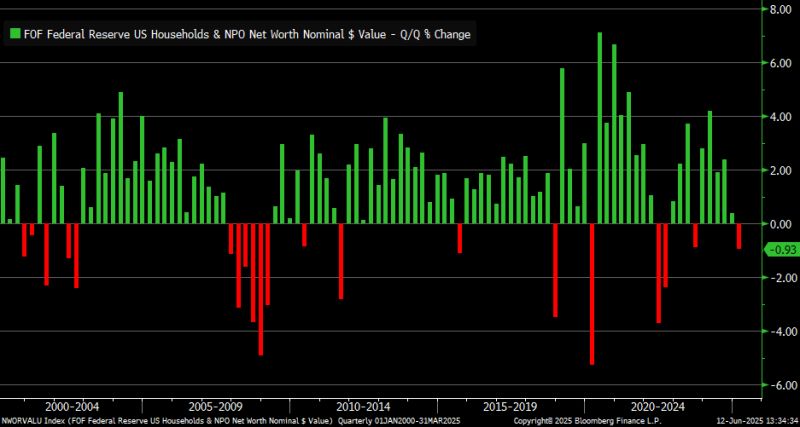
The housing markets is in bits and pieces following The Fed’s fickle management of interest rates and Biden’s disastrous spending policies. U.S. household net worth fell by 0.93% in 1Q2025 … largest decline since 3Q2022, but not necessarily comparable to that quarter in terms of magnitude.
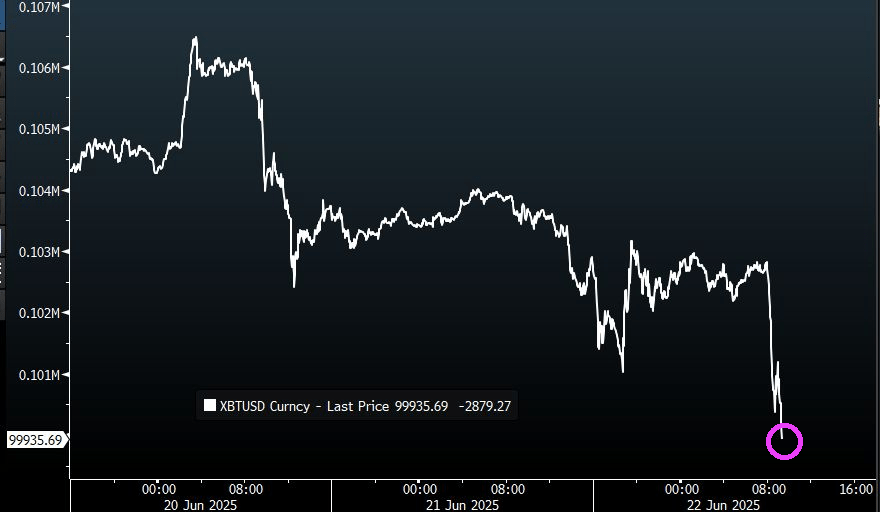
Bitcoin just broke below $100k.
What will The Fed? As I have said over and over again, The Fed needs to cut rates.
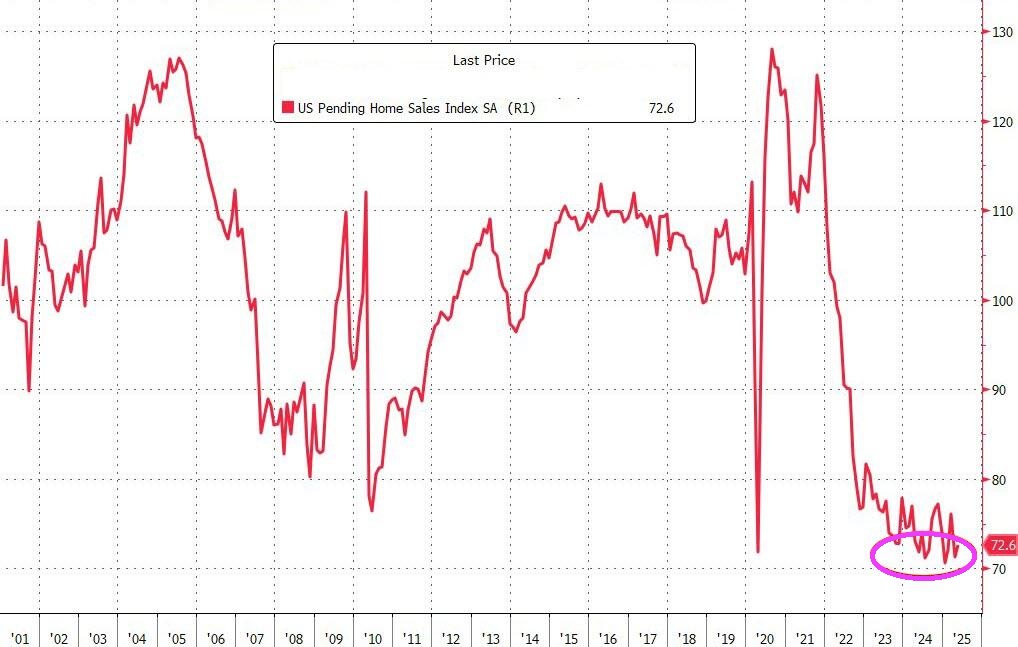
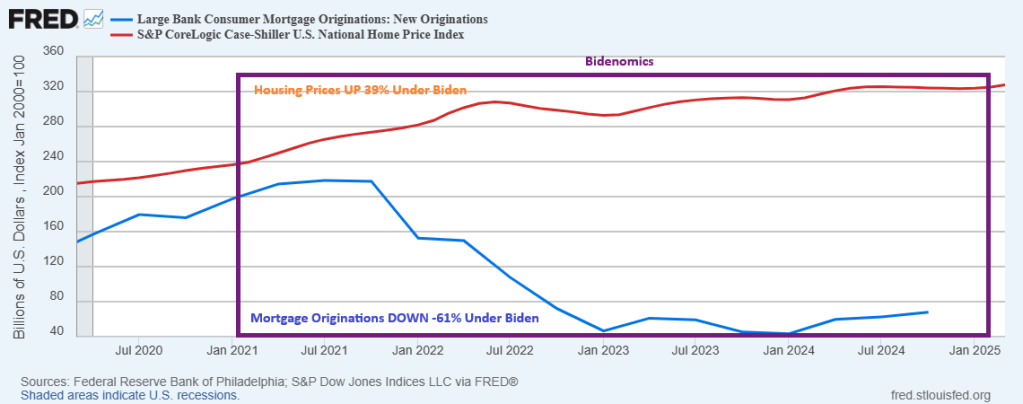
All aboard! The crazy mortgage train! Home prices rose 39% under Biden while mortgage originations at large banks fell -61%. The mortgage market is still recovering from Bidenomics!
Mortgage applications decreased 2.6 percent from one week earlier, according to data from the Mortgage Bankers Association’s (MBA) Weekly Mortgage Applications Survey for the week ending June 13, 2025.
The Market Composite Index, a measure of mortgage loan application volume, decreased 2.6 percent on a seasonally adjusted basis from one week earlier. On an unadjusted basis, the Index decreased 4 percent compared with the previous week. The seasonally adjusted Purchase Index decreased 3 percent from one week earlier. The unadjusted Purchase Index decreased 5 percent compared with the previous week and was 14 percent higher than the same week one year ago.
The Refinance Index decreased 2 percent from the previous week and was 25 percent higher than the same week one year ago.
Home prices rose 39% under Biden while mortgage originations at large banks fell -61%.














You must be logged in to post a comment.