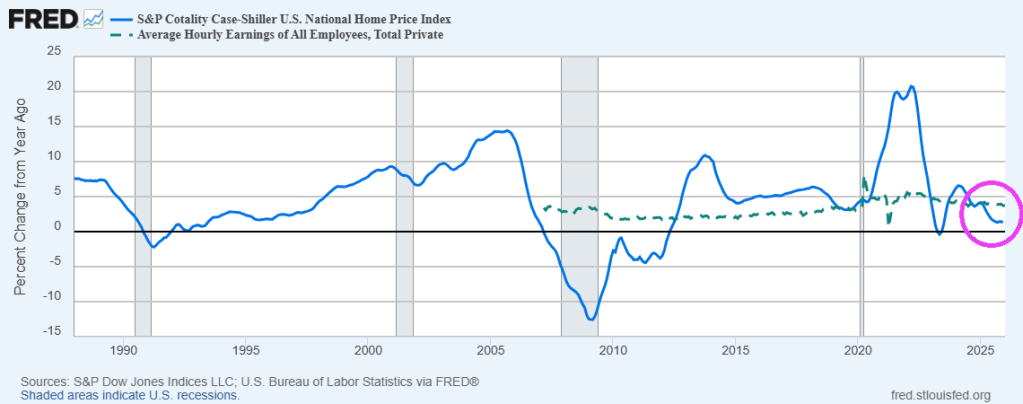
The S&P Cotality Case-Shiller U.S. National Home Price NSA Index posted a 1.3% annual gain (YoY) for December 2025, down from a 1.4% rise in the previous month. Average hourly earnings now at 3.73% YoY, higher than home price growth.
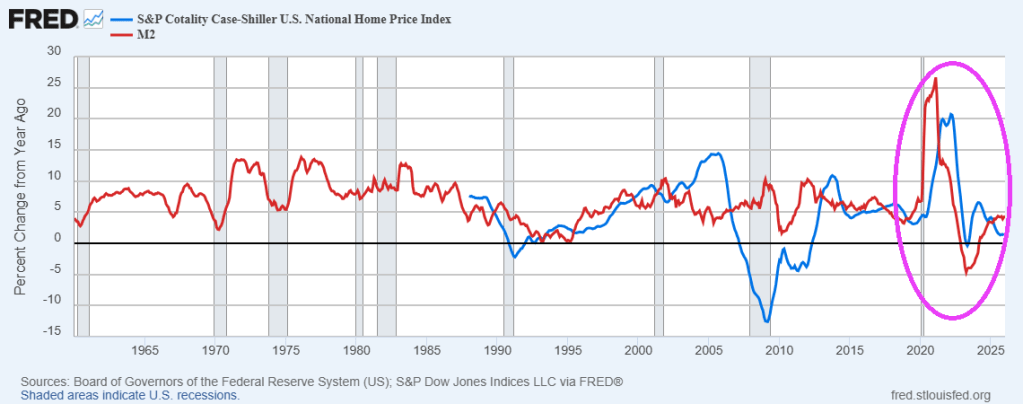
Home price growth exploded following The Federal governments’ Covid-related spending splurge.
Geographic divergence widened sharply: Chicago and New York led all markets with gains above 5%, while Tampa, Phoenix, Dallas, and Miami posted the steepest declines among markets that finished the year in negative territory.
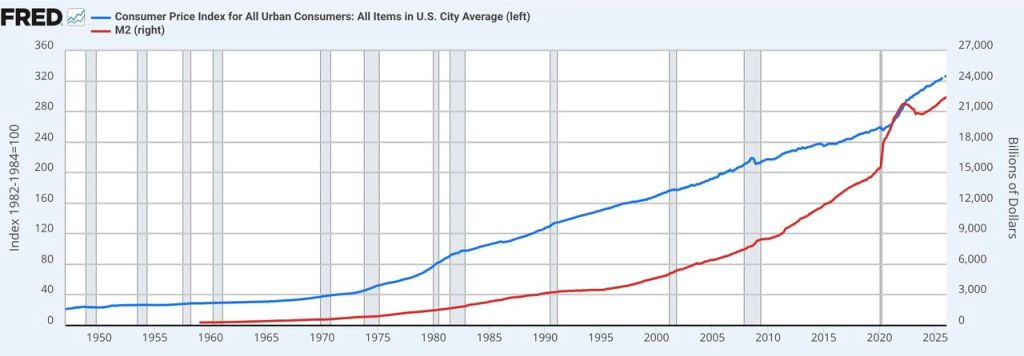
Inflation cooled significantly under Trump, but The Fed keeps printing M2!
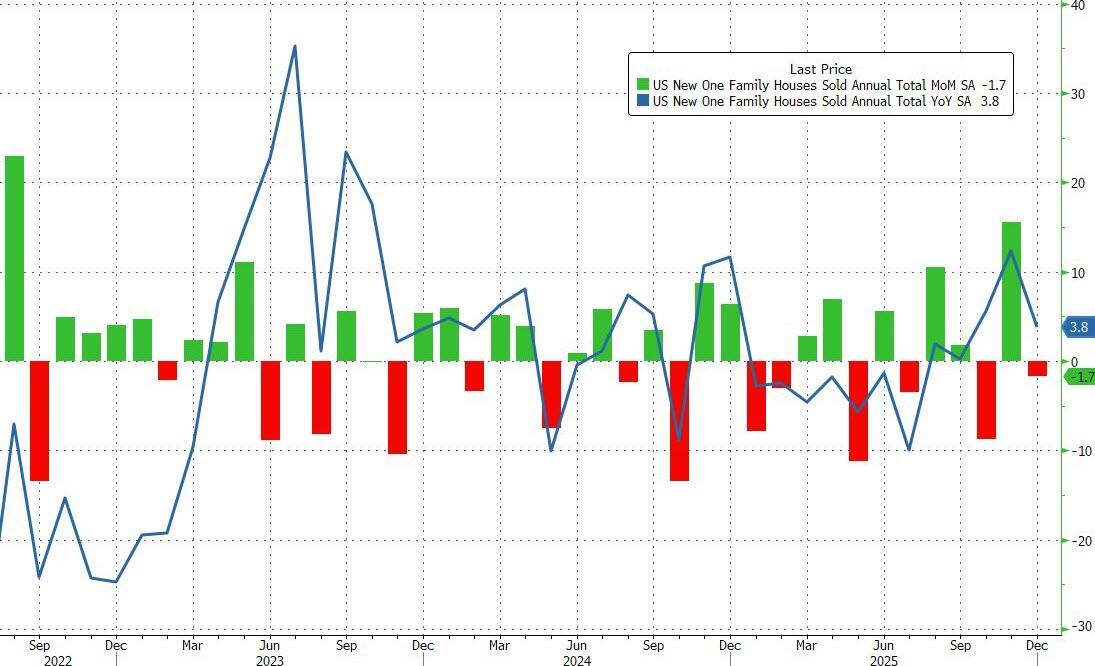
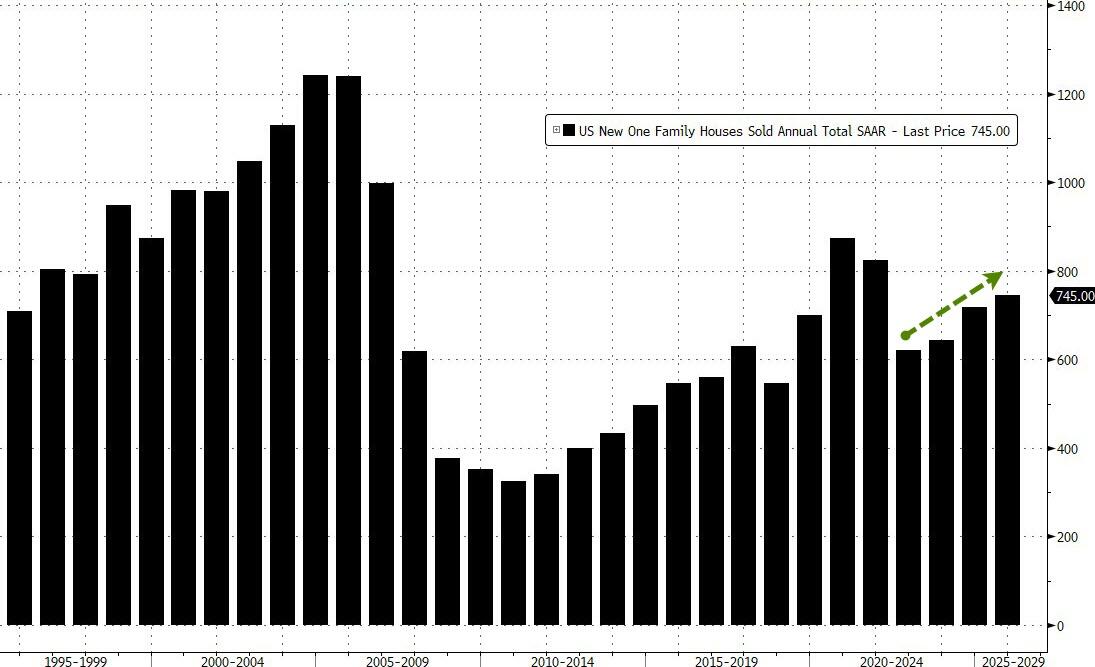
…but ended the year at 745k – the highest SAAR since 2021…
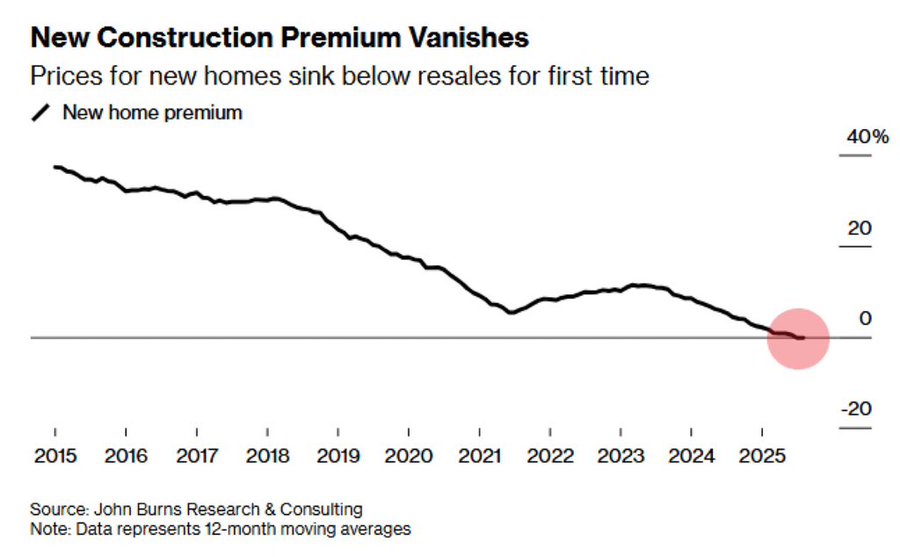
“New” home sales have notably decoupled from “used” home sales in the last few years as homebuilders incentivize buyers (reducing margins) and lower prices (reducing revenues)…
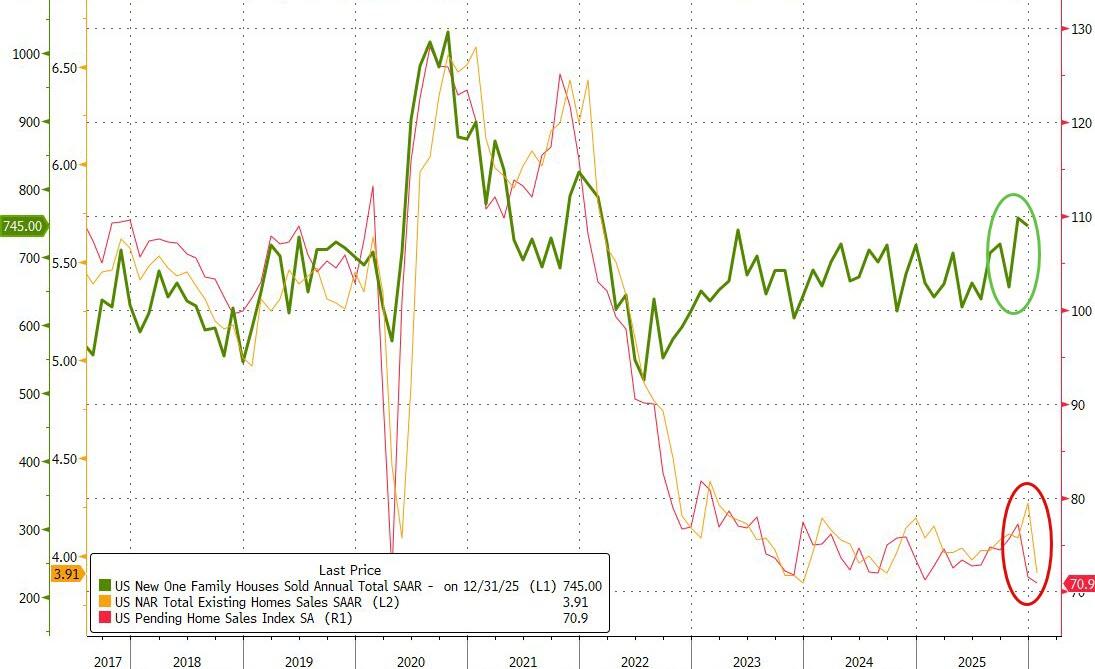
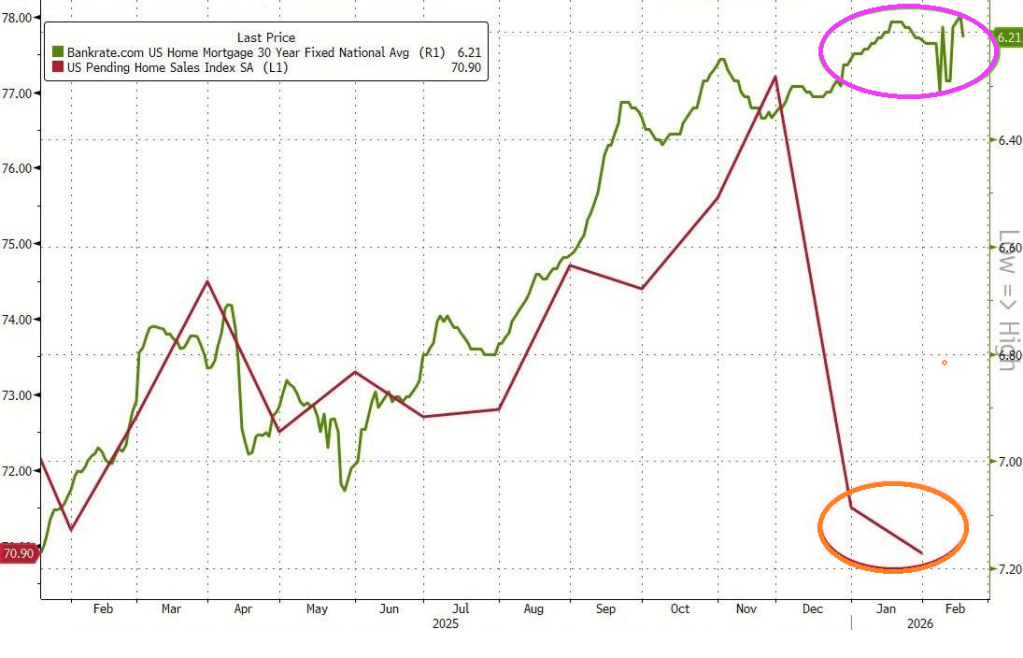
Lower mortgage rates support modest further improvements in sales…
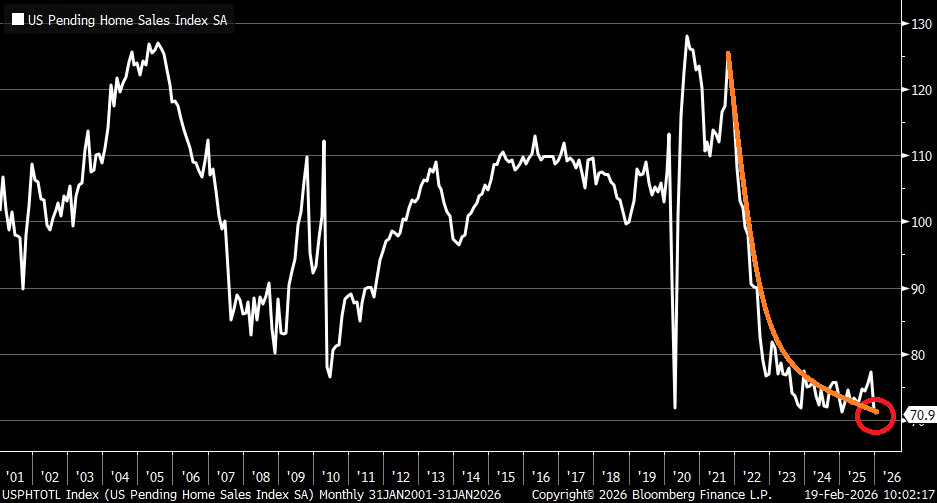
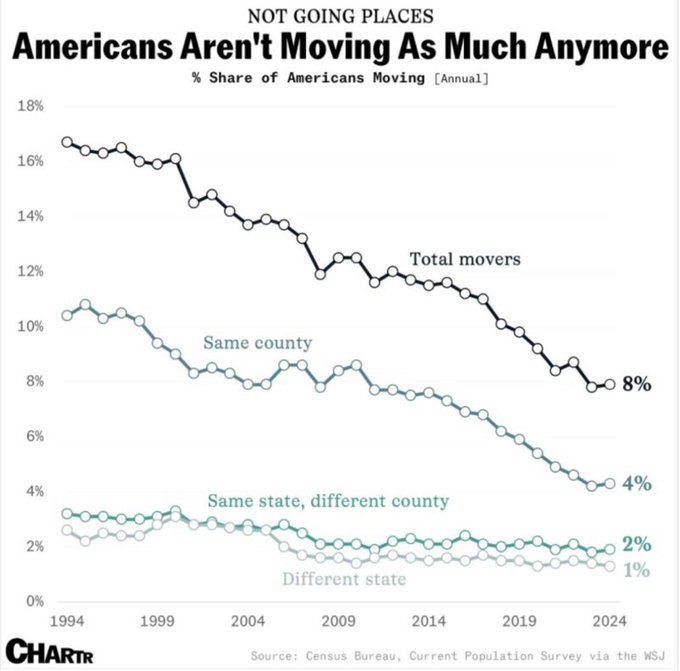
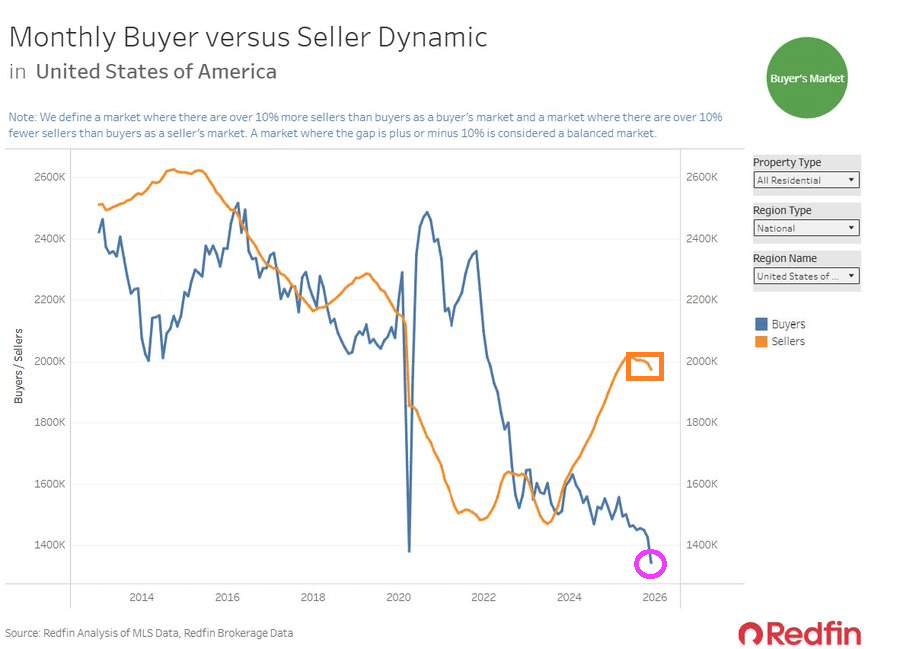
Unfortunately, US pending home sales have collapsed to the lowest level since at least 2001. Nothing has been the same since Biden/Harris administration.
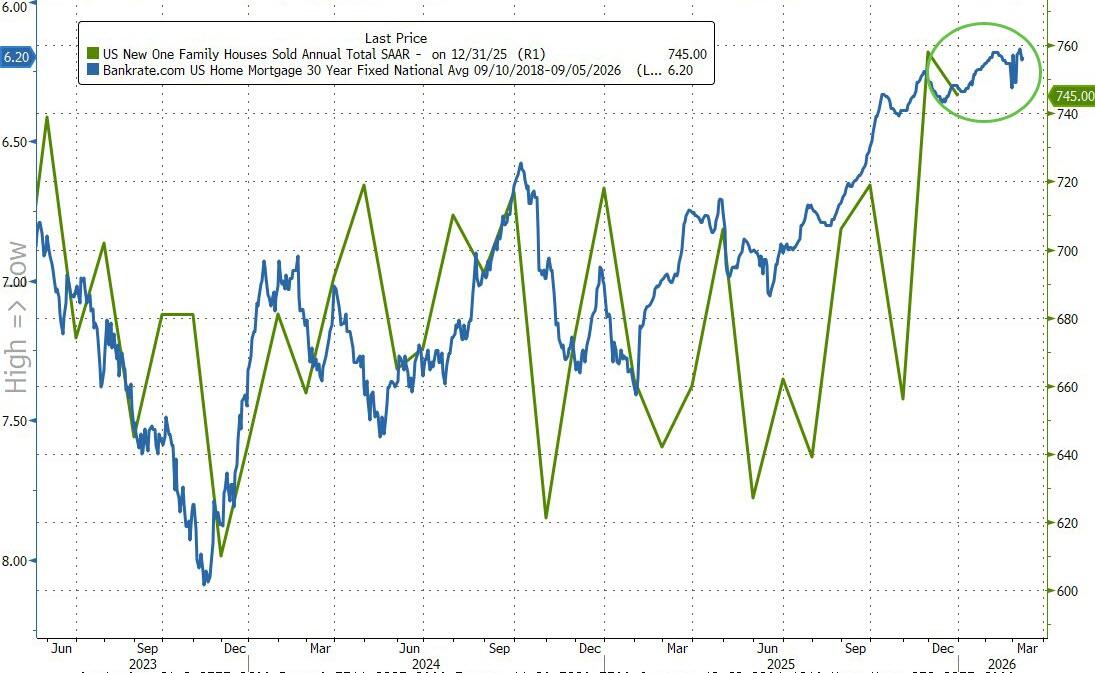
Mortgage rates are still too high by historic standards.
Speaking of Democrats running the economy, New York’s mayor Zoran Mandami (the Ugandan Communist) is seeking to raise property taxes to 9.5% which will hit EVERY New Yorker, not just the billionaires he allegedly wants to tax.
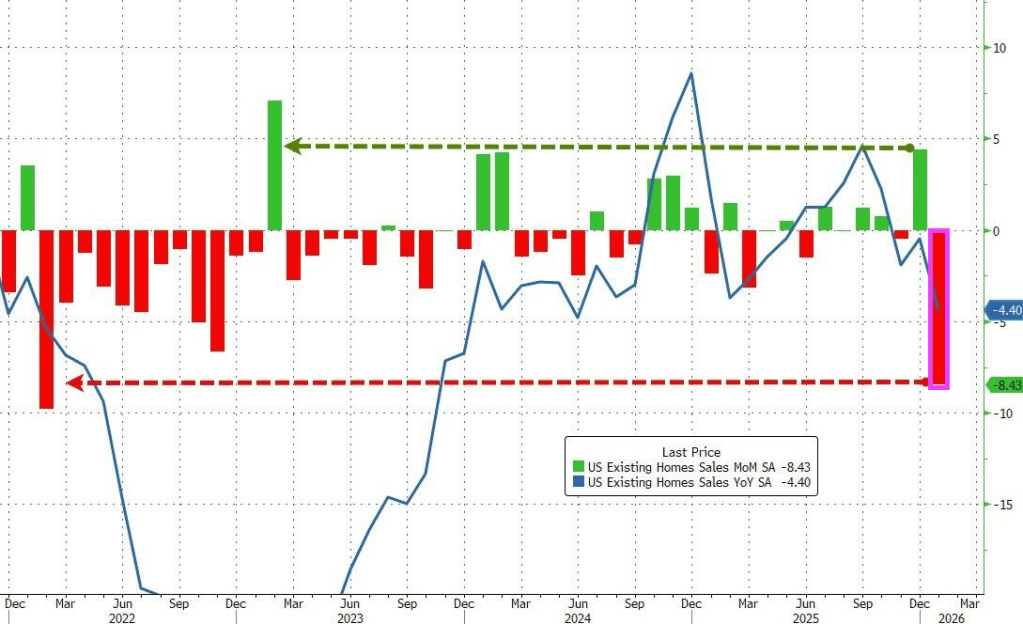
The analysts were correct on the direction but wrong on the scale as existing home sales plunged 8.4% MoM in January from a downwardly revised +4.4% MoM in December. That is the biggest MoM drop since February 2022.
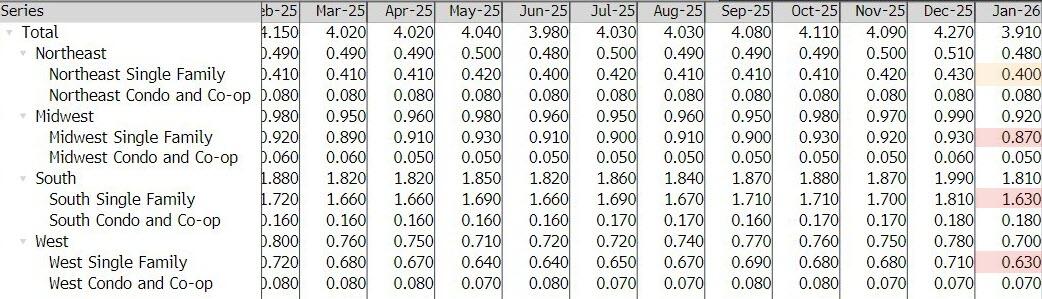
While some suggested this could be impacted by the Winter Storms, this is based on contracts signed in November/December… and the biggest decline was in The West (which had zero weather impact)
Nevertheless, realtors gonna realtor:
“The below-normal temperatures and above-normal precipitation this January make it harder than usual to assess the underlying driver of the decrease and determine if this month’s numbers are an aberration,” NAR Chief Economist Lawrence Yun said in a statement.
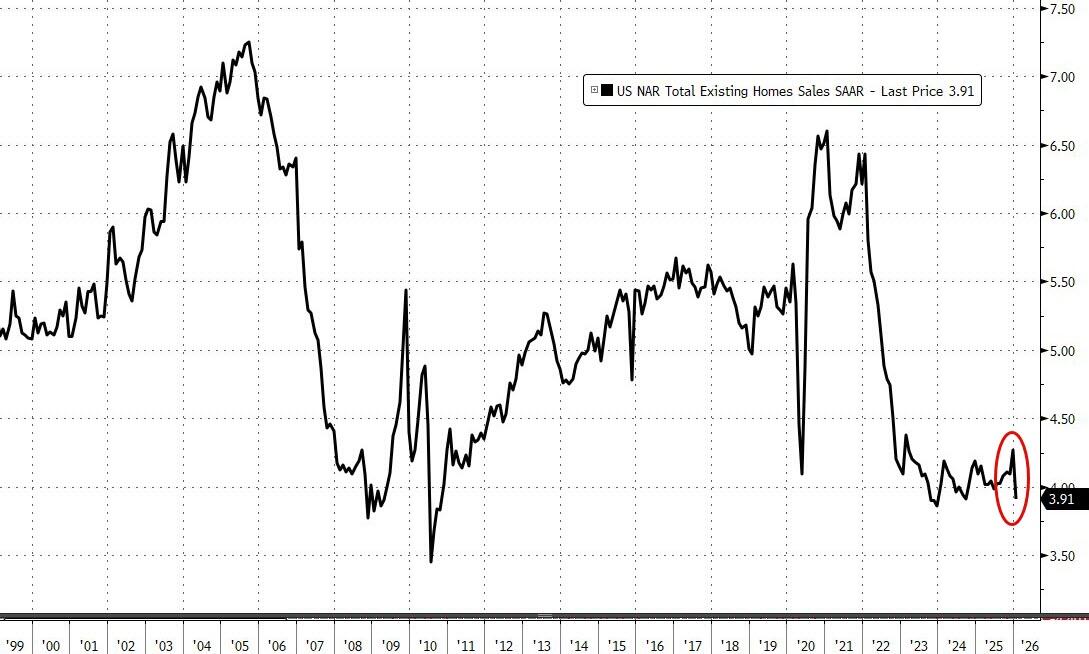
That MoM plunge pulled the total SAAR down near 15 year lows…
Without an extended period of improved affordability, the recovery in the housing market is likely to be prolonged.
The NAR report showed the median selling price rose 0.9% from a year earlier to $396,800 last month.
First-time buyers represented 31% of buyers of existing homes in January, up slightly from 29% in the prior month and higher than a year ago.
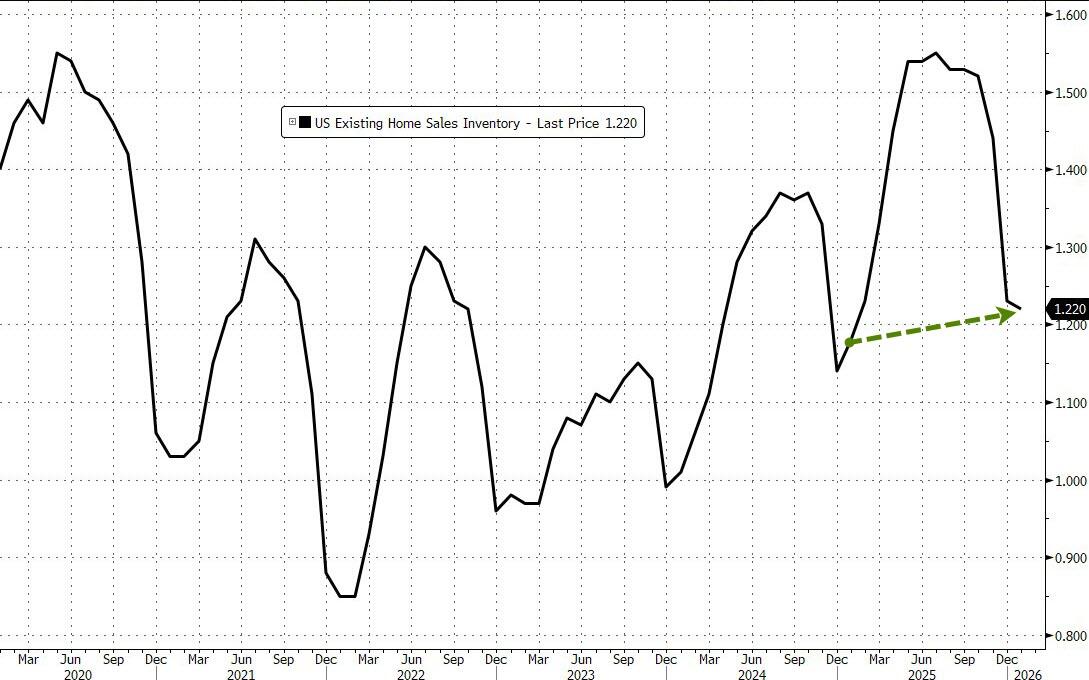
The inventory of previously owned homes increased 3.4% in January from a year ago to 1.22 million.
A pickup in supply through 2025 has helped to tame price growth, though Yun said on a call with reporters that listings need to increase much more to help improve sales.
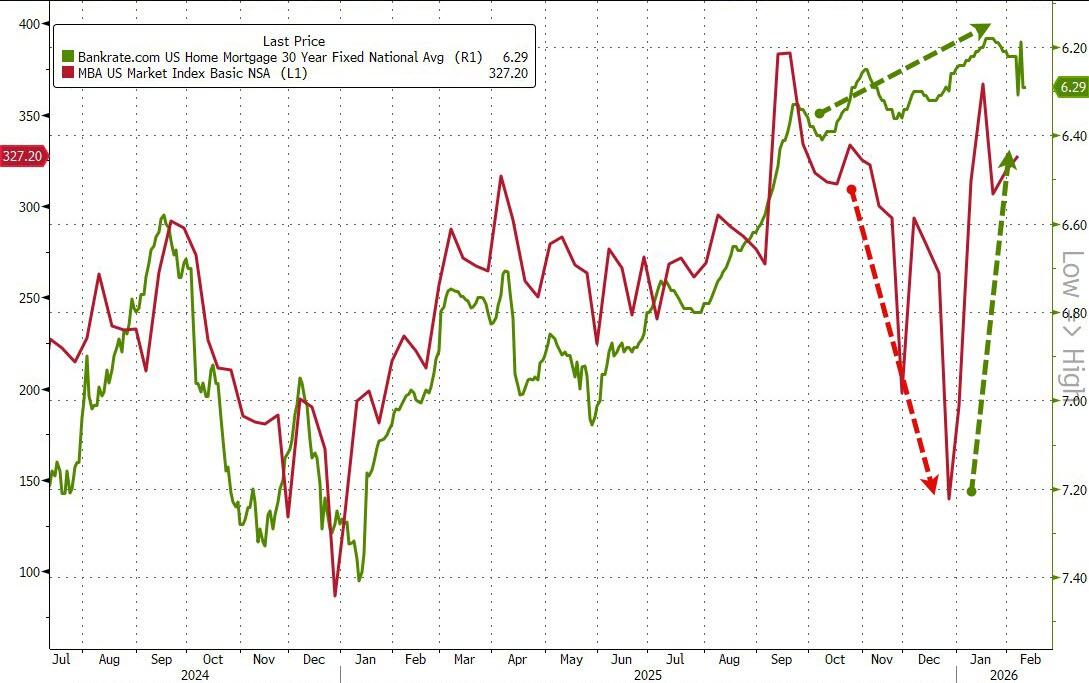
On the bright side, it appears mortgage applications are rebounding as the year started with lower rates…
Source: Bloomberg
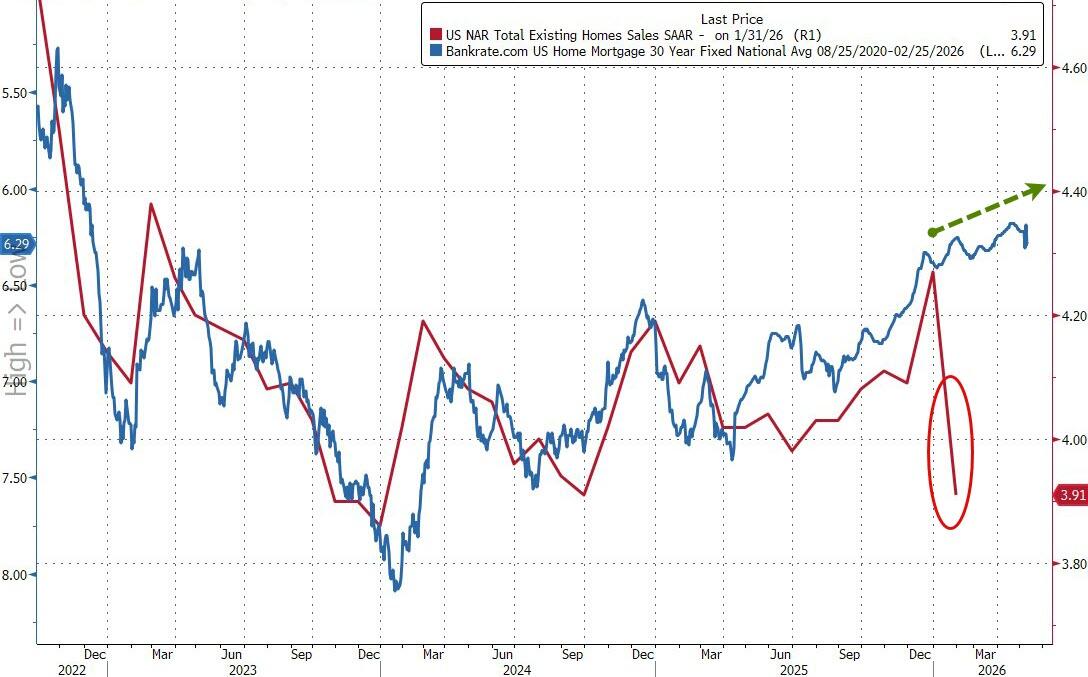
Arguably, existing home sales have much further to go to the upside as the lagged mortgage rate has continued to decline… so what triggered this collapse?
Source: Bloomberg
Finally, circling back to where we started, NAR expects home sales to rise a stunning 14% this year, higher than most other forecasts but a figure that NAR Chief Economist Lawrence Yun said he feels “confident” in. That assumes more inventory will come on the market, mortgage rates will hover around 6% and the Fed will cut interest rates another two times, compared to policymakers’ median projection for one.
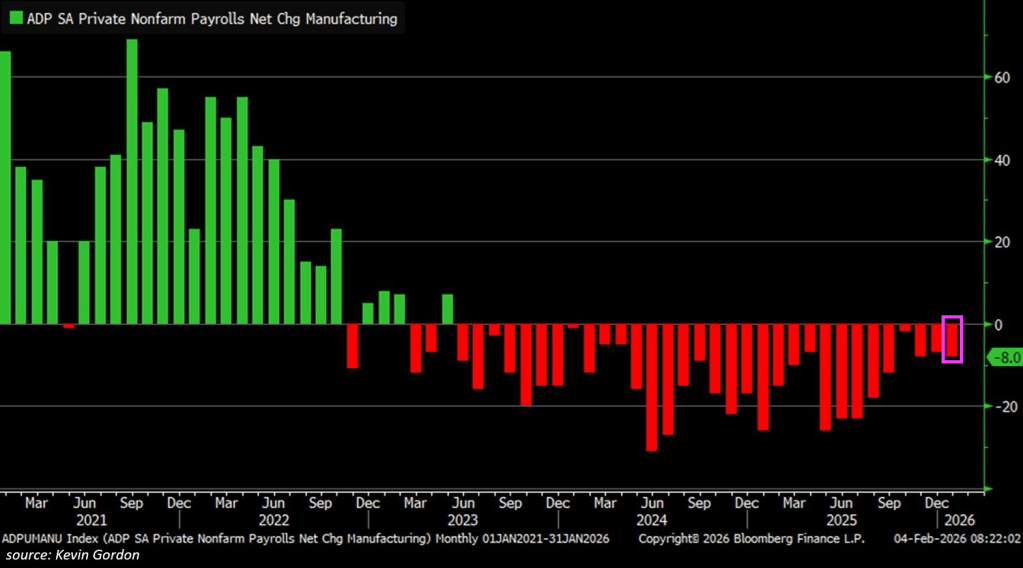
The manufacturing sector shed -8,000 jobs in January, according to the ADP private employment report.
This marks the 32nd consecutive monthly decline, the longest streak since data began in 2010.
In 2024 and 2025, manufacturing employment fell -154,000 and -177,000, respectively.
Since the 2022 peak, -403,000 jobs have been lost, bringing total manufacturing employment down to 12.483 million, the lowest since November 2021.
The sector has now lost HALF the number of jobs wiped out during the 2020 pandemic.
The US manufacturing sector is in recession.
It is difficult to undo the damage to the economy done by Biden and Chuck Schumer with their insane spending and open borders. Like pushing up housing prices to obscene levels under Clueless Joe.
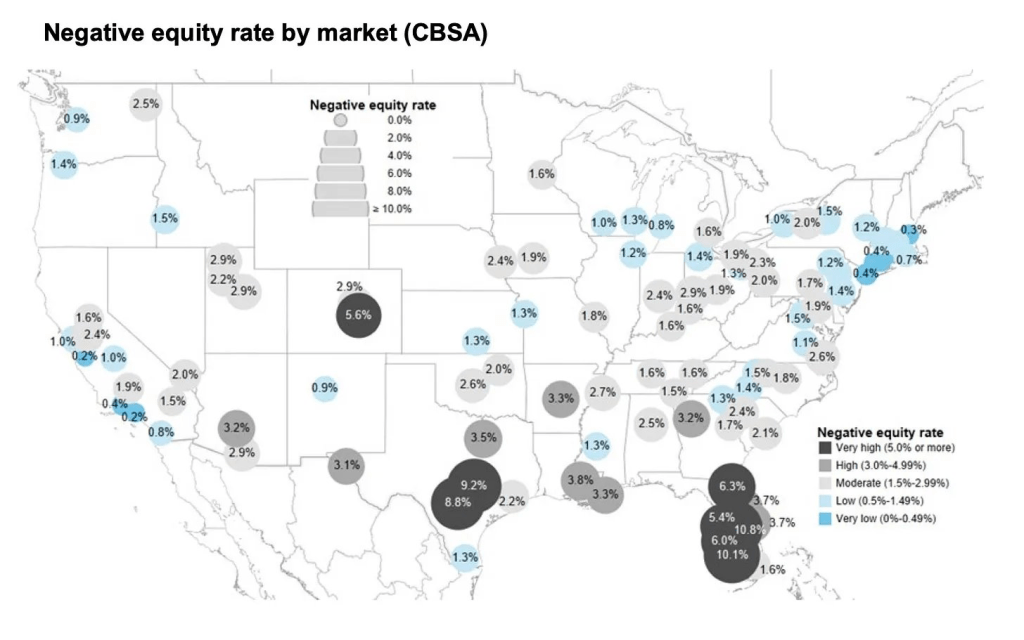
US Manufacturing Sector Shed -8k Jobs on January (Difficult To Undo Damage Done By Biden and Schumer Including Negative Home Equity).
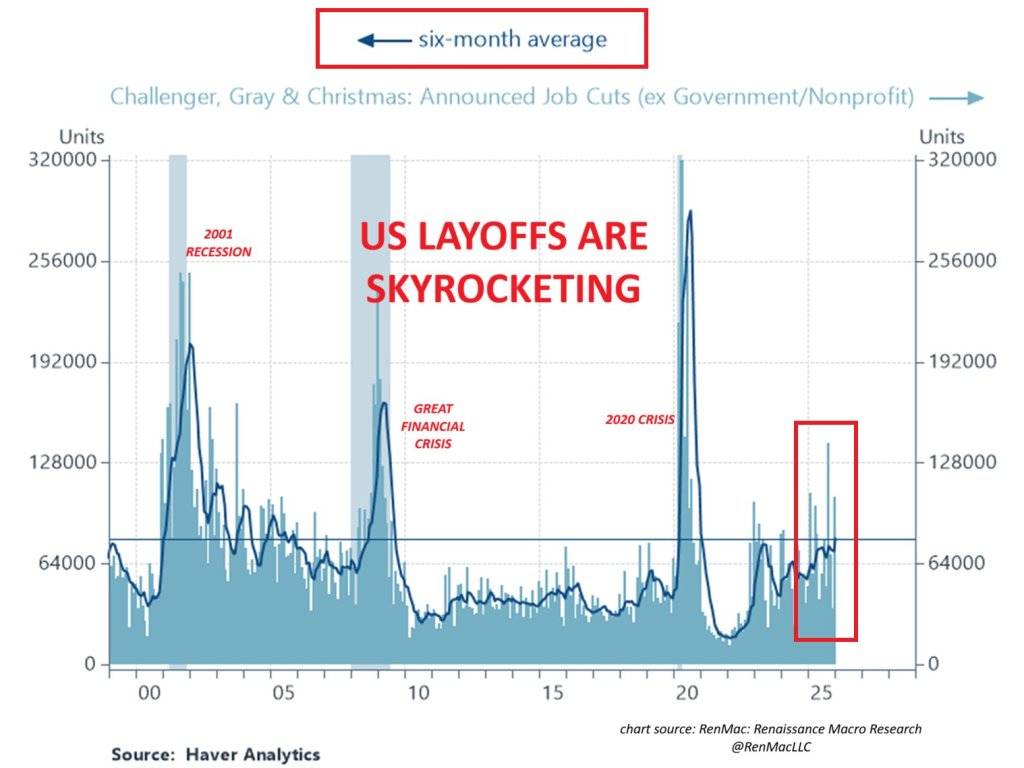
US layoffs are skyrocketing, largely due to the cost of providing Obamacare to employees. Easier to replace full-time workers with part-time and no healthcare benefits.
Sorry Bad Bunny, Your open border fantasies are a nightmare for law and order.
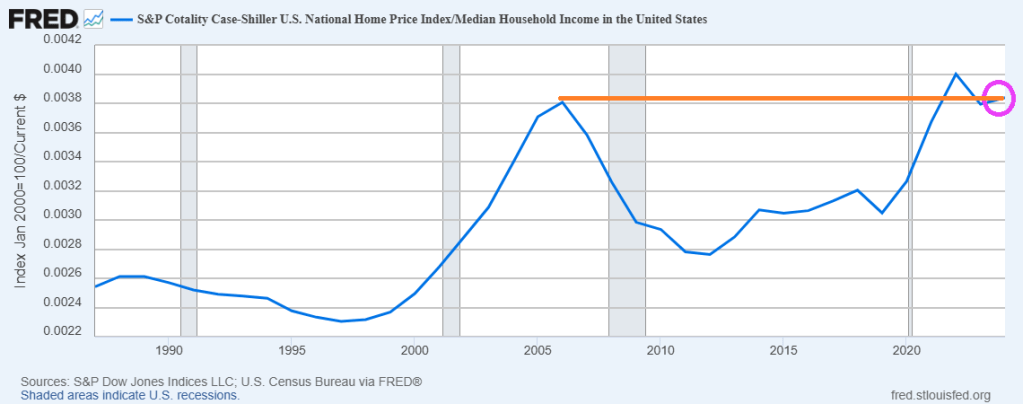
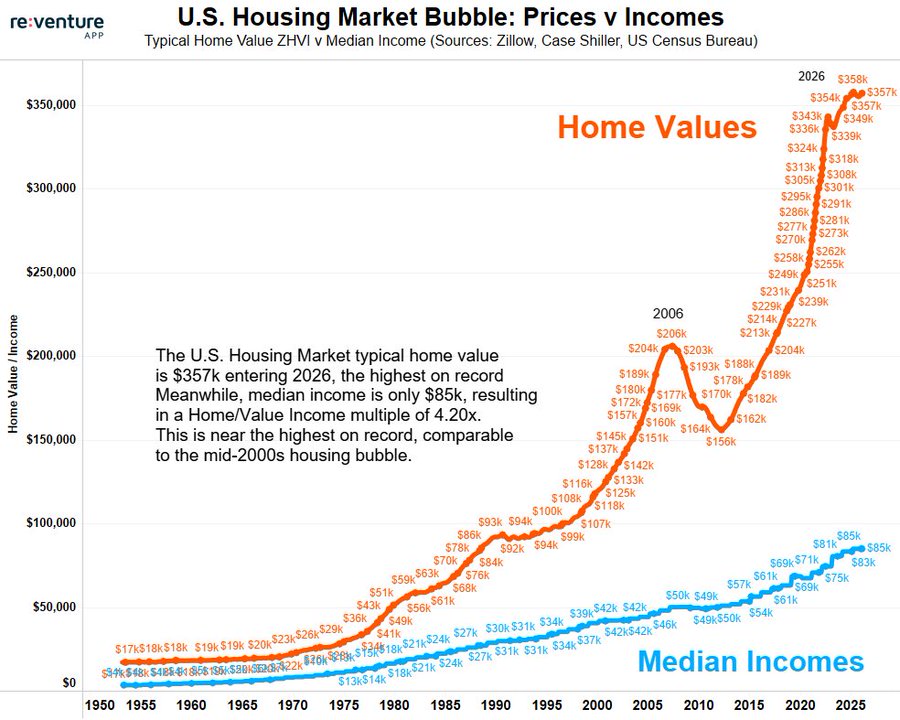
Yikes! The ratio of US Home Prices to US Median Household Income is now higher than the ratio during the catestrophic housing bubble during the latter half of the 2000s.
Here is a chart of home prices and median household incone,
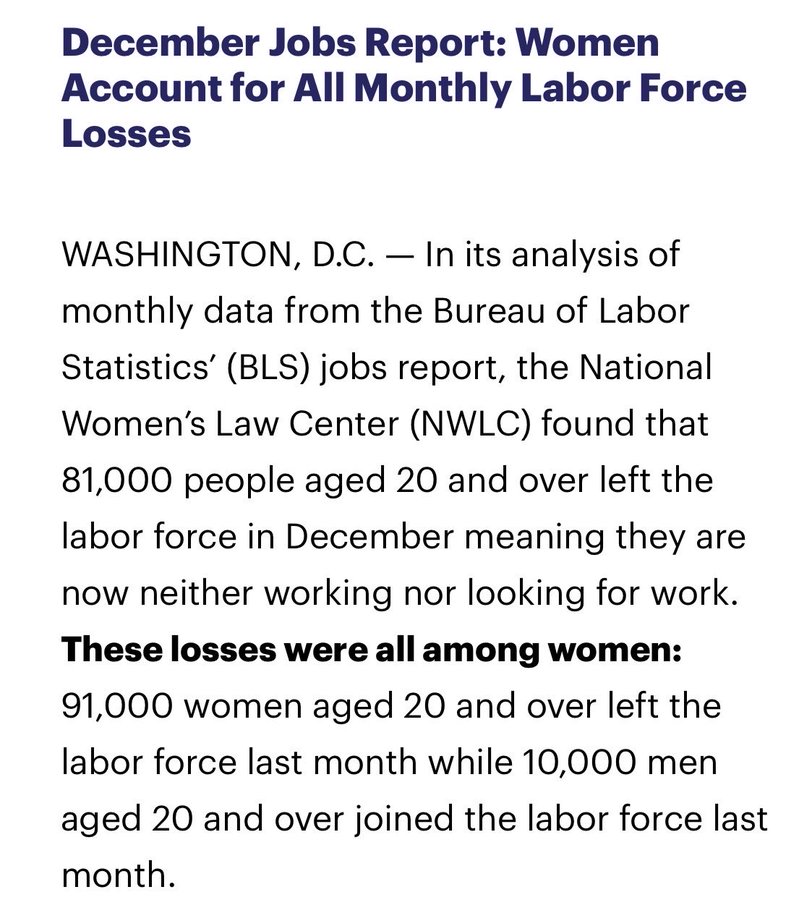
The labor market is truly screwed-up. The December jobs report reveals that women account for nearly all labor force losses.
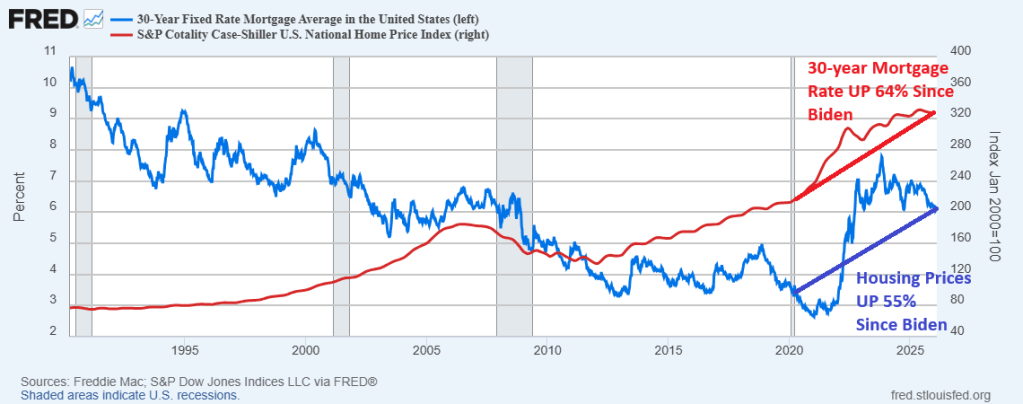
I ain’t drunk! But it would help in this housing market where housing prices and mortgage rates are much higher than when Joe Biden became President in January 2020. In fact, the Case-Shiller national home price index is 55% higher than when Sleepy Joe took the reins of Presidency and the 30-year mortgage rate is 64% higher.
Because of higher housing prices and mortgage rates,
The Case-Shiller national home price index is 55% higher than when Sleepy Joe took the reins of Presidency and the 30-year mortgage rate is 64% higher.
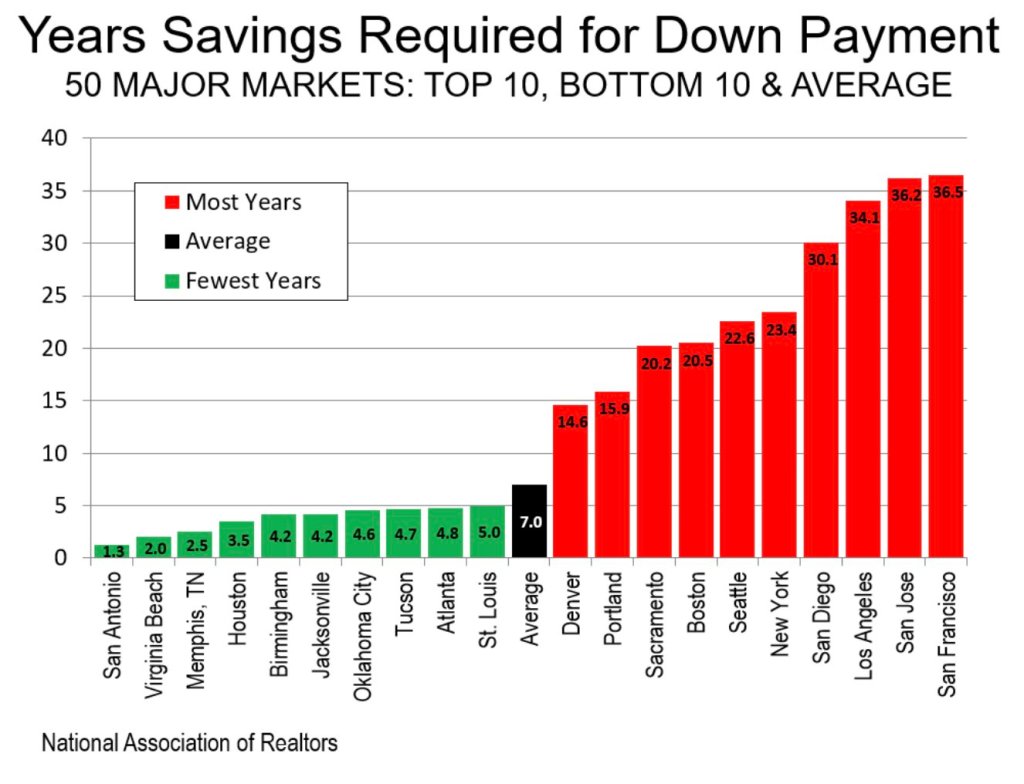
As a result of higher housing prices and mortgage rate (and Gavin Newsom’s ludicrous policies), it will take over 30 years to accumulate enough savings to buy a home in San Diego, Los Angeles, San Jose and San Francisco.
I ain’t drunk, but first-time homebuyers will need to be drunk in this housing market.
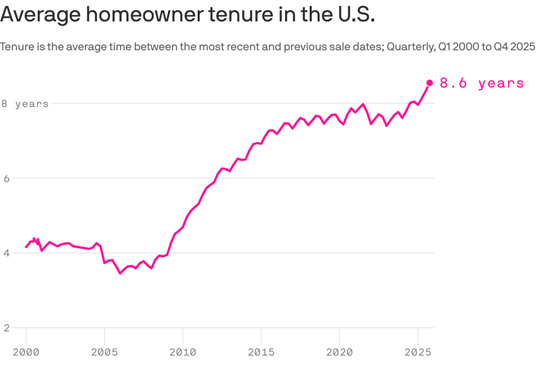
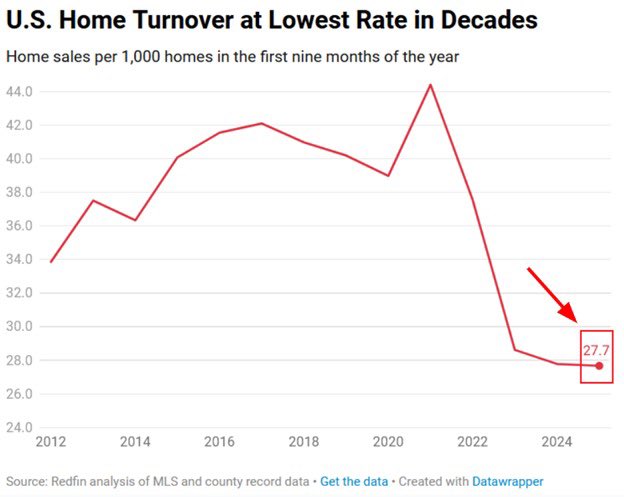
Home prices exploded under Biden and Covid Federal spending. Making housing unaffordable for millions. Now the turnover rates for homes is at its lowesst rate in decades.
Existing homes are now more expensive than new homes.
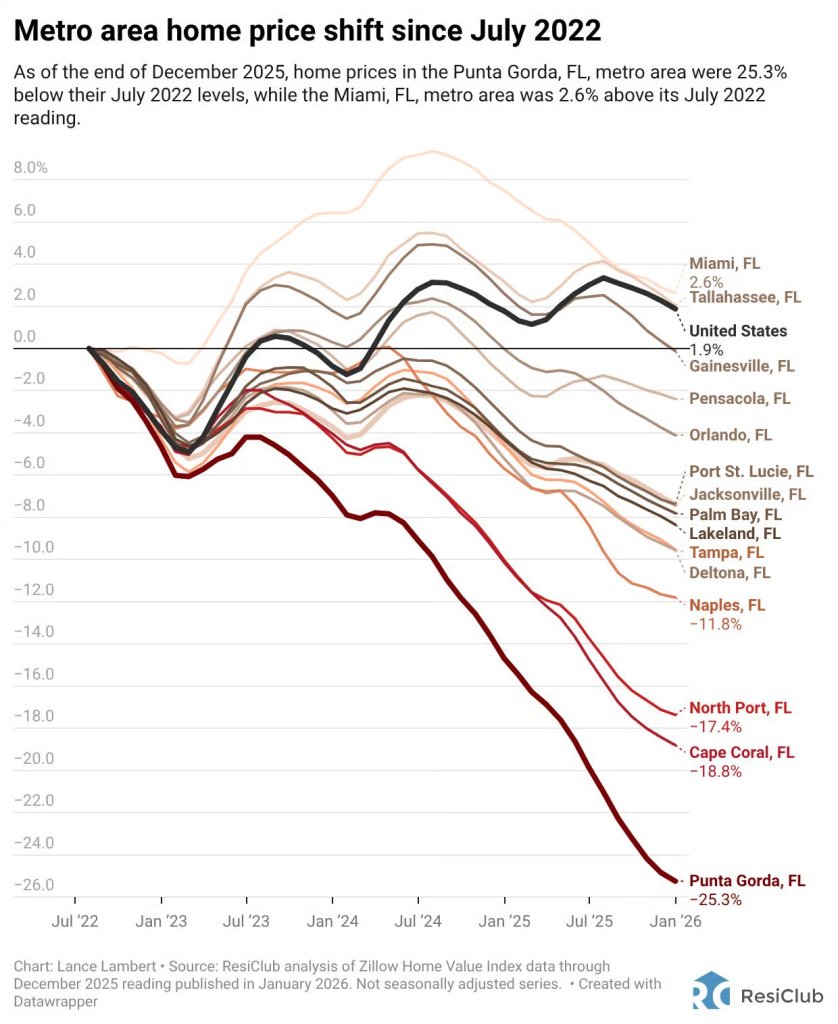
Florida housing is getting gut-punched from Naples to Punta Gorda.
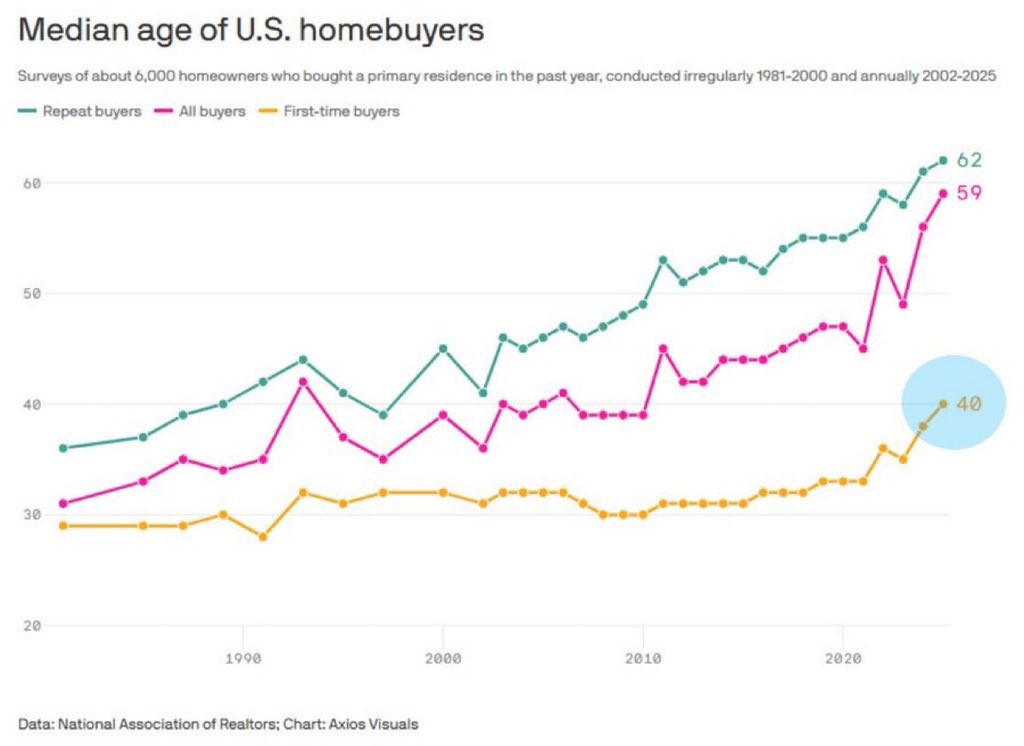
Yikes! Median age of first time homebuyers is 40.
Fortunately, Joe Biden is out of office. But Chuck Schumer may make a comeback and restart the insane Covid-era spending. Schumer, the penultimate knucklehead in Congress, approved Ketanji Brown Jackson to sit on the Supreme Court of the USA.
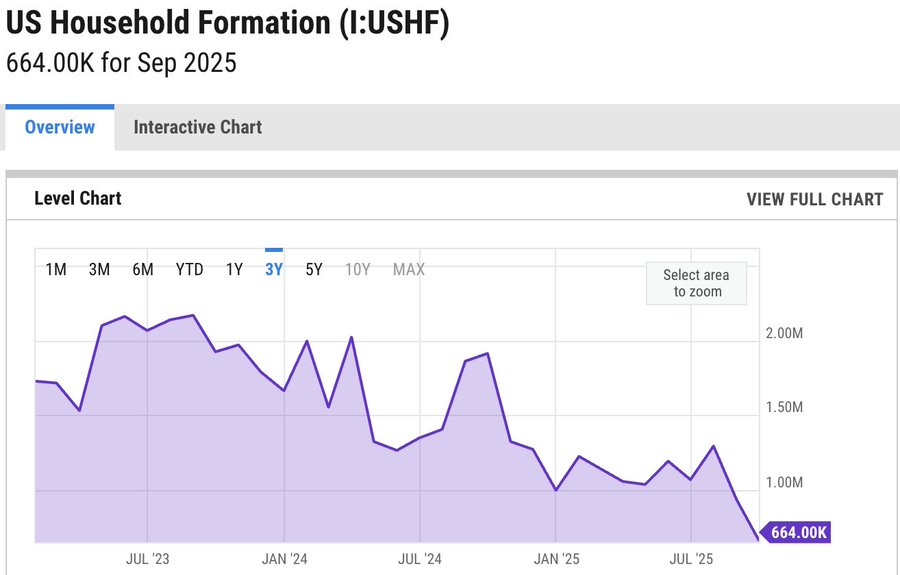
Household formation is slowing. Partly due to immigration slowing, partly due to increased cost on living (primarily due to Biden-era Federal spending).
But if Democrats win Congress, they will undoubtedly go for open borders … again.
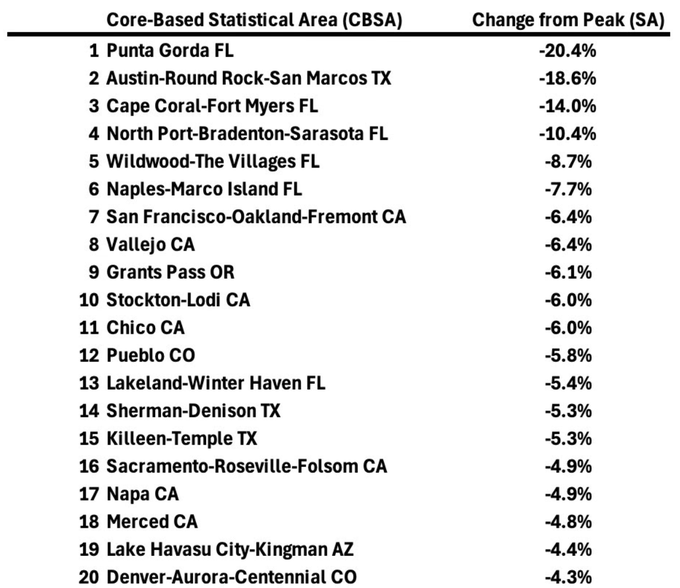
Home prices are tanking in bubble-ish metro areas like Florida, California and Austin Texas. Oddly, I have lived in Austin, San Francisco and Chico CA. All before that were bubble magnates.


You must be logged in to post a comment.