Yikes!
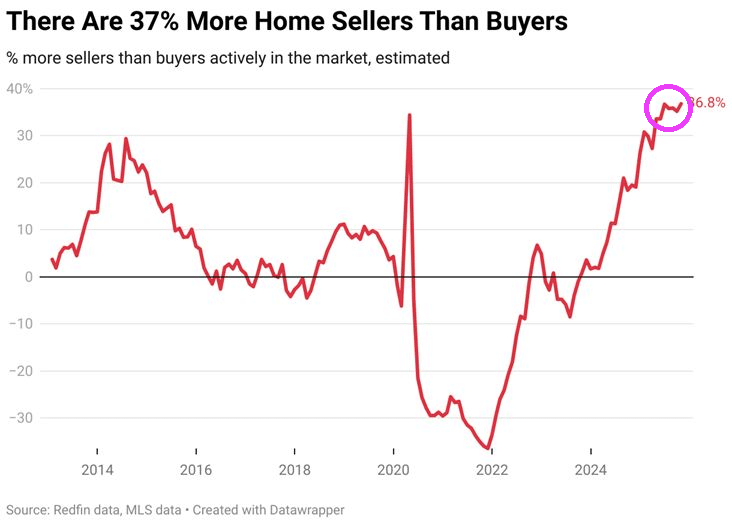
October saw an estimated 36.8% more home sellers than buyers, biggest gap in records dating back to 2013.
Confounded Interest – Anthony B. Sanders
Financial Markets And Real Estate
Yikes!
October saw an estimated 36.8% more home sellers than buyers, biggest gap in records dating back to 2013.
The good news / bad news for immigration enforcement is that home prices are declining as immigration enforcement keeps rolling. Good news for new homebuyers. Bad news for recent homeowners.
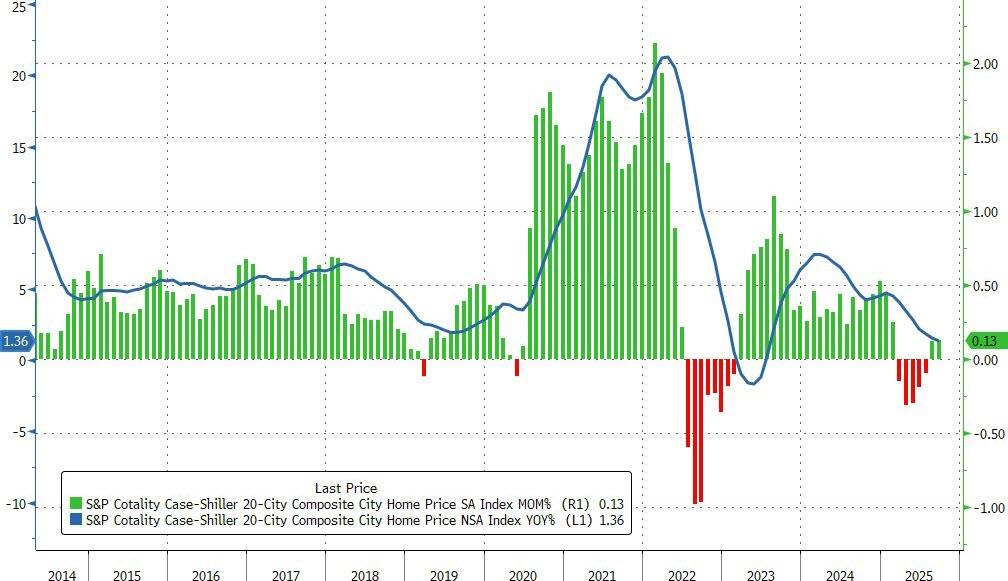
US home prices in the 20 largest cities rose 0.13% MoM in September (very slightly better than the 0.1% rise expected) and up for the second month in a row (after falling for five straight months before). This MoM rise left the average priers up just 1.36% YoY – the lowest since July 2023.
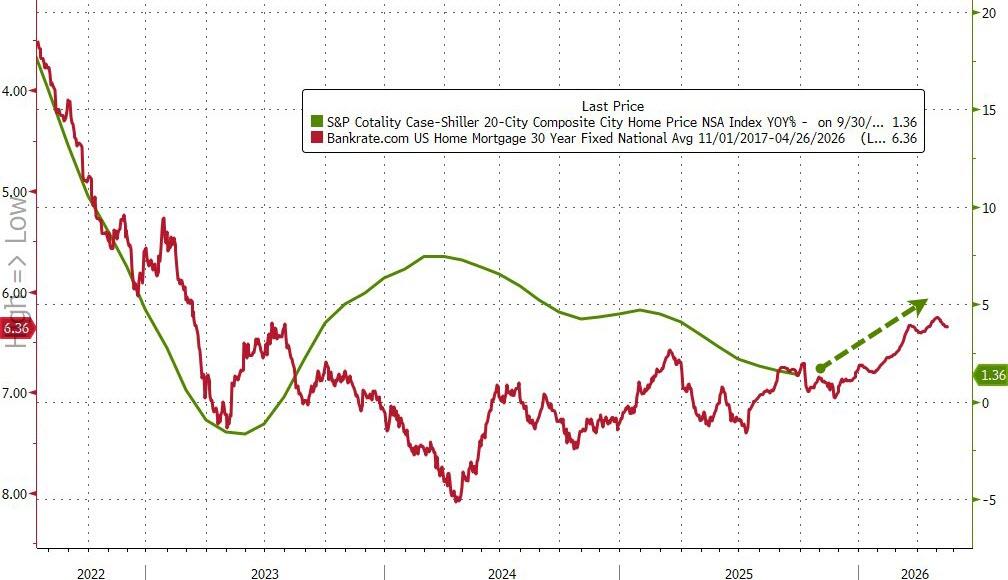
Declining mortgage rates suggest a rebound in aggregate prices could be looming…
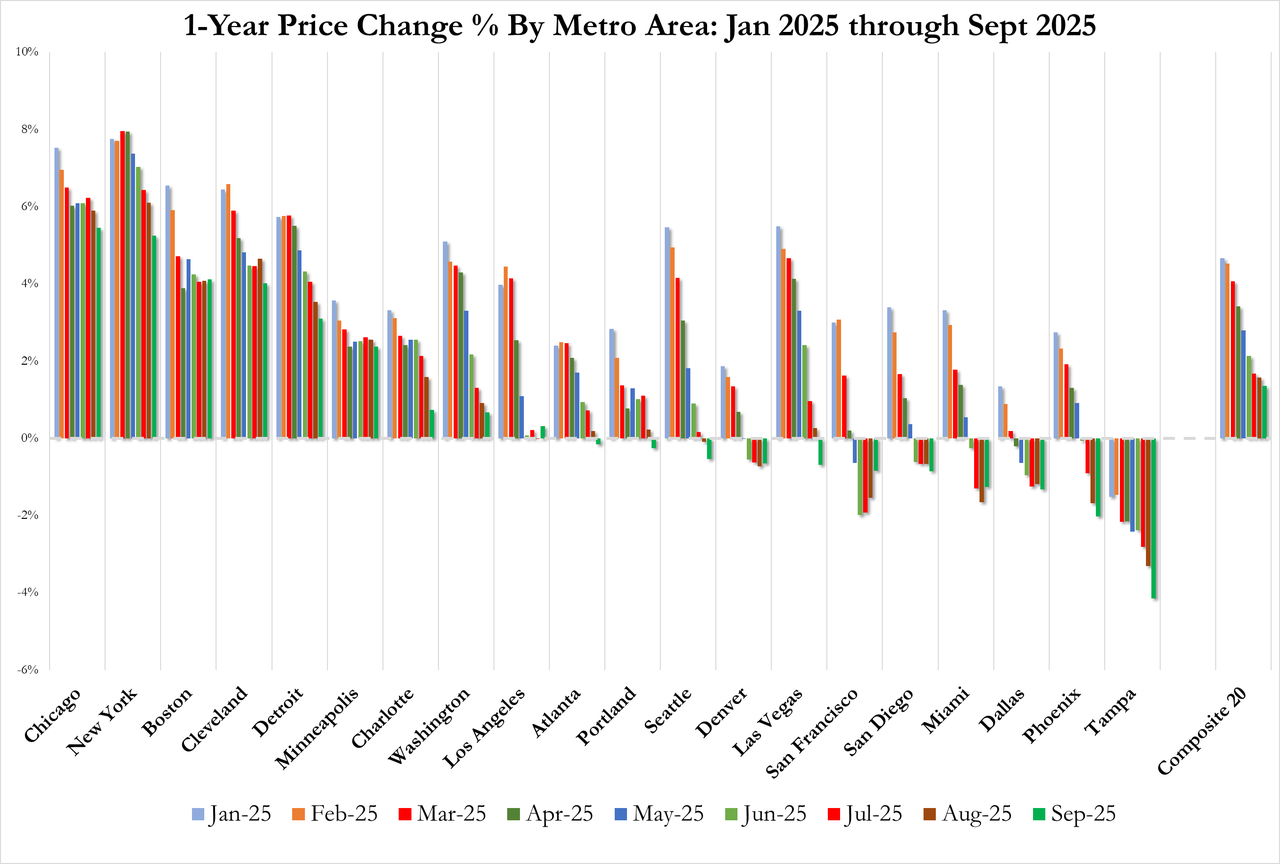
Regional performance reveals a tale of two markets.
Chicago continues to lead with a 5.5% annual gain, followed by New York at 5.2% and Boston at 4.1%. These Northeastern and Midwestern metros have sustained momentum even as broader market conditions soften.
At the opposite extreme, Tampa posted a 4.1% annual decline – the sharpest drop among tracked metros and its 11th consecutive month of negative annual returns. Phoenix (-2.0%), Dallas (-1.3%), and Miami (-1.3%) likewise remained in negative territory, highlighting particular weakness in Sun Belt markets that experienced the most dramatic pandemic-era price surges.
Home Prices are now falling (YoY) in a majority (11/20) of America’s largest cities…
“The geographic rotation is striking,” said Nicholas Godec, CFA, CAIA, CIPM, Head of Fixed Income Tradables & Commodities at S&P Dow Jones Indices.
Meanwhile, traditionally stable metros in the Northeast and Midwest continue to post solid gains, suggesting a reversion to prepandemic patterns where job markets and urban fundamentals drive appreciation rather than migration trends and remote-work dynamics.”
“Markets that were pandemic darlings—particularly in Florida, Arizona, and Texas—are now experiencing outright price declines.
And don’t forget the surge in home prices associated with increased M2 money printing around Covid.

Things are tough all over after Covid.
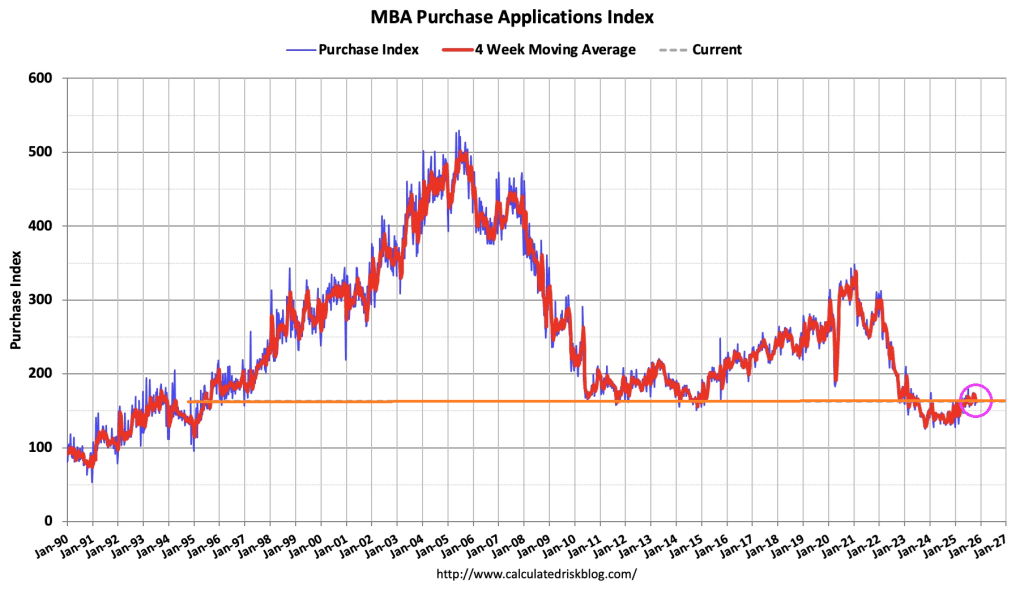
Mortgage applications decreased 5.2 percent from one week earlier, according to data from the Mortgage Bankers Association’s (MBA) Weekly Mortgage Applications Survey for the week ending November 14, 2025.
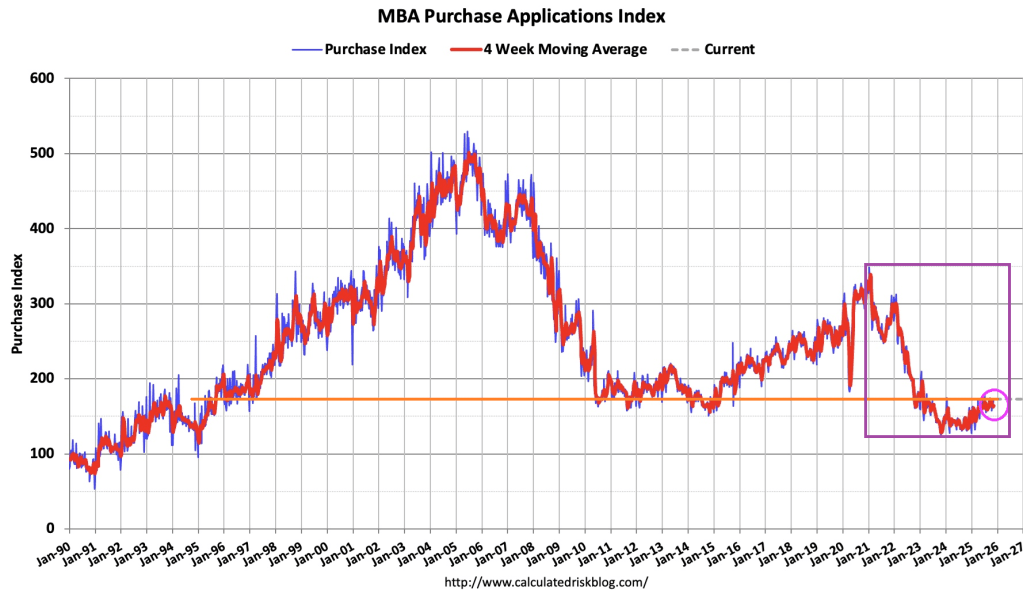
The Market Composite Index, a measure of mortgage loan application volume, decreased 5.2 percent on a seasonally adjusted basis from one week earlier. On an unadjusted basis, the Index decreased 7 percent compared with the previous week. The seasonally adjusted Purchase Index decreased 2 percent from one week earlier. The unadjusted Purchase Index decreased 7 percent compared with the previous week and was 26 percent higher than the same week one year ago.
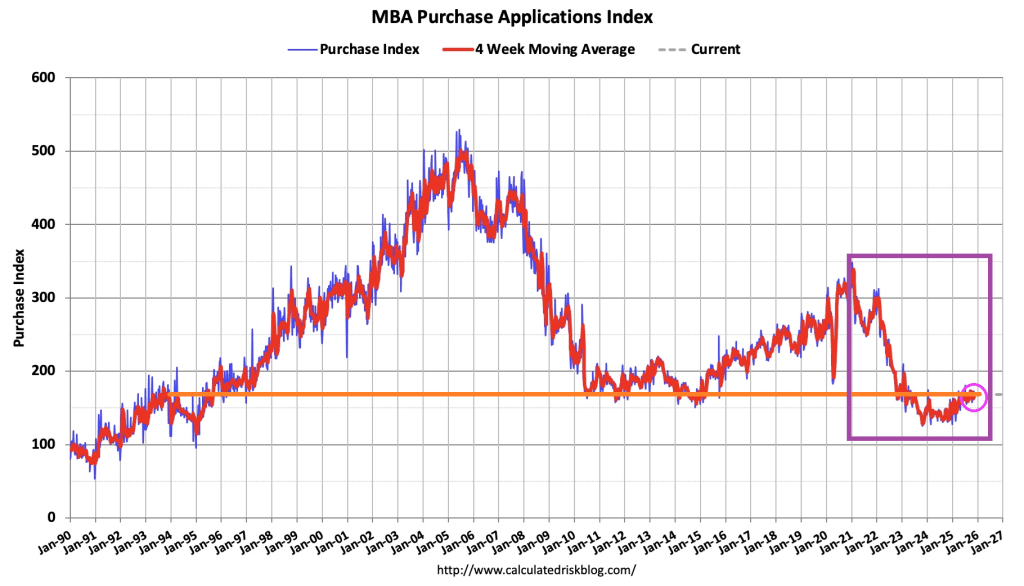
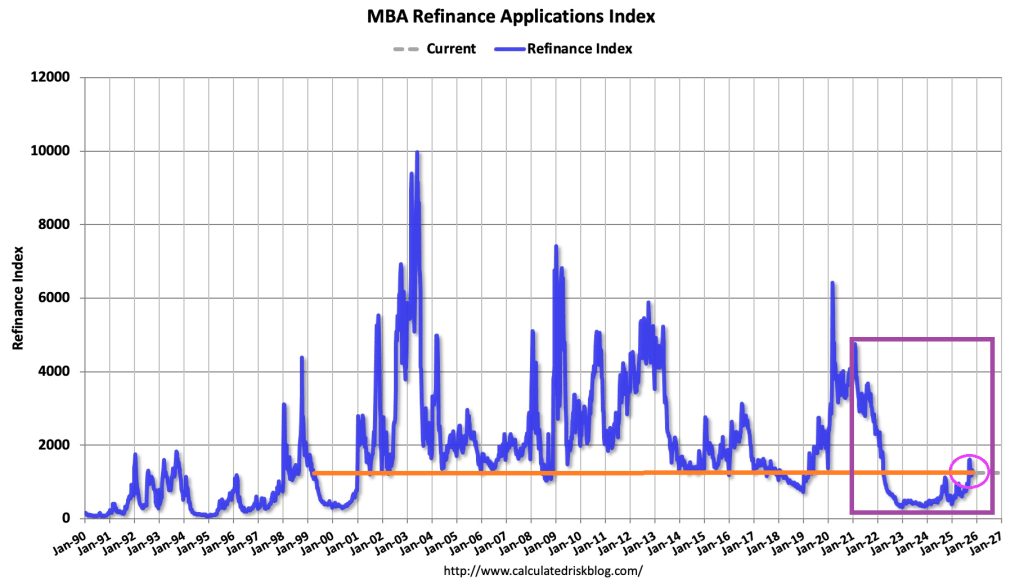
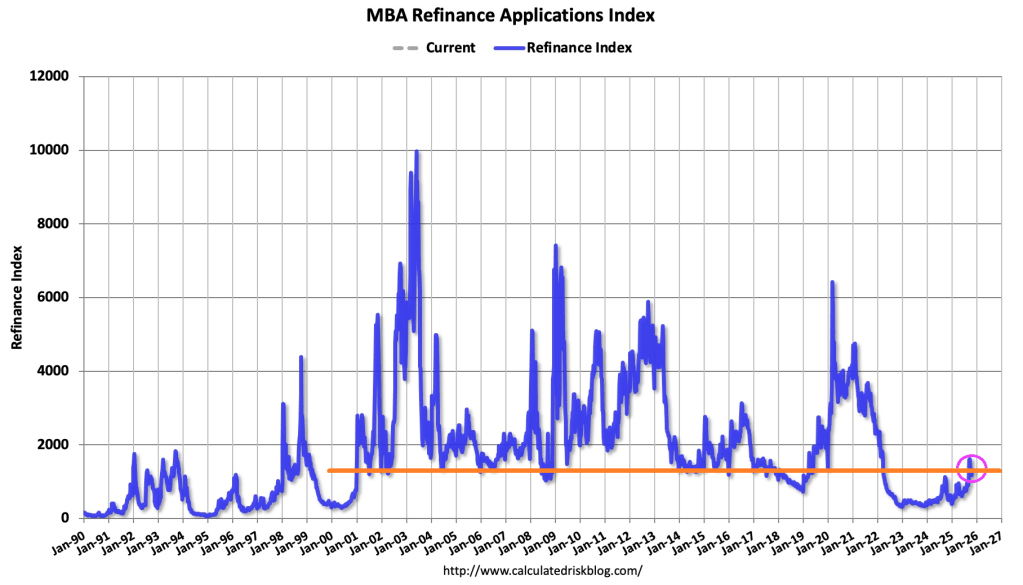
The Refinance Index decreased 7 percent from the previous week and was 125 percent higher than the same week one year ago.

The average contract interest rate for 30-year fixed-rate mortgages with conforming loan balances ($806,500 or less) increased to 6.37 percent from 6.34 percent, with points remaining unchanged at 0.62 (including the origination fee) for 80 percent loan-to-value ratio (LTV) loans.
Mortgage rates increased for the third consecutive week, with the 30-year fixed rate inching higher to its highest level in four weeks at 6.37 percent.

Every time the government tries to make housing more affordable, they make the problem worse. Some people should rent and not fall for the government’s latest folly, the 50-year mortgage.
True, the 50-year mortgage would lower the monthly payment by several hundred dollars (see the following example where the monthly payment falls from $2,349 to $2,083. Or from $2,349 to $2,226 if the most rate increases with the longer mortgage life. BUT total interest paid increases 87% if the 50-year rate remains the same and 105% if the rate rises.
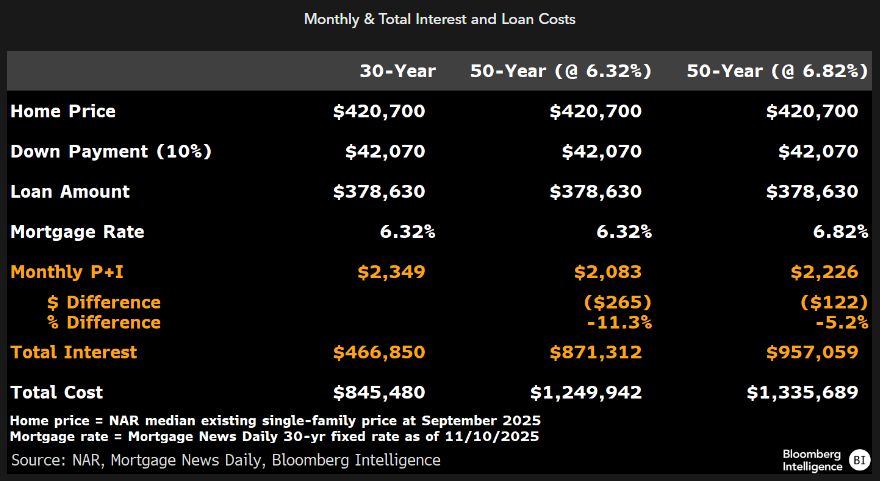
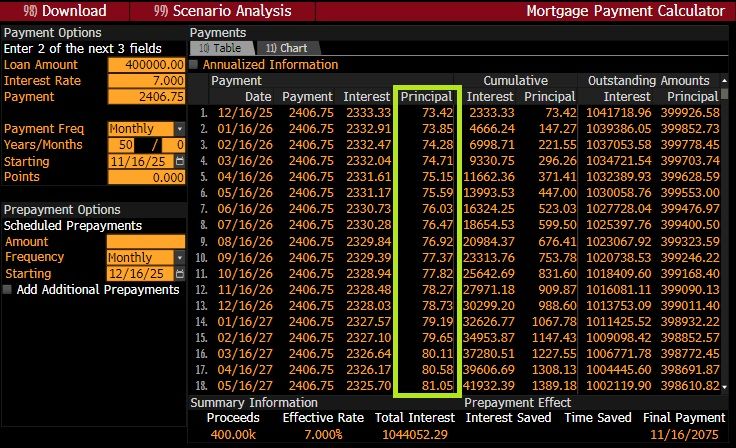
Principal paydown slows to a crawl with a 50-year mortgage, leaving the lender (or mortgage holder) exposed to higher risk if home prices fall.
Government housing policies remind me of the Curly versus the oyster stew skit. where Curly can’t catch the oyster. Yet keeps trying.
The 50-year mortgage reminds me of the ill-fated National Homeownership Strategy under Bill Clinton. By prdering all Federal housing finance entities to work with HUD, the National Homeownership Strategy helped crash the housing market (watch The Big Short!)

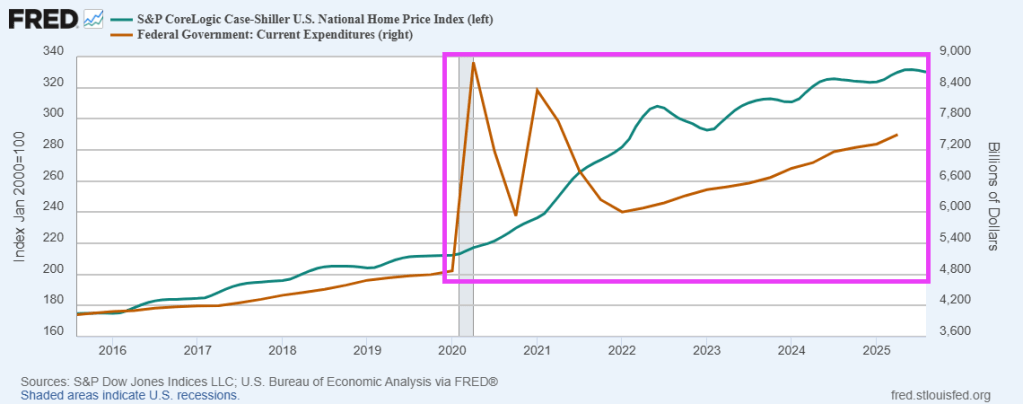
2020. A year that goes down in infamy. The Covid outbreak and the government’s insane overreaction to it. Masks and massive spending, driving up housing prices.
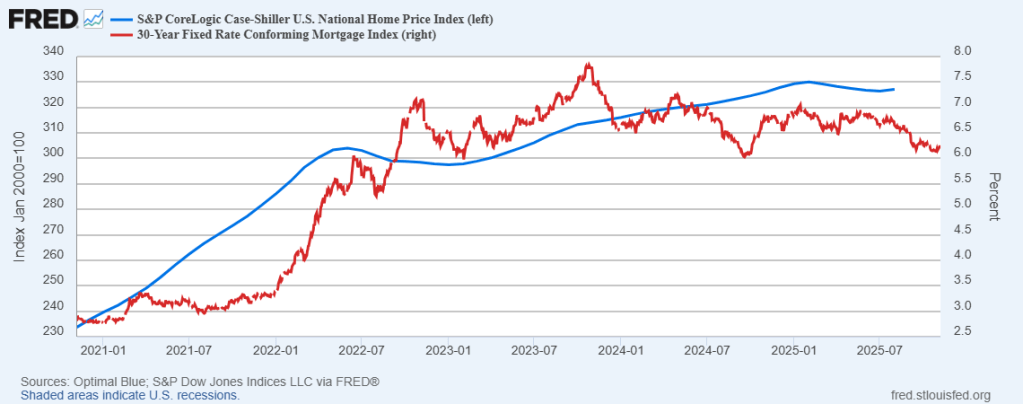
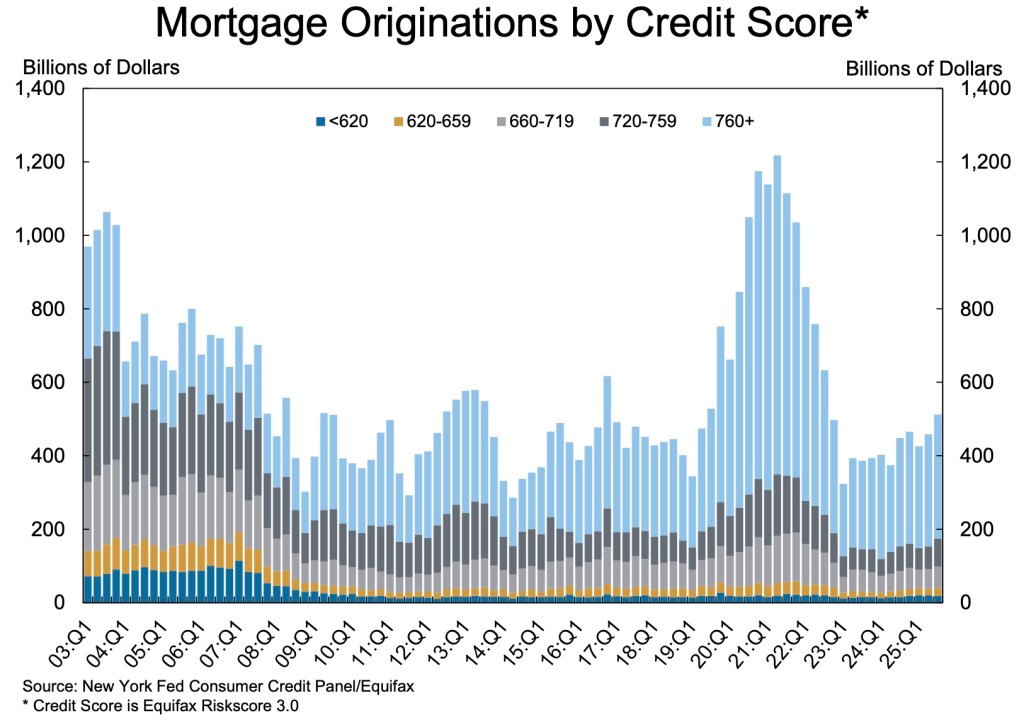
After 2020, mortgage originations plummeted while housing prices soared.
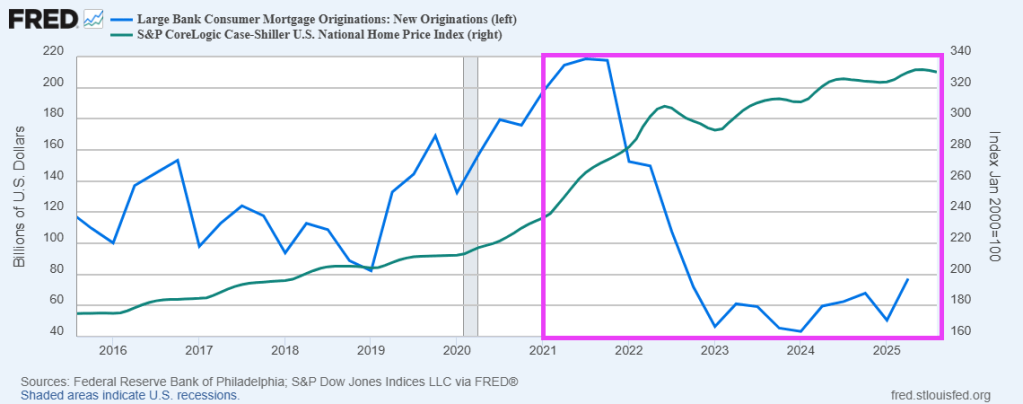
US home prices took off like a scalded cat after the Federal government went on a massive spending spree in 2020.

The US mortgage market is “livin’ on a prayer.” As a result, former homebuilder and current FHFA Director Bill Pulter has suggested 2 mortgage products to make US homes more “affordable”, adding to the legacy of stupid government policies to increase homeownership.
But first, current mortgage demand. Mortgage applications increased 0.6 percent from one week earlier, according to data from the Mortgage Bankers Association’s (MBA) Weekly Mortgage Applications Survey for the week ending November 7, 2025.
The Market Composite Index, a measure of mortgage loan application volume, increased 0.6 percent on a seasonally adjusted basis from one week earlier. On an unadjusted basis, the Index decreased 1 percent compared with the previous week. The seasonally adjusted Purchase Index increased 6 percent from one week earlier. The unadjusted Purchase Index increased 3 percent compared with the previous week and was 31 percent higher than the same week one year ago.
The Refinance Index decreased 3 percent from the previous week and was 147 percent higher than the same week one year ago.
Now on to Pulte’s stupid mortgage proposals.
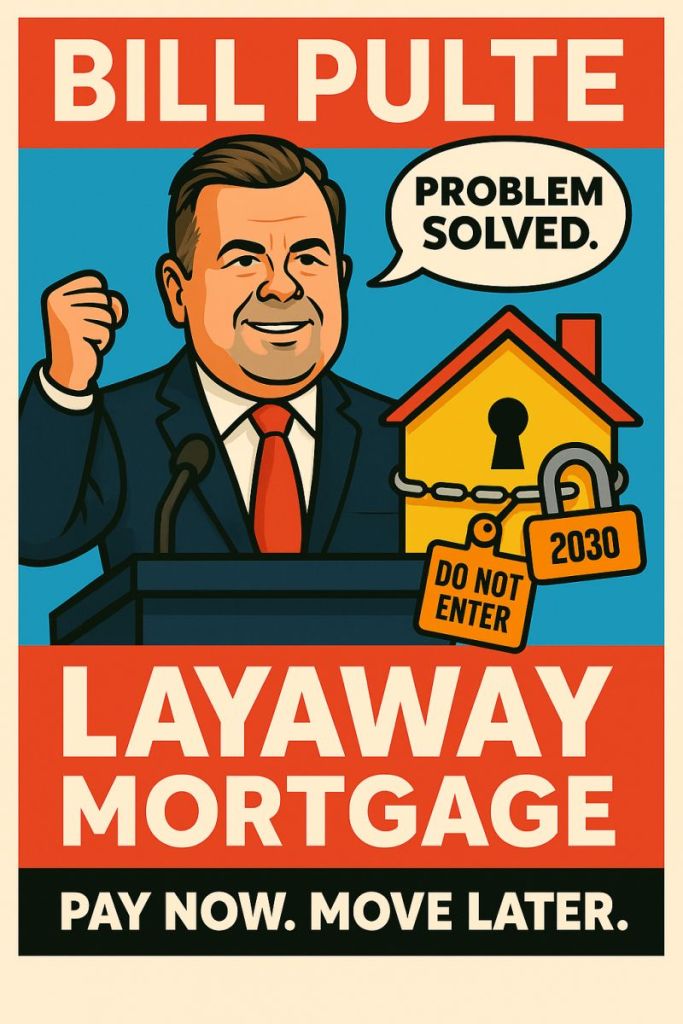
Pulte Doubles Down After 50-Year Backlash, Proposes “Layaway Mortgage”
The 50-year mortgage is a stupid idea. True, it can reduce the monthly mortgage payment by several hundred dollars. But it extends the life of the mortgage from 30 to 50 years, keeping the outstanding mortgage balance elevated for longer, exposing the lender (or mortgage owner) to greater losses in the case of default. Not surprising since the duration risk of a 50-year mortgage is greater than on a 30-year mortgage. Who is going to hold these mortgages??
So, Pulte hearing that the mortgage market thinks this is a stupid idea, introduced another stupid mortgage idea: the “layaway mortgage” where buyers make payments for 5-10 years before they’re allowed to move into the home. This is a variation of “rent to own.”
Under Pulte’s Layaway Mortgage program:
▪️ Buyers select a home and begin making monthly payments immediately
▪️ They continue paying for 5-10 years (the “layaway period”)
▪️ During this time, they cannot live in the home, modify it, or even visit without an appointment
▪️ After the layaway period ends, buyers can move in and begin their 40-year mortgage
▪️ If they miss a payment during layaway, they forfeit everything and the home goes back on the market.
So, in other word, a 50-year mortgage (40+10 layaway).
Note: Japan used to offer 100-year mortgages during their housing bubble, but now 35-year mortgages are more common.
The Federal government is still shut down, so we have to rely on ADP for jobs numbers.
The ADP weekly jobless report pointed to a deterioration in US labor momentum, stating that “for the four weeks ending Oct. 25, 2025, private employers shed an average of 11,250 jobs a week, suggesting that the labor market struggled to produce jobs consistently during the second half of the month.”
Added together that is 45,000 job losses in the month (not including government workers), which would be the largest monthly drop in jobs since March 2023.
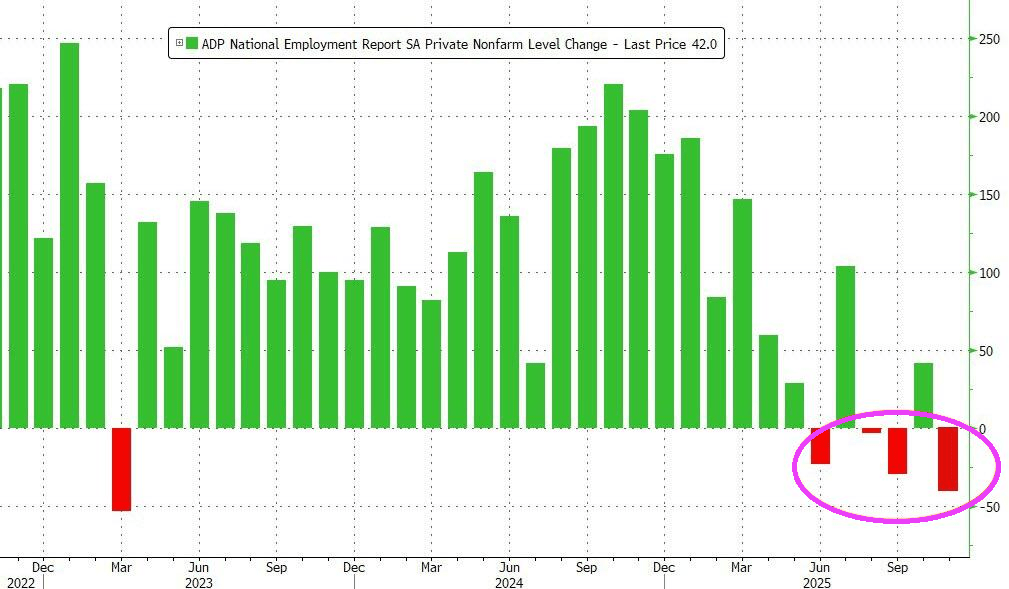
A sustained increase in layoffs would be particularly concerning now because the hiring rate is low and it is harder than usual for unemployed workers to find jobs.
It is likely that The Fed will cut rates to compensate. Rate cuts around the corner!
Redfin’s Housing Turnover Report, Q1–Q3 2025
Just 2.8 homes out of every 1,000 changed owners in the first nine months of 2025—the lowest turnover rate in at least three decades. This marks a 38% plunge from the 2021 frenzy, when 44 per 1,000 homes sold, and is 44% below the pre-pandemic 2019 pace of 40 per 1,000.
Why the freeze? – Rate lock-in: Over 70% of homeowners are sitting on sub-5% mortgages and are reluctant to trade them for today’s rates exceeding 6%.
Sticker shock: Record prices combined with high borrowing costs have left many potential buyers on the sidelines. The result is a housing market that remains stagnant.
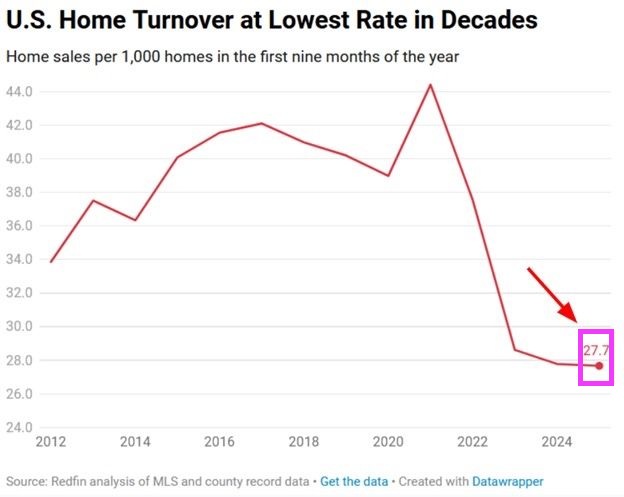
*Home prices are relatively high as are mortgage rates.
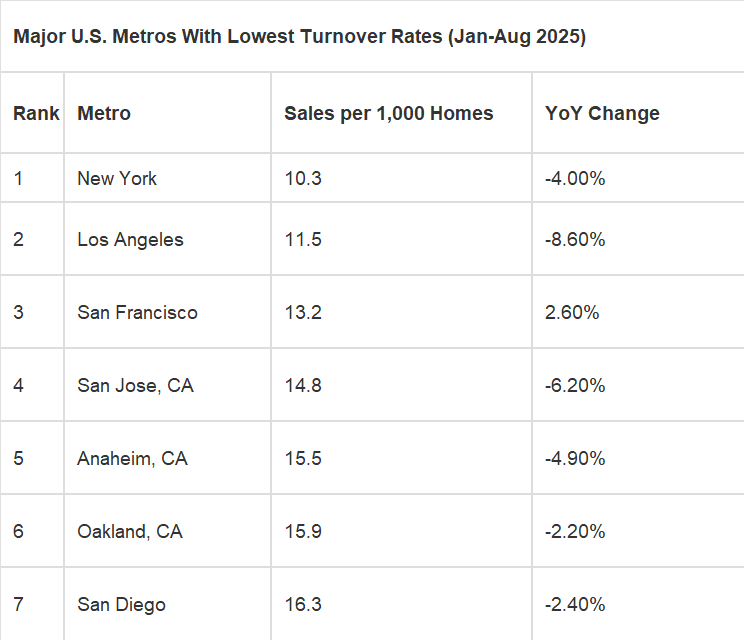
Someone will undoubtedly write me to look at Singapore. Yes, I know. Been there, done that. Or London.
In the US, the lowest turnover rates are in Democrat strongholds New York and California.
Mortgage applications decreased 1.9 percent from one week earlier, according to data from the Mortgage Bankers Association’s (MBA) Weekly Mortgage Applications Survey for the week ending October 31, 2025.
The Market Composite Index, a measure of mortgage loan application volume, decreased 1.9 percent on a seasonally adjusted basis from one week earlier. On an unadjusted basis, the Index decreased 3 percent compared with the previous week. The seasonally adjusted Purchase Index decreased 1 percent from one week earlier. The unadjusted Purchase Index decreased 2 percent compared with the previous week and was 26 percent higher than the same week one year ago.
The Refinance Index decreased 3 percent from the previous week and was 151 percent higher than the same week one year ago.
Mortgage originations are still strong for the 760+ bucket.
Let’s see how California’s Prop 50 (Gavin Newsom’s attempt to give Democrats a majority in the US House of Representatives) works?

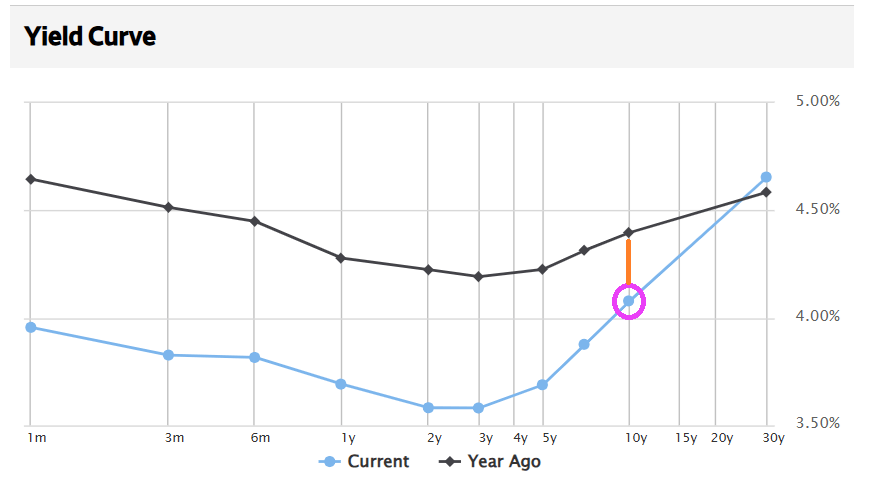
A new week starts! And the all-important 10-year Treasury yields checks in at 4.112%, down from 4.397% one year ago.
Let’s see if Senate Democrats agree to open the Federal government.


You must be logged in to post a comment.