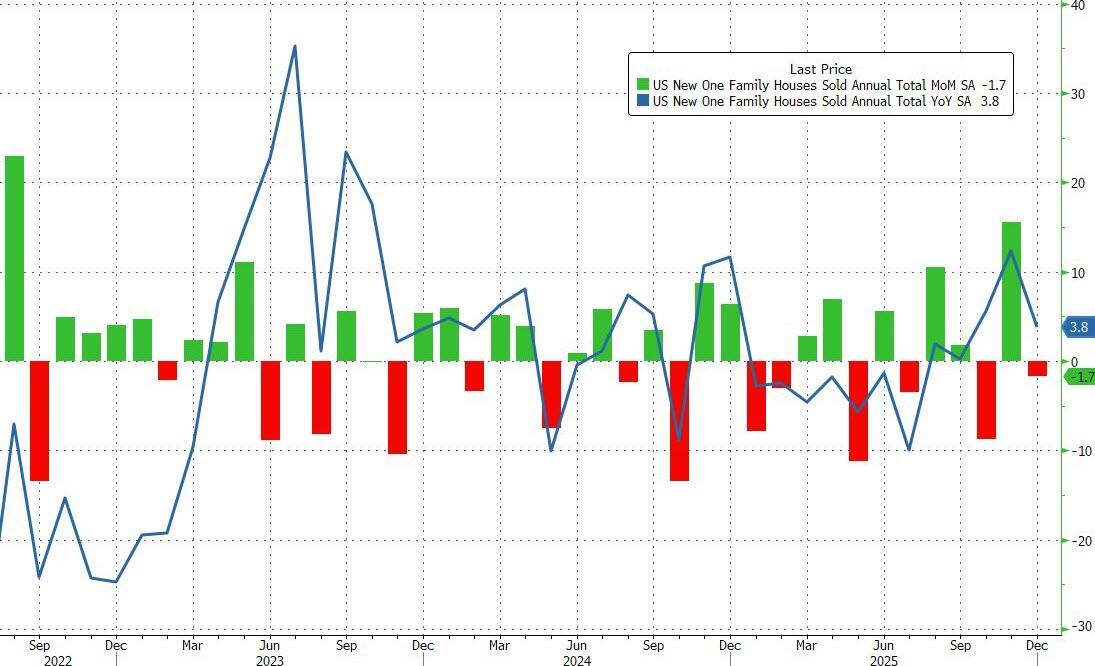
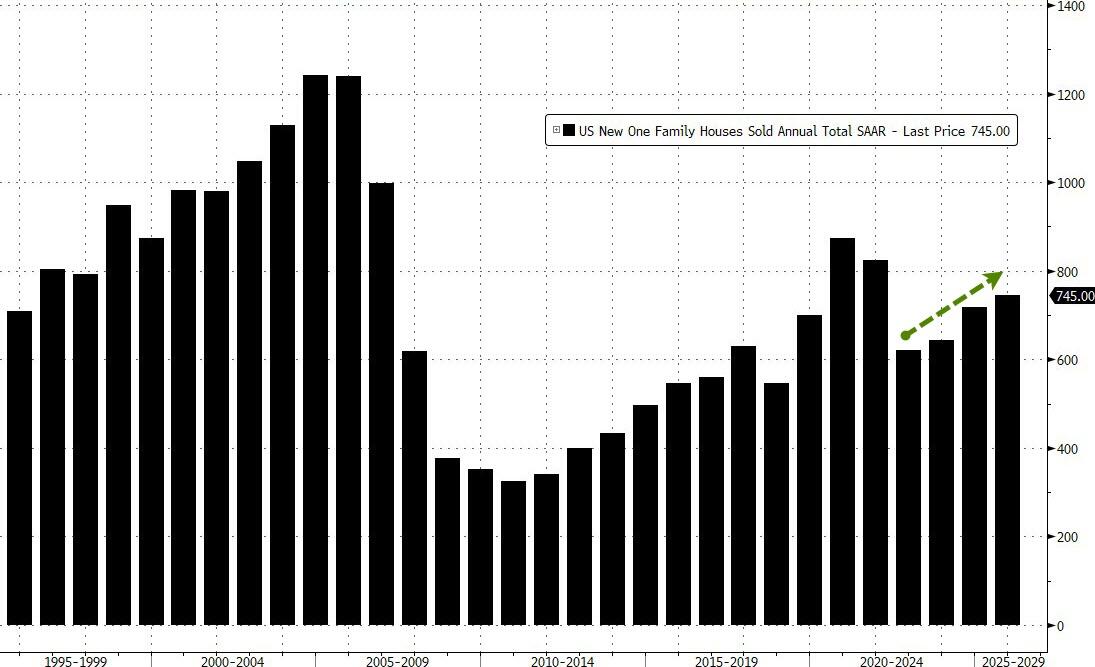
…but ended the year at 745k – the highest SAAR since 2021…
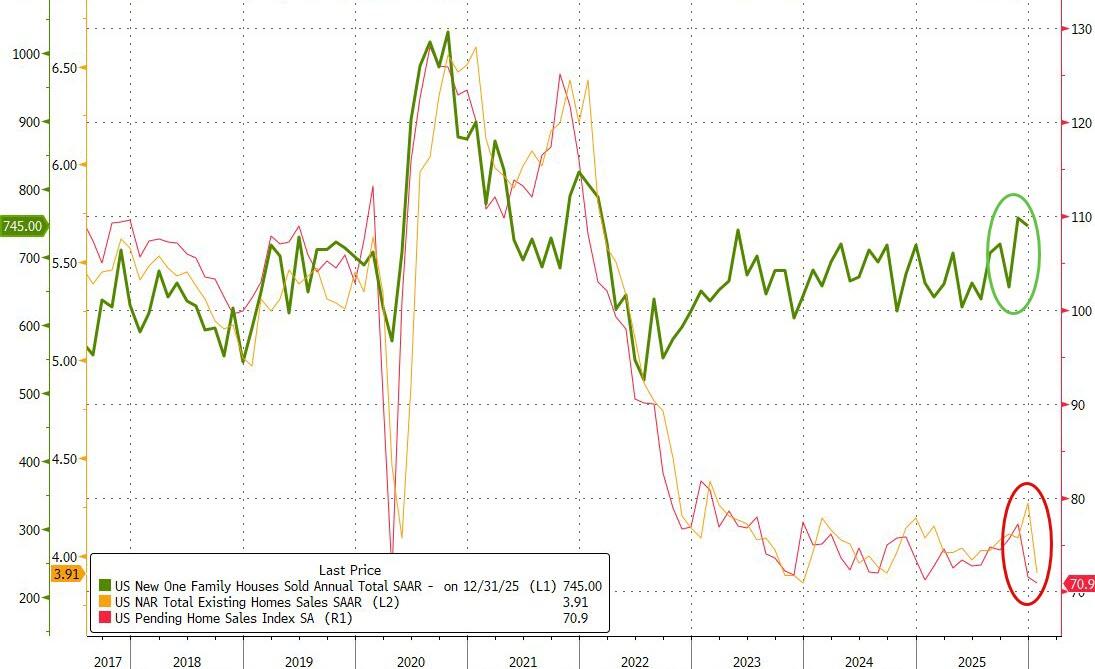
“New” home sales have notably decoupled from “used” home sales in the last few years as homebuilders incentivize buyers (reducing margins) and lower prices (reducing revenues)…
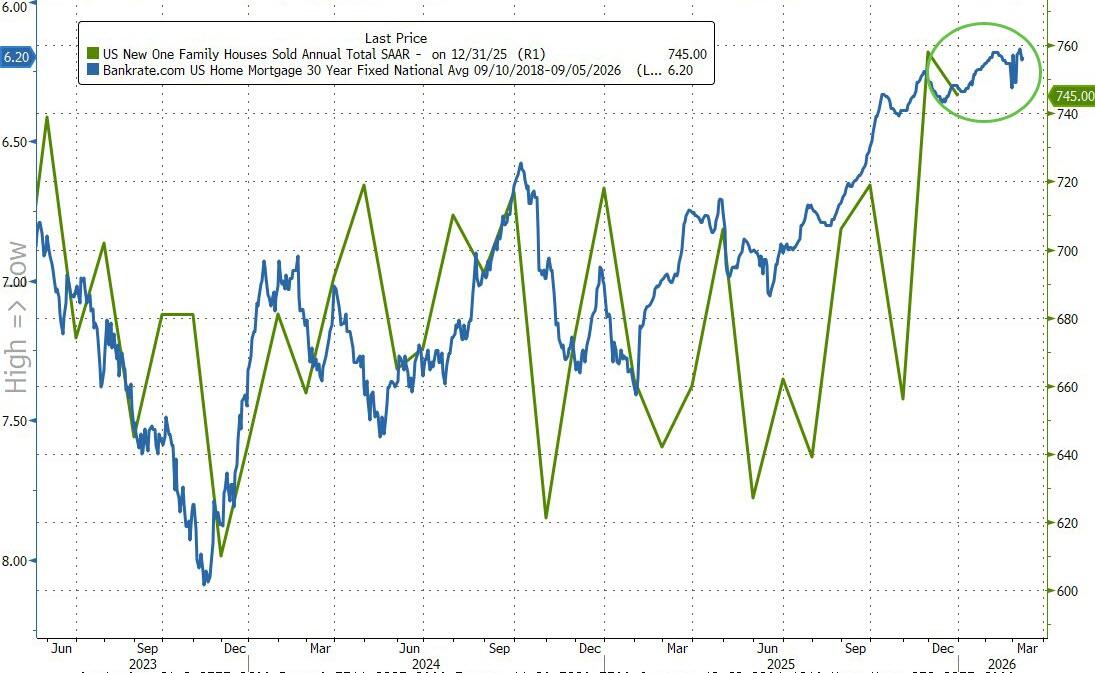
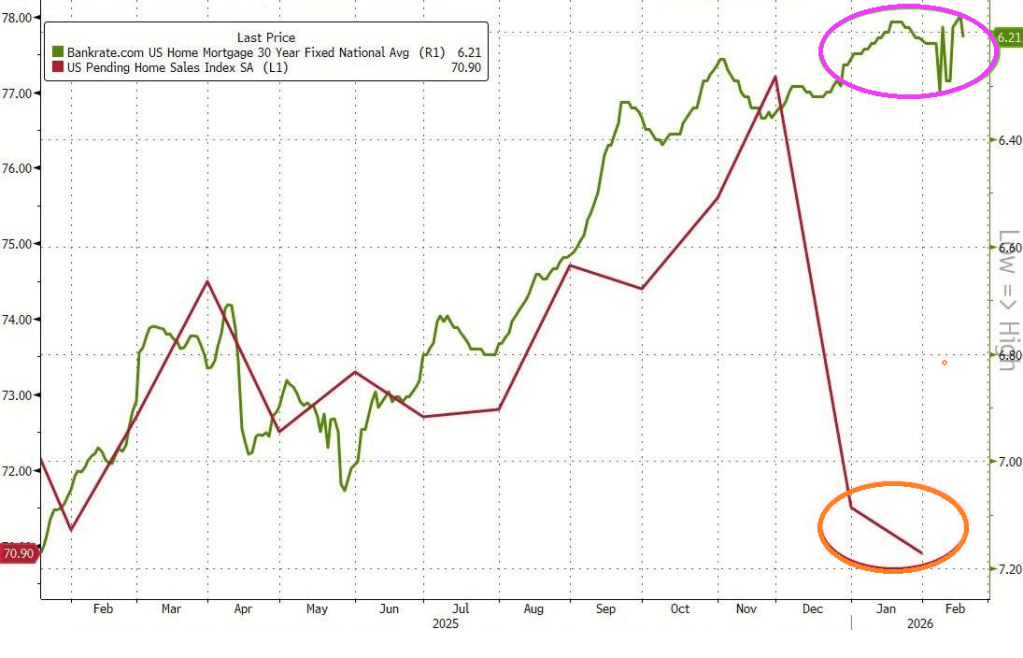
Lower mortgage rates support modest further improvements in sales…
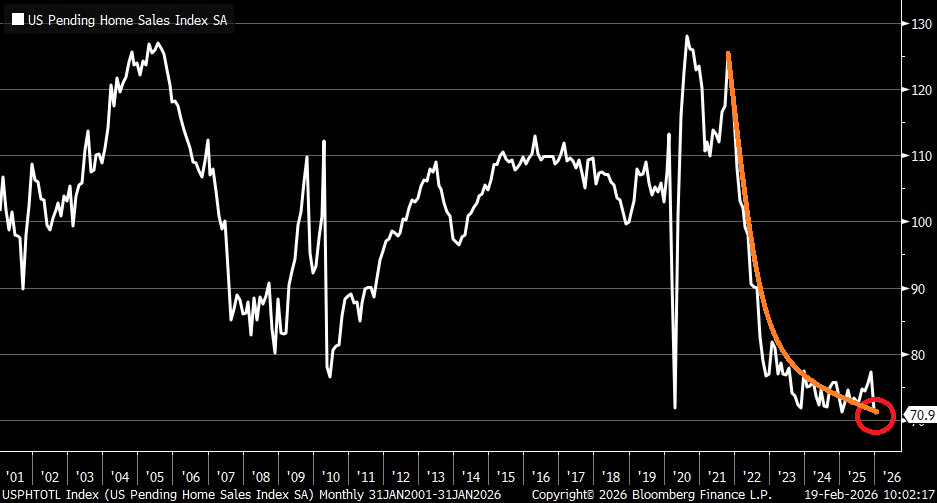
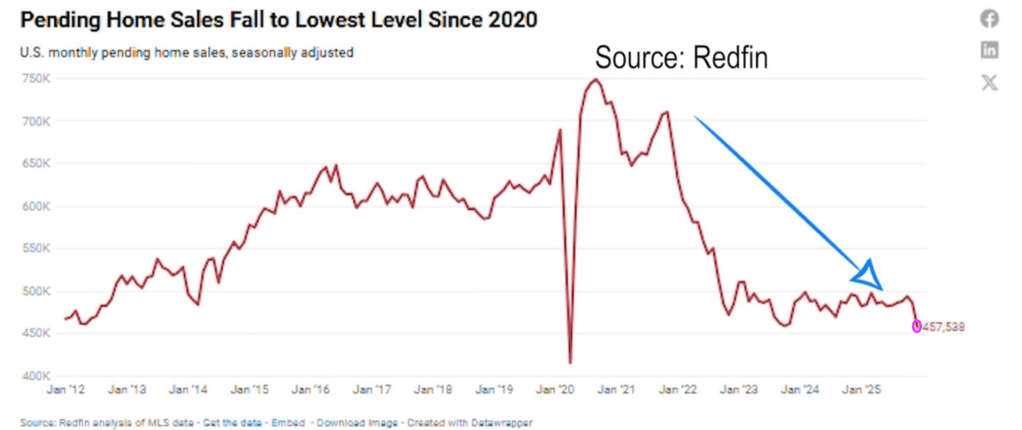
Unfortunately, US pending home sales have collapsed to the lowest level since at least 2001. Nothing has been the same since Biden/Harris administration.
Mortgage rates are still too high by historic standards.
Speaking of Democrats running the economy, New York’s mayor Zoran Mandami (the Ugandan Communist) is seeking to raise property taxes to 9.5% which will hit EVERY New Yorker, not just the billionaires he allegedly wants to tax.
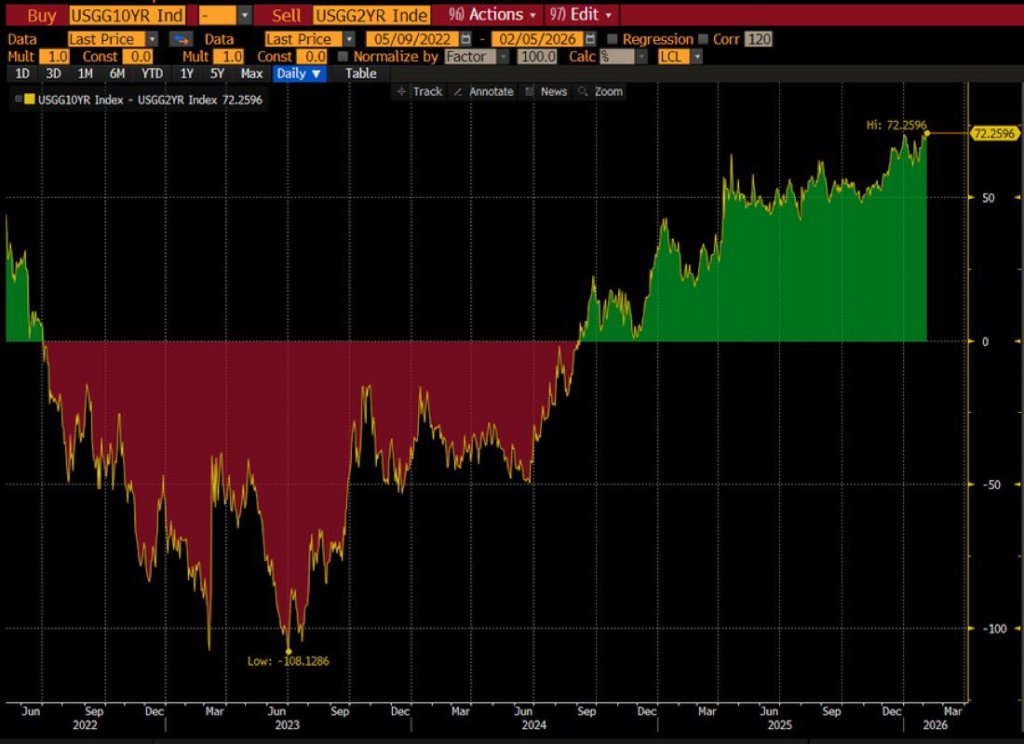
Rate-cut expectations have surged (dovishly) higher this week (along with tumbling Treasury yields) amid a mixed macro picture (Labor market ‘good’, Retail sales bad, Housing ugly).
Today could change all that as CPI for January prints with risk skewed to the upside. January brings annual resets and they tend to surprise on the high side.
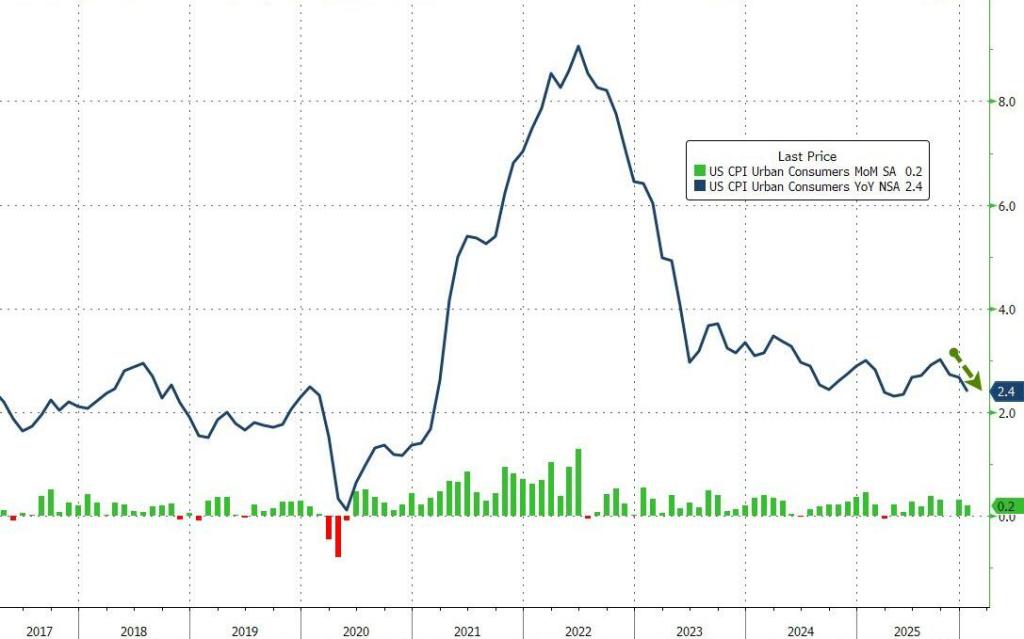
Despite the ‘hot’ whisper numbers (and 4 previous Januarys in a row of upside surprises), headline consumer price inflation came in cooler than expected in January (+0.2% MoM vs +0.3% expected). That pulled the headline CPI down dramatically from +2.7% to +2.4% – near the lowest in 4 years.
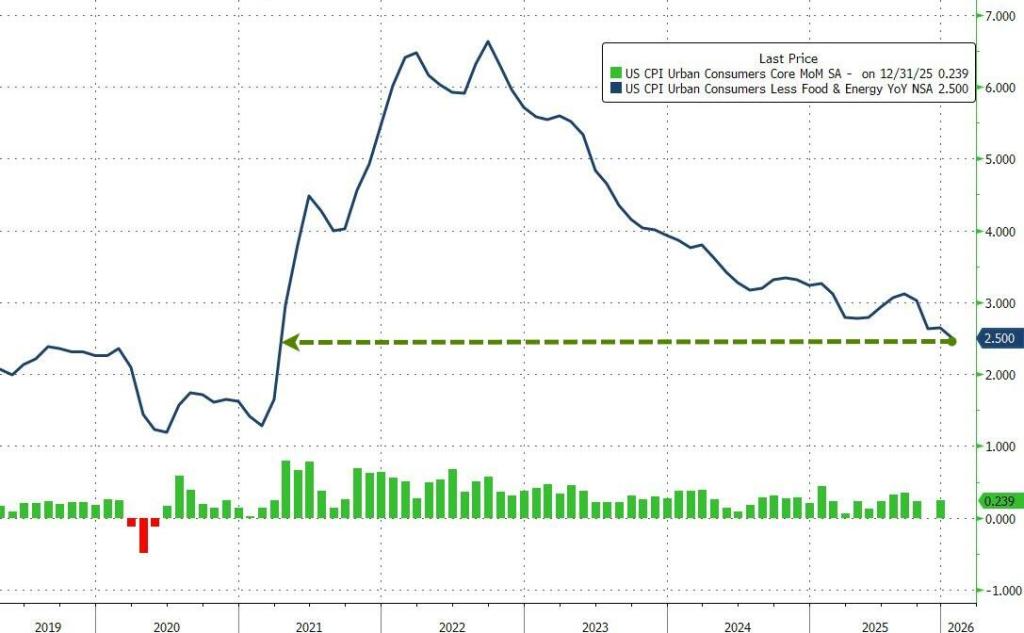
Core CPI printed +0.3% MoM (in line with expectations), lowering the YoY change in core prices to +2.5% – the lowest since March 2021.
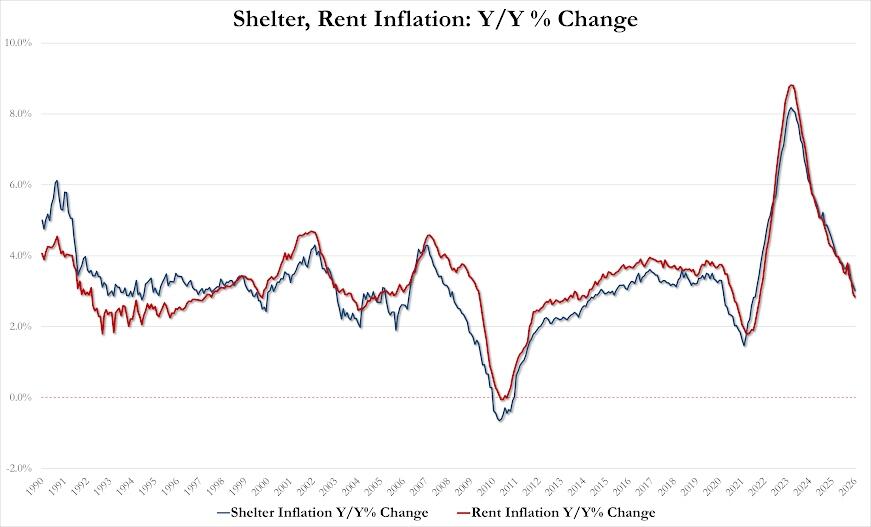
The Shelter index rose 0.2% in January and was the largest factor in the all items monthly increase. The food index increased 0.2% over the month as did the food at home index, while the food away from home index rose 0.1 percent. These increases were partially offset by the index for energy, which fell 1.5% in January.
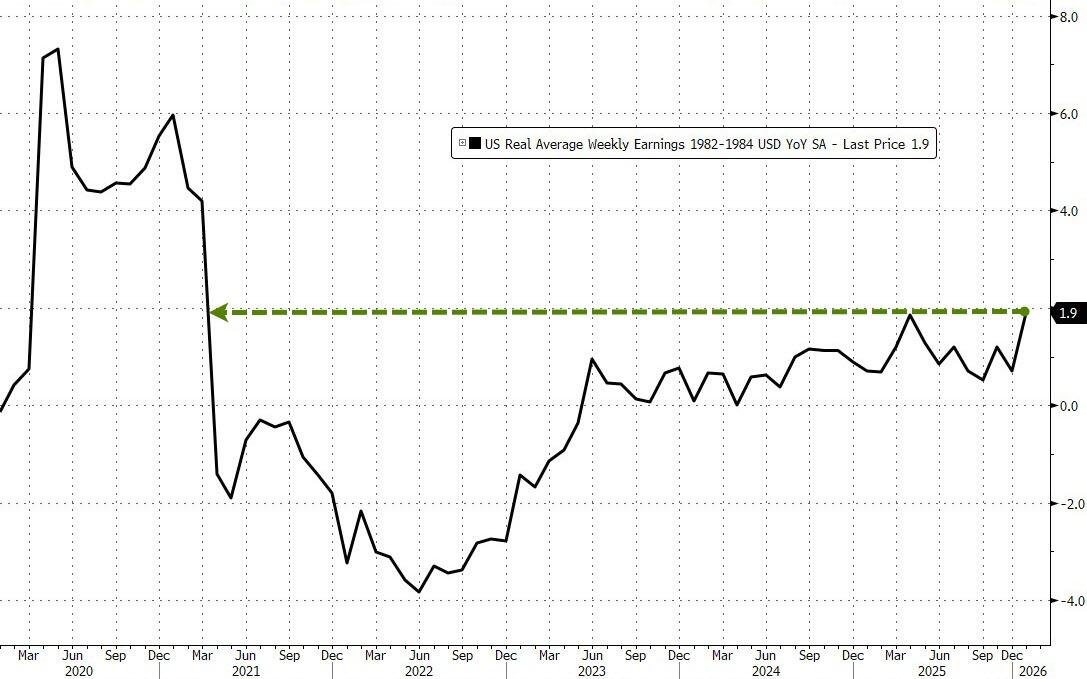
January saw real average weekly earnings rise 1.9% YoY – its highest since March 2021…
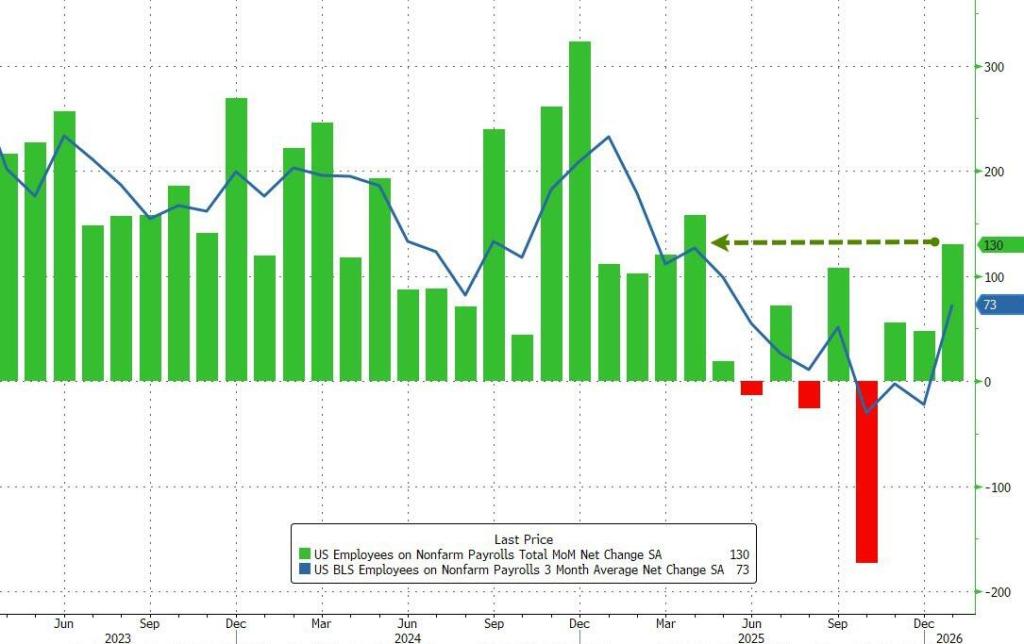
In January the US added 130K jobs, double the 65K median estimate and up from a downward revised December print of 48K (vs 50K previously). This was also the highest monthly jobs increase since December 2024.
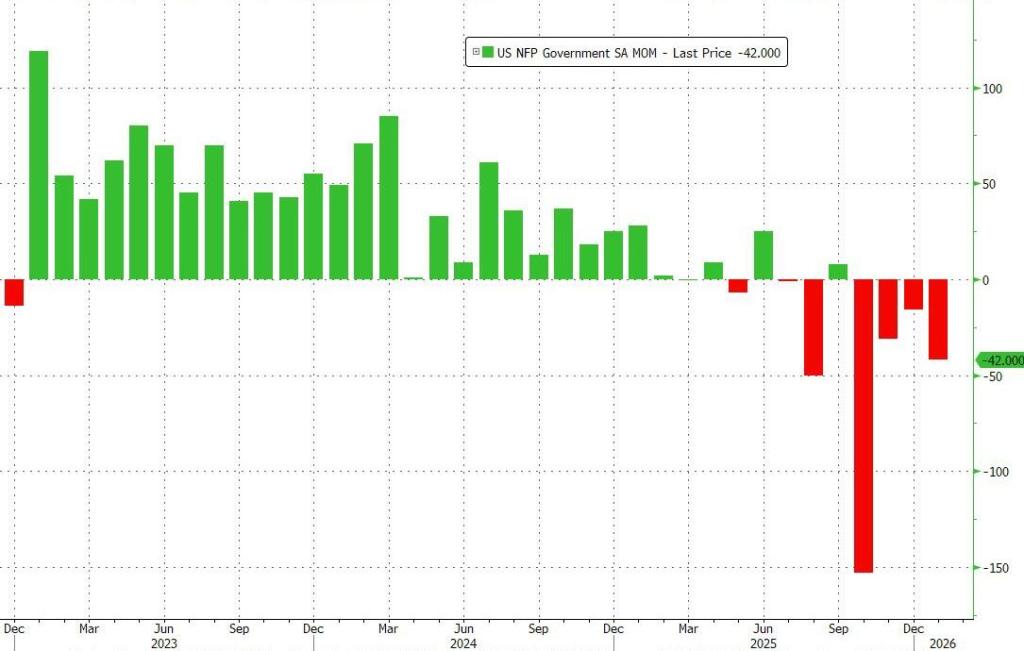
Government jobs fell by -42k. Furthering the trend for growing private sector employment and declining government employment.
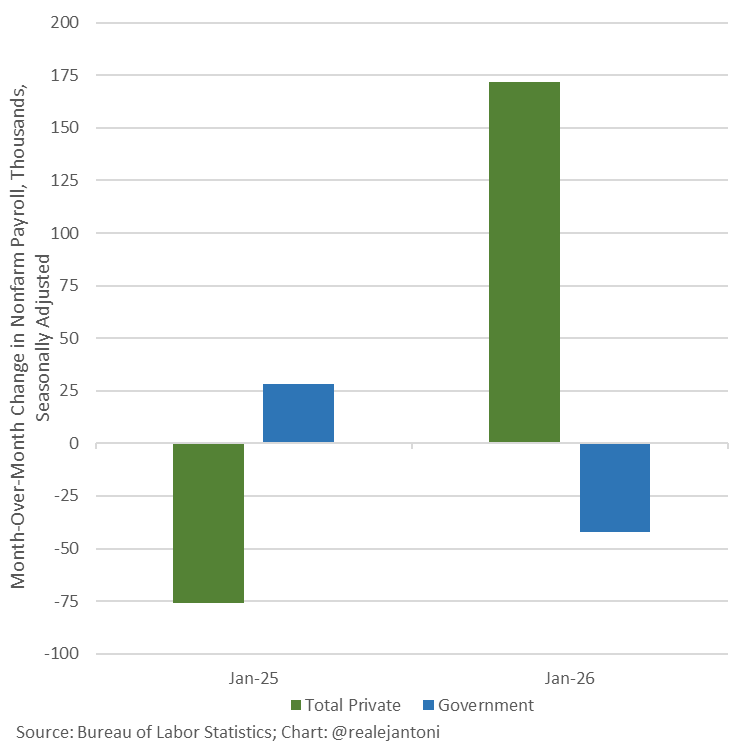
Compared to Jan 2025, we see the growth in private sector employment and decline in government jobs.
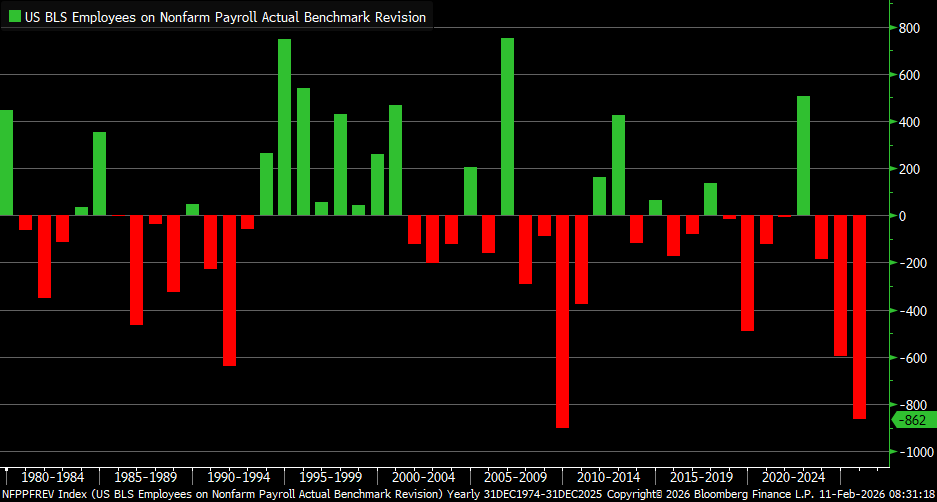
The jobs report comes with the largest jobs revision since 2009/2010.
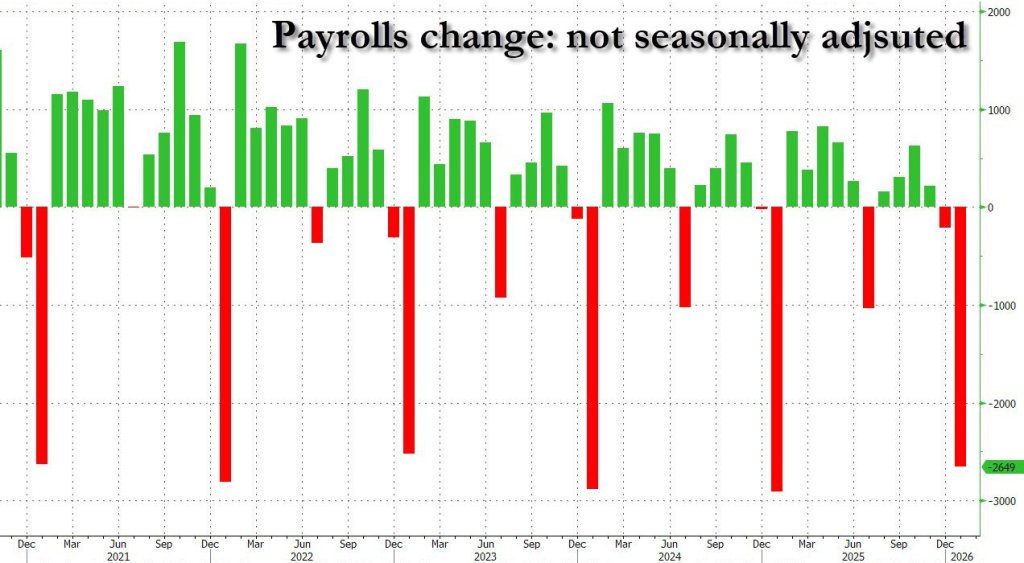
Now for the bad news, As my OSU/Chicago/GMU know, I prefer NON seasonally adjusted data when at all reasonable. While Seasonally adjusted jobs added SEASONALLY ADJUSTED was +130K, NOT seasonally adjusted jobs added was -2.649 Million.
Happy birthday to Tina Louis (Ginger from Gilligan’s Island) who turned 92 today.
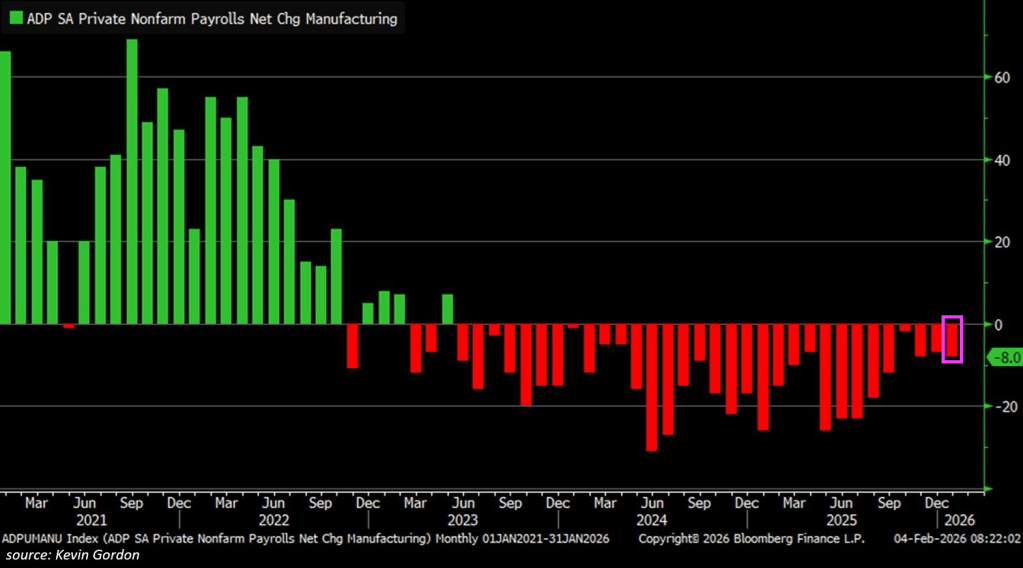
The manufacturing sector shed -8,000 jobs in January, according to the ADP private employment report.
This marks the 32nd consecutive monthly decline, the longest streak since data began in 2010.
In 2024 and 2025, manufacturing employment fell -154,000 and -177,000, respectively.
Since the 2022 peak, -403,000 jobs have been lost, bringing total manufacturing employment down to 12.483 million, the lowest since November 2021.
The sector has now lost HALF the number of jobs wiped out during the 2020 pandemic.
The US manufacturing sector is in recession.
It is difficult to undo the damage to the economy done by Biden and Chuck Schumer with their insane spending and open borders. Like pushing up housing prices to obscene levels under Clueless Joe.
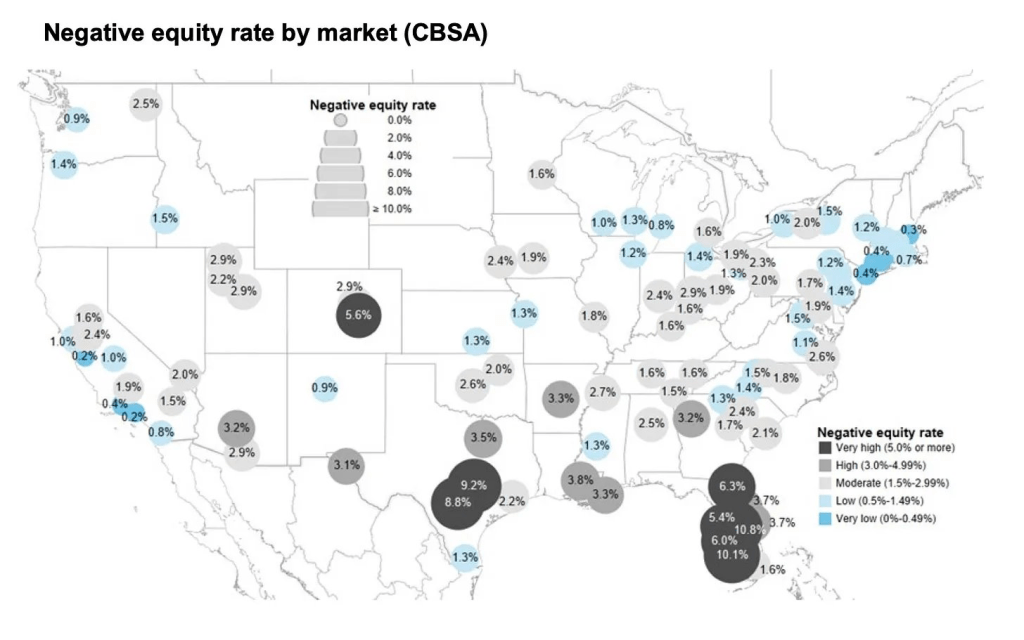
US Manufacturing Sector Shed -8k Jobs on January (Difficult To Undo Damage Done By Biden and Schumer Including Negative Home Equity).
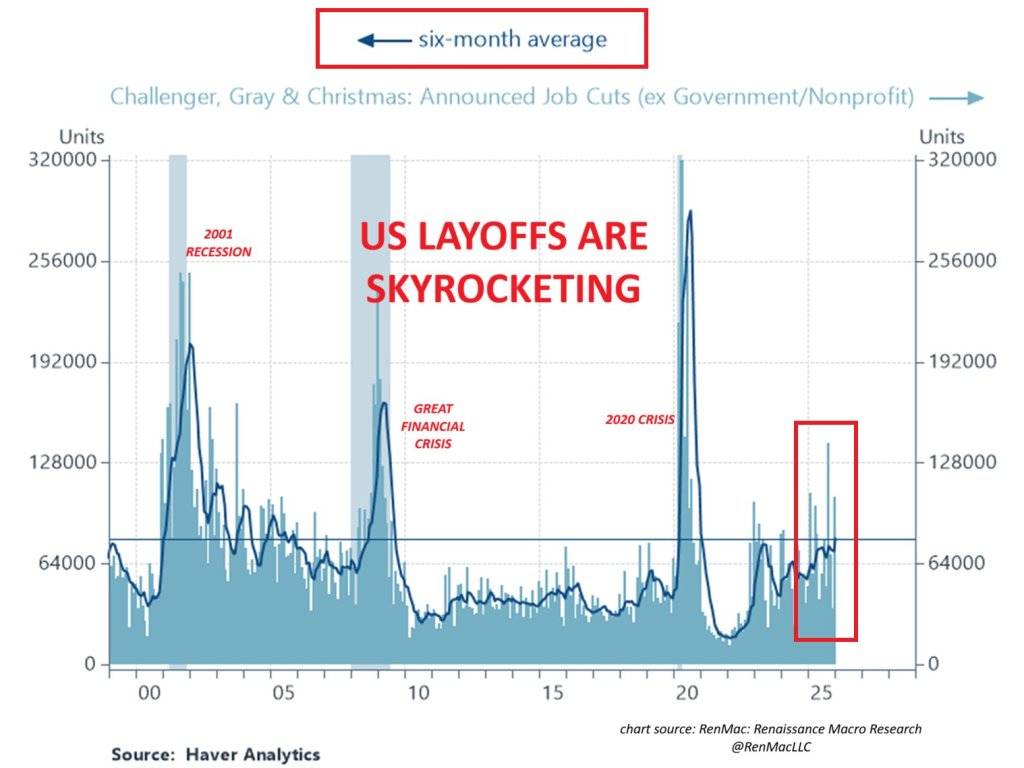
US layoffs are skyrocketing, largely due to the cost of providing Obamacare to employees. Easier to replace full-time workers with part-time and no healthcare benefits.
Sorry Bad Bunny, Your open border fantasies are a nightmare for law and order.
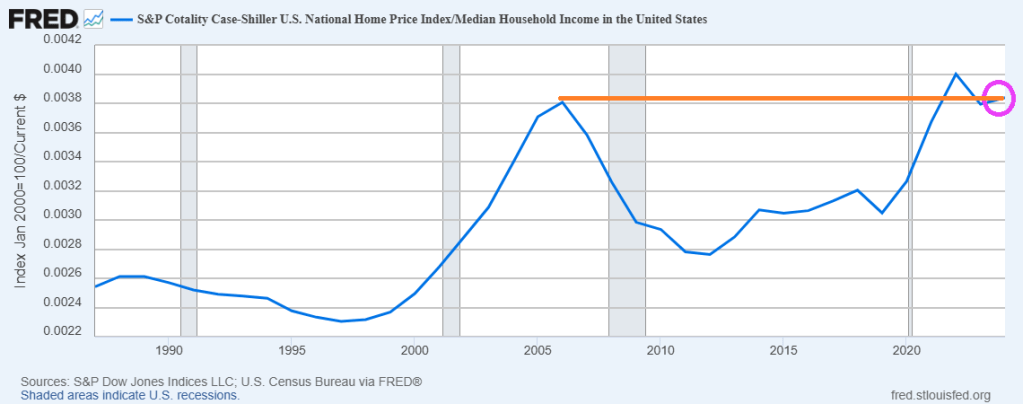
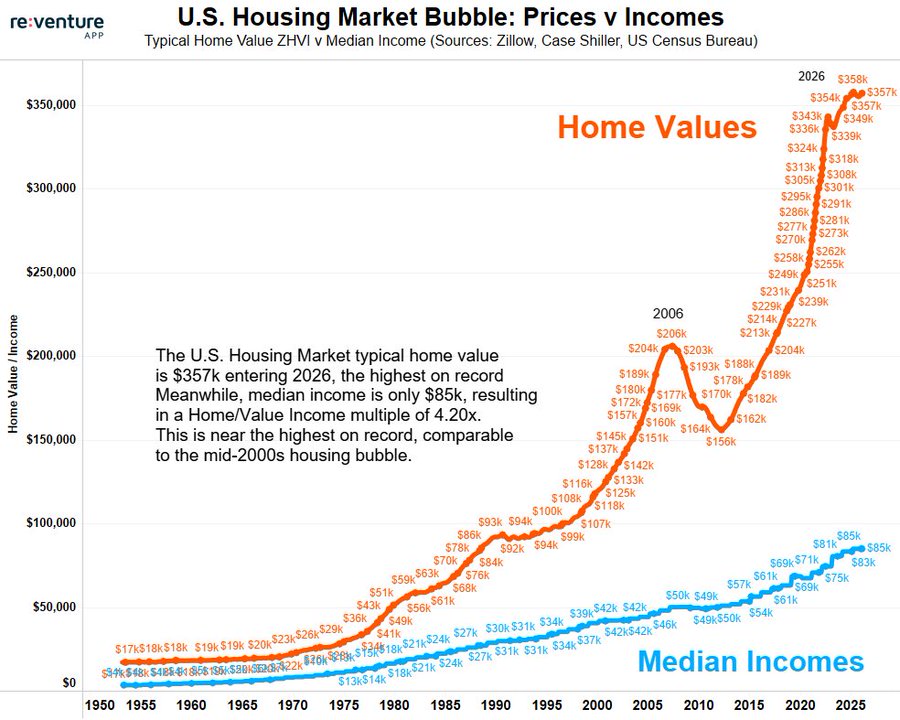
Yikes! The ratio of US Home Prices to US Median Household Income is now higher than the ratio during the catestrophic housing bubble during the latter half of the 2000s.
Here is a chart of home prices and median household incone,
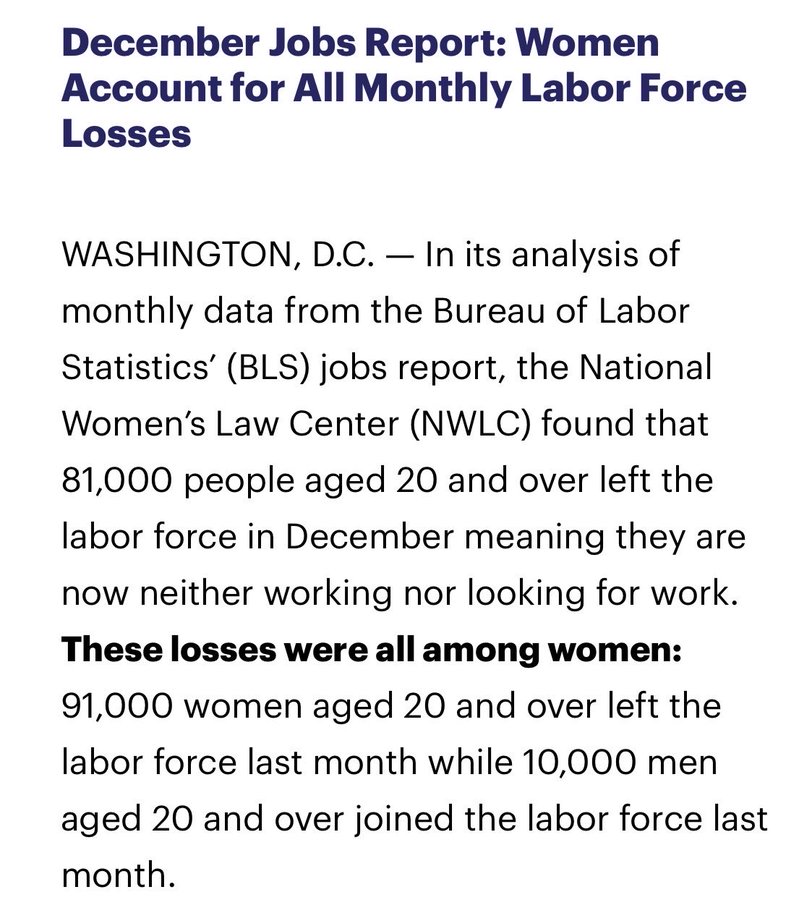
The labor market is truly screwed-up. The December jobs report reveals that women account for nearly all labor force losses.
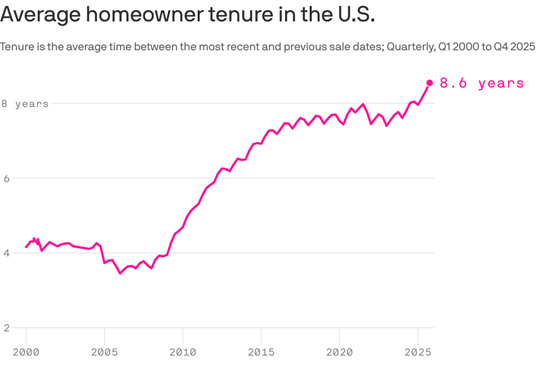
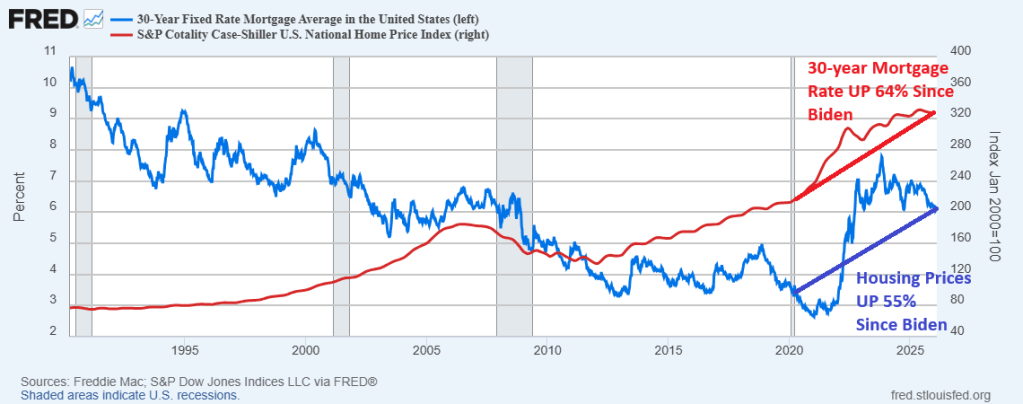
I ain’t drunk! But it would help in this housing market where housing prices and mortgage rates are much higher than when Joe Biden became President in January 2020. In fact, the Case-Shiller national home price index is 55% higher than when Sleepy Joe took the reins of Presidency and the 30-year mortgage rate is 64% higher.
Because of higher housing prices and mortgage rates,
The Case-Shiller national home price index is 55% higher than when Sleepy Joe took the reins of Presidency and the 30-year mortgage rate is 64% higher.
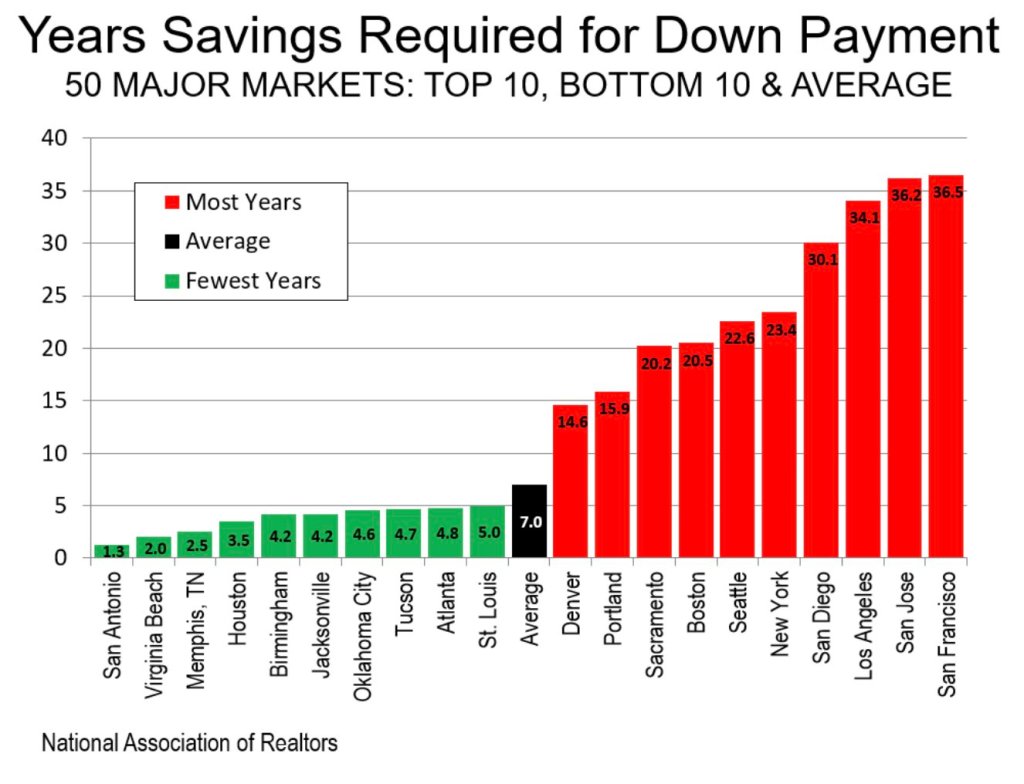
As a result of higher housing prices and mortgage rate (and Gavin Newsom’s ludicrous policies), it will take over 30 years to accumulate enough savings to buy a home in San Diego, Los Angeles, San Jose and San Francisco.
I ain’t drunk, but first-time homebuyers will need to be drunk in this housing market.
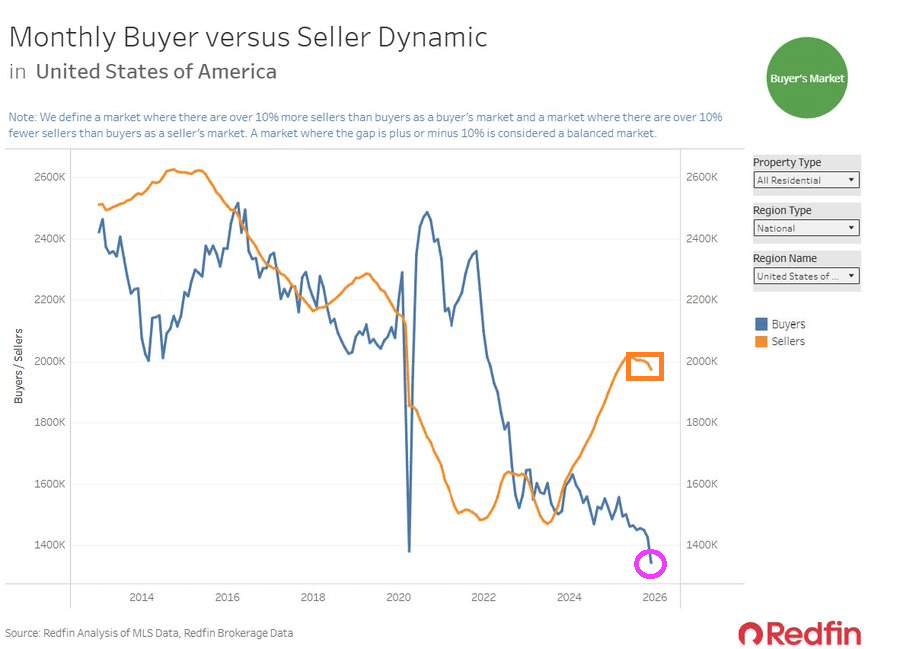
According to Redfin, US pending home sales fell to the lowest since the Covid epidemic of 2020.
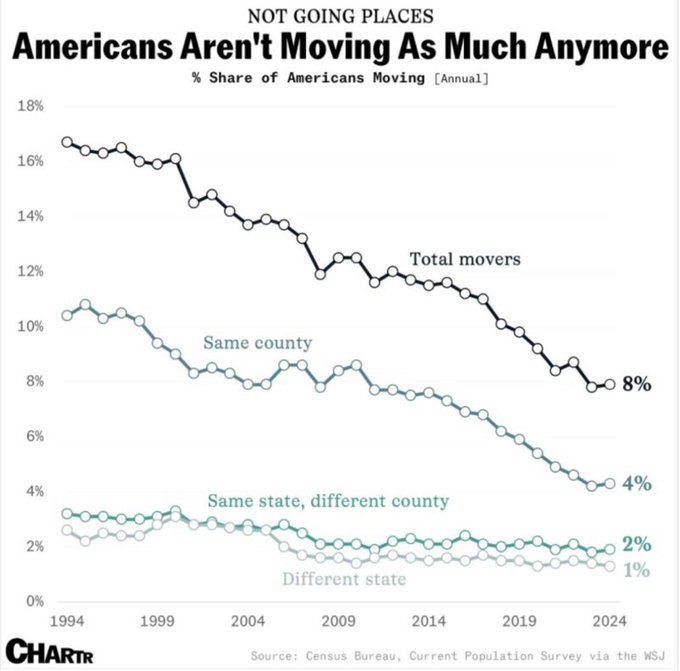
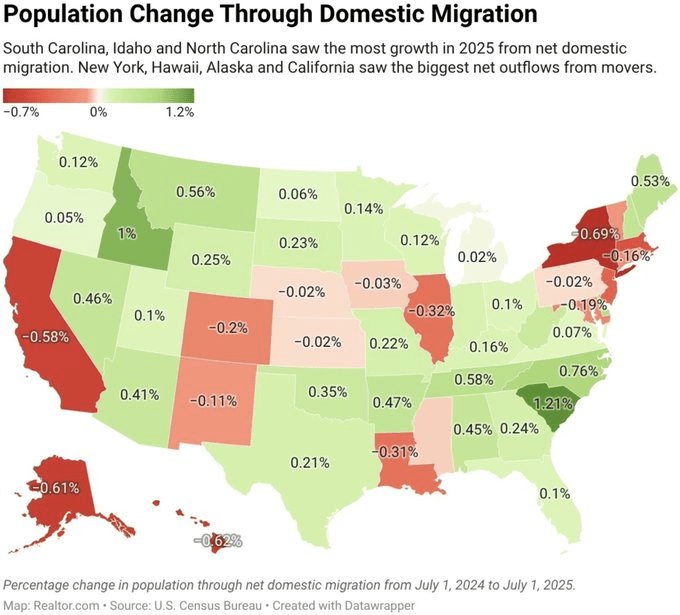
With the population change from state to state, like New York, California and Illinous to South Carolina and Idaho (home of Napolean Dynamite), it is no wonder that the housing market is in a state of turmoil.


You must be logged in to post a comment.