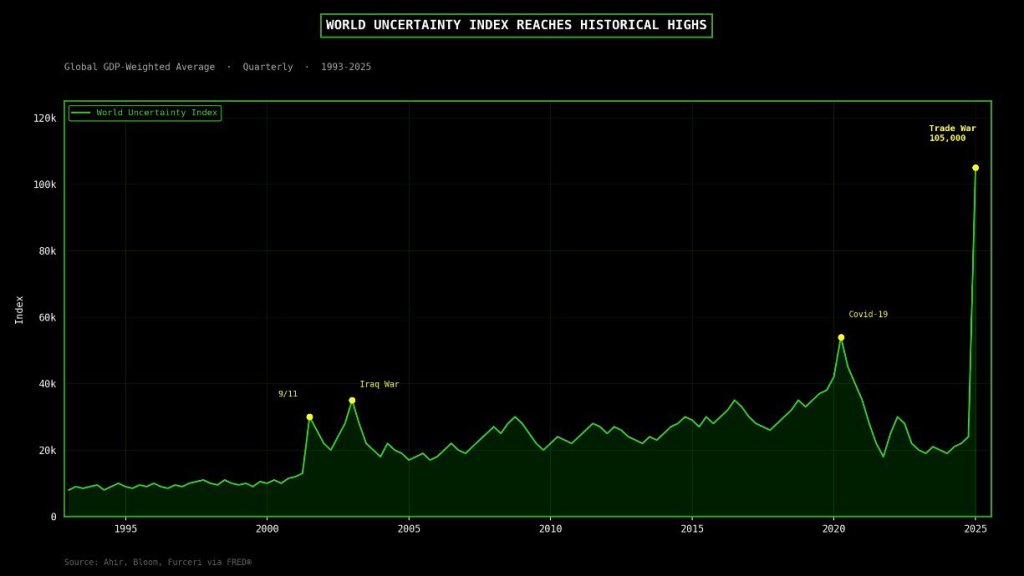
Global uncertainty hits an ALL-TIME HIGH.
Higher than Covid, the 2008 financial crisis, and the dot-com crash COMBINED.
You know what that means!

Confounded Interest – Anthony B. Sanders
Financial Markets And Real Estate
Global uncertainty hits an ALL-TIME HIGH.
Higher than Covid, the 2008 financial crisis, and the dot-com crash COMBINED.
You know what that means!
Trump has been President for 1 year and fighting against Biden and the Democrats economic misery.
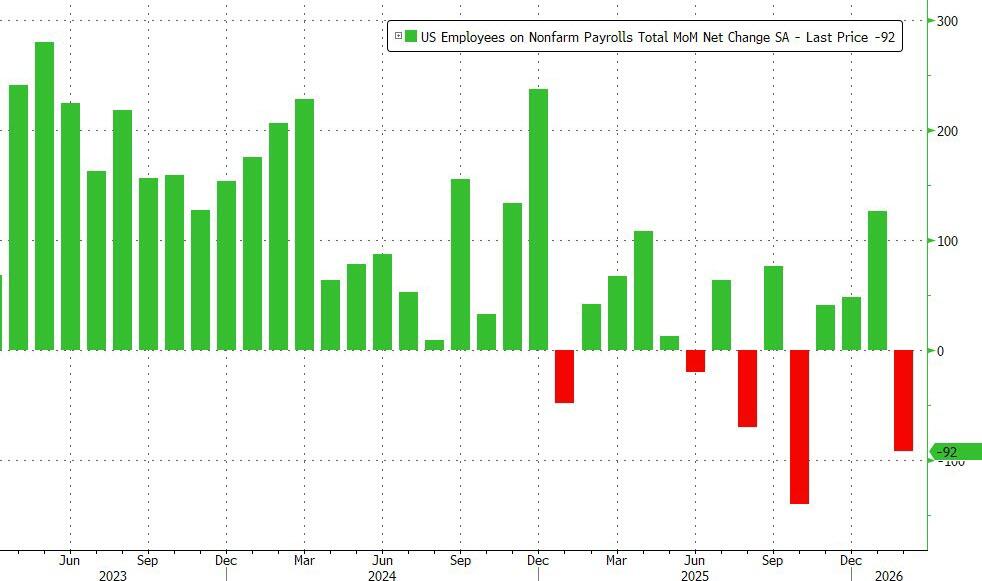
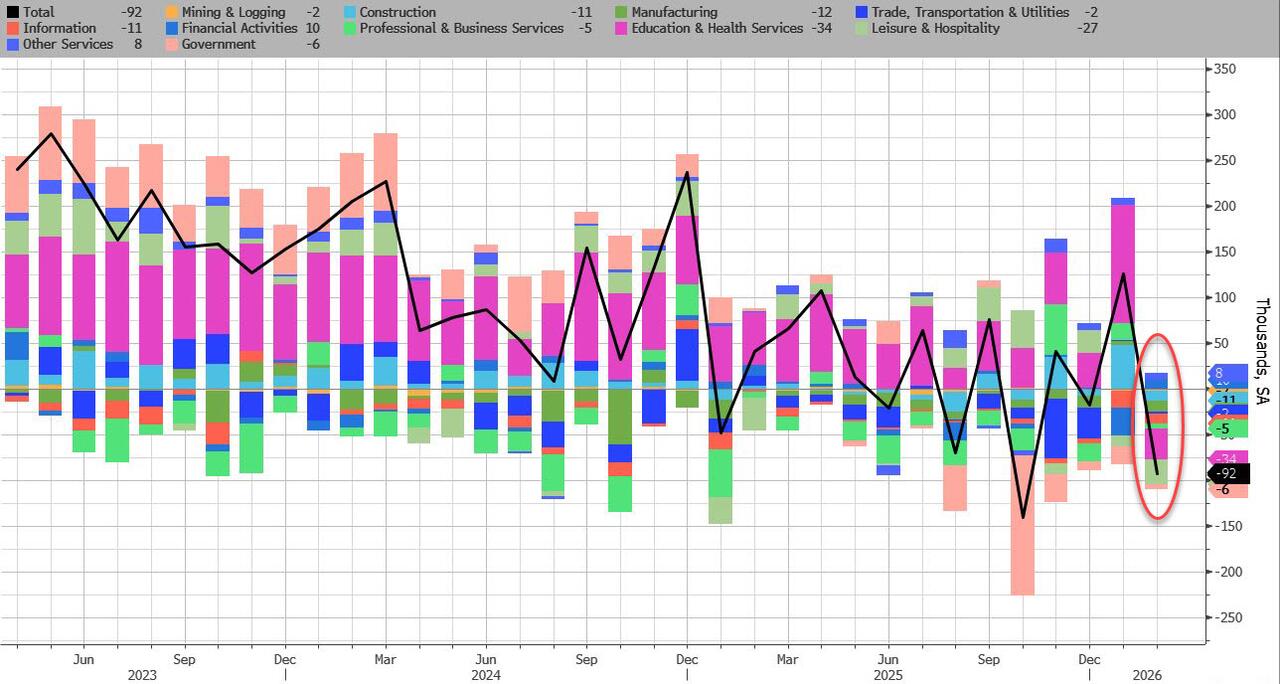
In February, the US lost 92,000 jobs, a huge drop from the downward revised 126K in January, and the second worst print since 2020 (only October’s shock -140K was worse), and this time, the massive drop can’t be dismissed as a one-time drop in government payrolls. The number of private payrolls dropped by 86K, also a huge miss to estimates of a 60K increase.
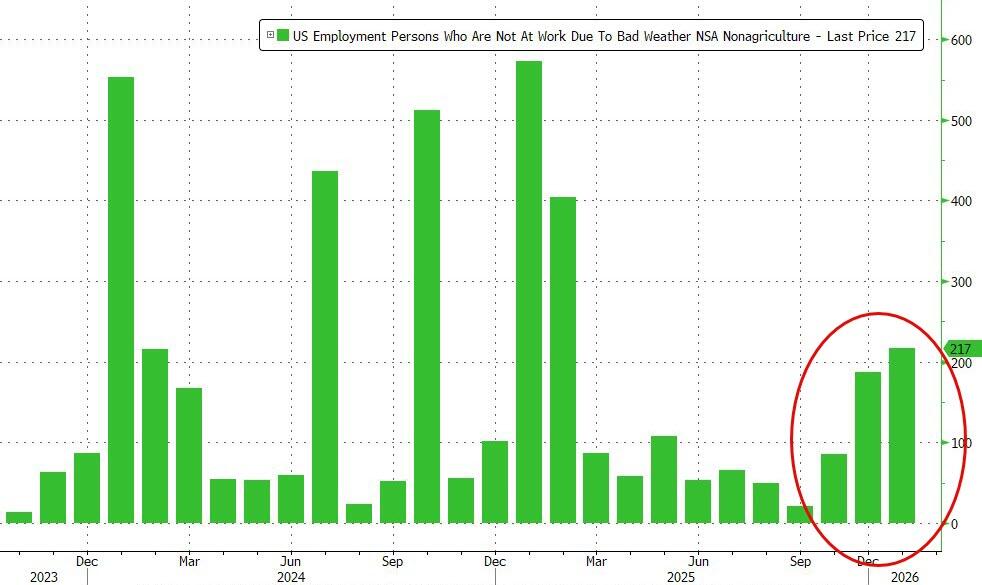
One potential mitigating factor: the number of people who were unable to work due to weather surged to 228K in February, well above last year’s level 167K, due to the powerful winter storms hitting the US.
Turning to the establishment survey, which unveiled the shocking February drop, the BLS reported a broad-based decline, driven by striking employment workers:
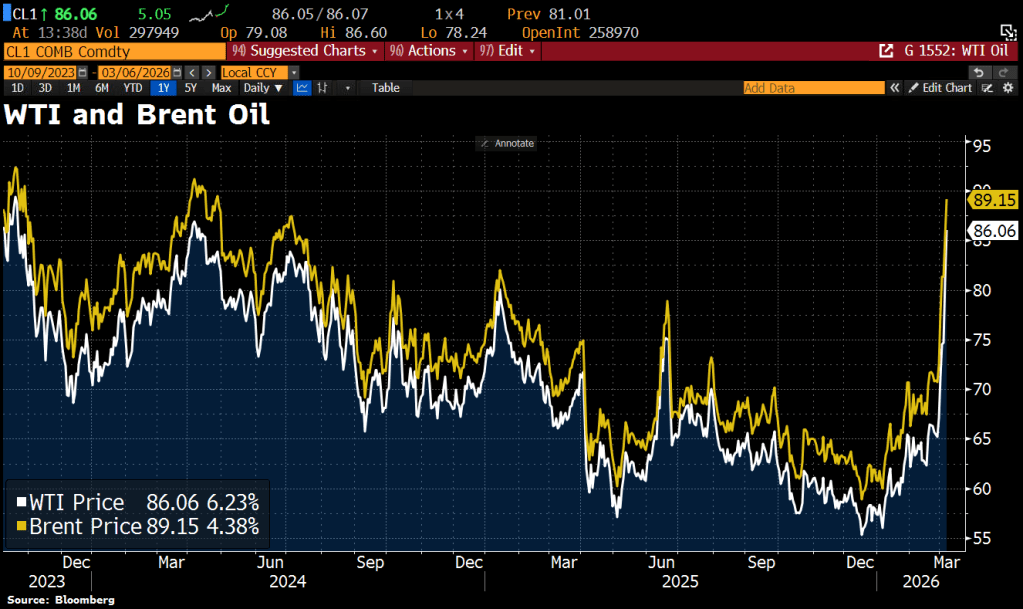
Switching to oil, we see the West Texas Intermediate and Brent Oil prices soaring on the attacks on Iran.
To soothe you.

People are staying in their homes longer now than in 2006. 12 years now versus 6.5 years in 2006.
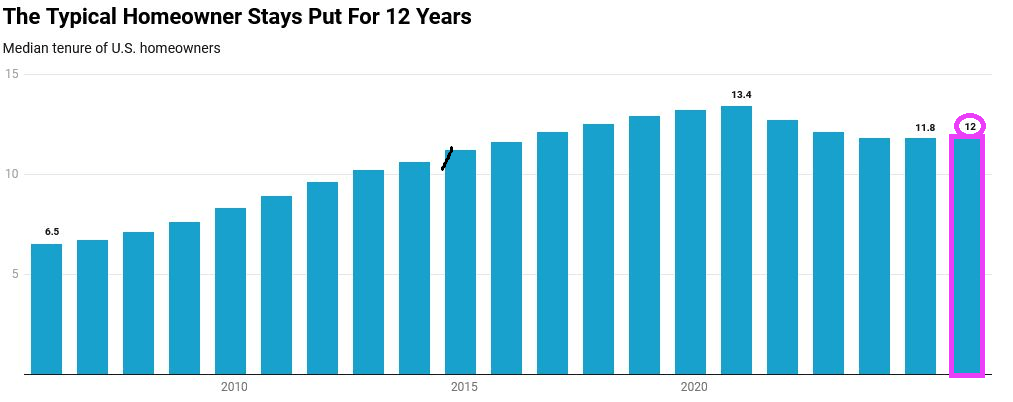
The average effective mortgage life is 5-7 years,
12 years in the same home makes housing policy more difficult to implement.
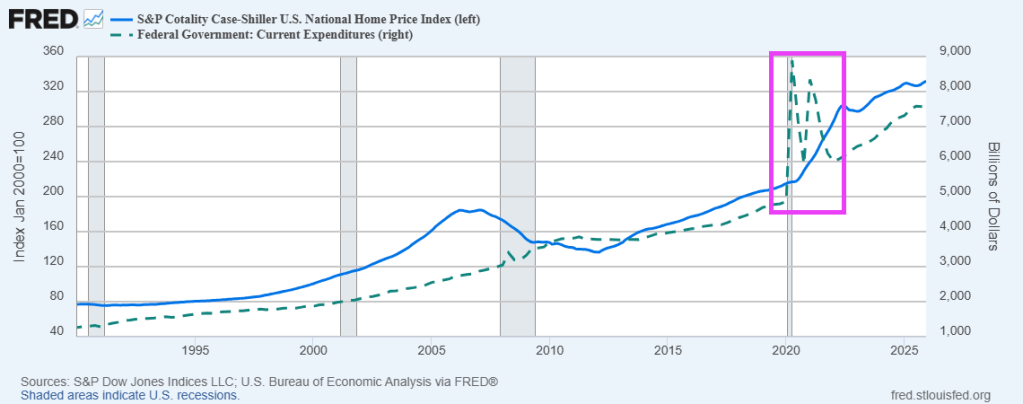
We are seeing the aftermath of the Federal government’s fiscal response to the Covid outbreak of 2020. Home prices exploded following The Federal government’s spending spree. The end result? US housing is simply unaffordable for millions of households.
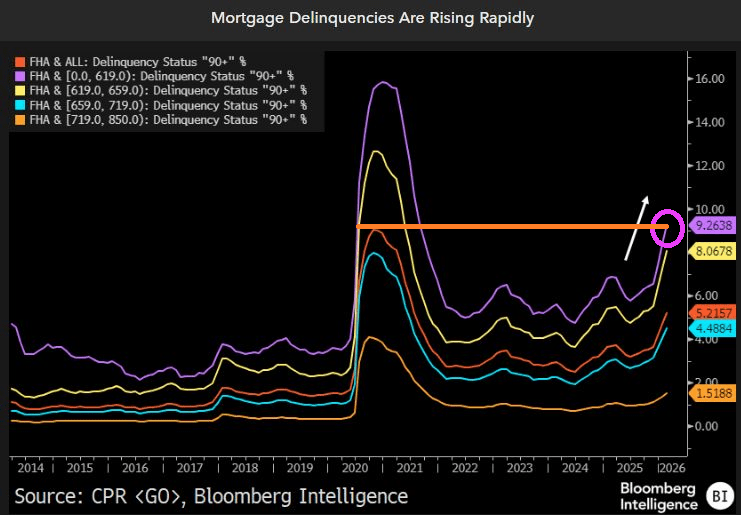
Not really surprising given the soaring home prices following the Covid Federal spending spree.
I called this inflation power!
Underlying U.S. inflation increased more than expected in December, and signs are pointing to a further acceleration in January, which would strengthen expectations that the Federal Reserve would not cut interest rates before June.
The personal consumption expenditures price index, excluding the volatile food and energy components, rose 0.4% after an unrevised 0.2% gain in November, the Commerce Department’s Bureau of Economic Analysis said on Friday. In the 12 months through December, core PCE inflation advanced 3.0% after increasing 2.8% in November.
The PCE price index increased 0.4% in December after rising 0.2% in November. PCE inflation increased 2.9% year-on-year after gaining 2.8% in November.
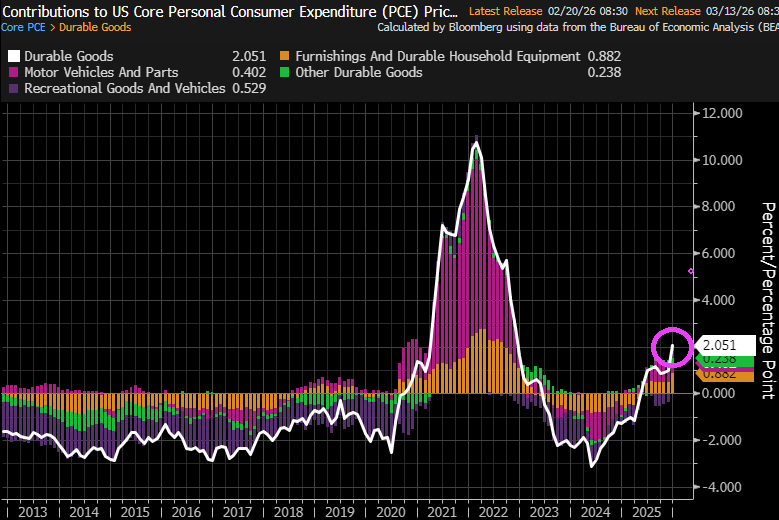
But in terms of contributions to the 0.4% figure is that durable goods rose 2.051%.
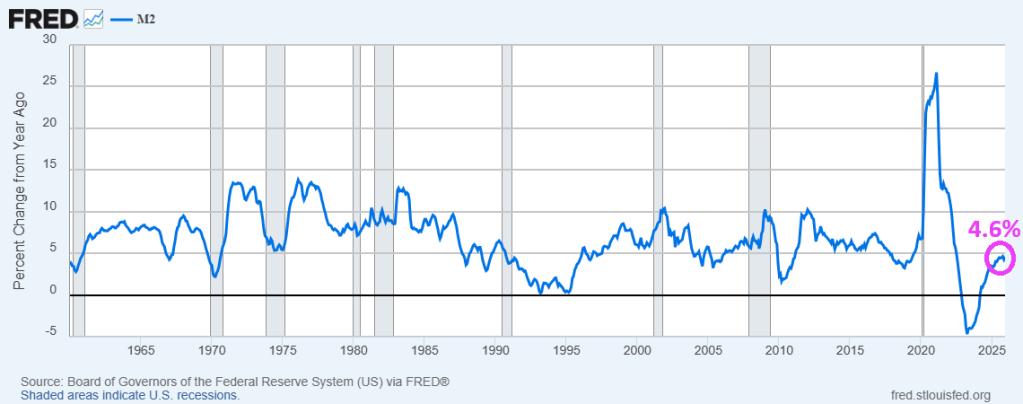
The Fed has been printing money (M2) like there is no tomorrow. With M2 growing at 4.6% YoY in December.

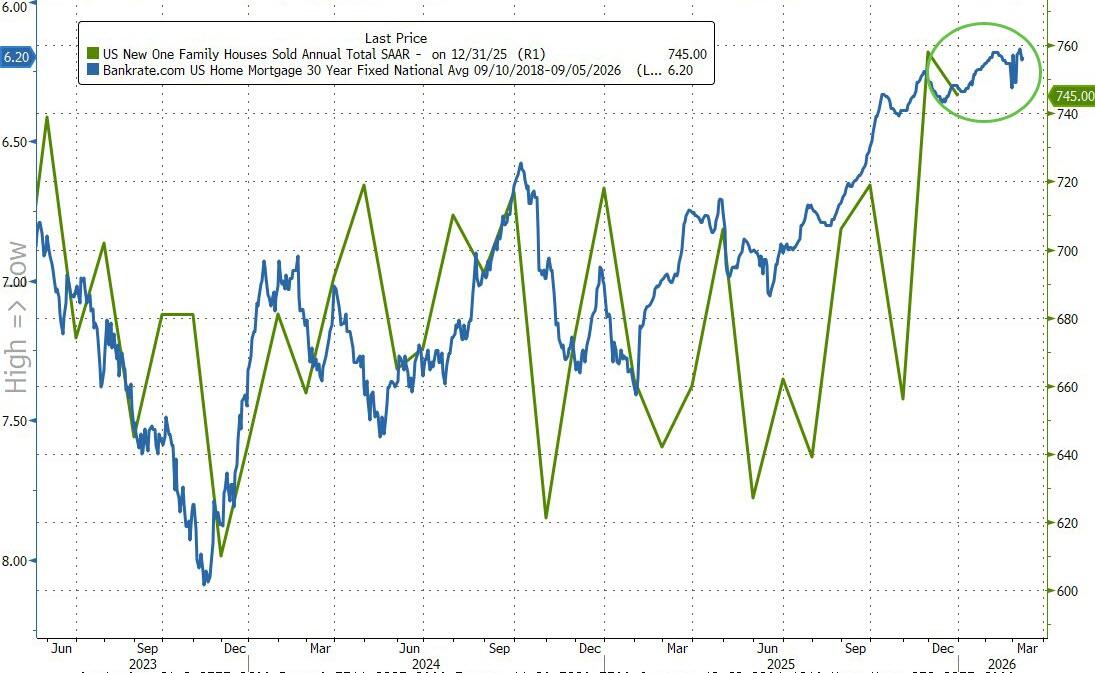
US New Home Sales dipped 1.7% MoM in December (after a 15.5% MoM surge in November)…
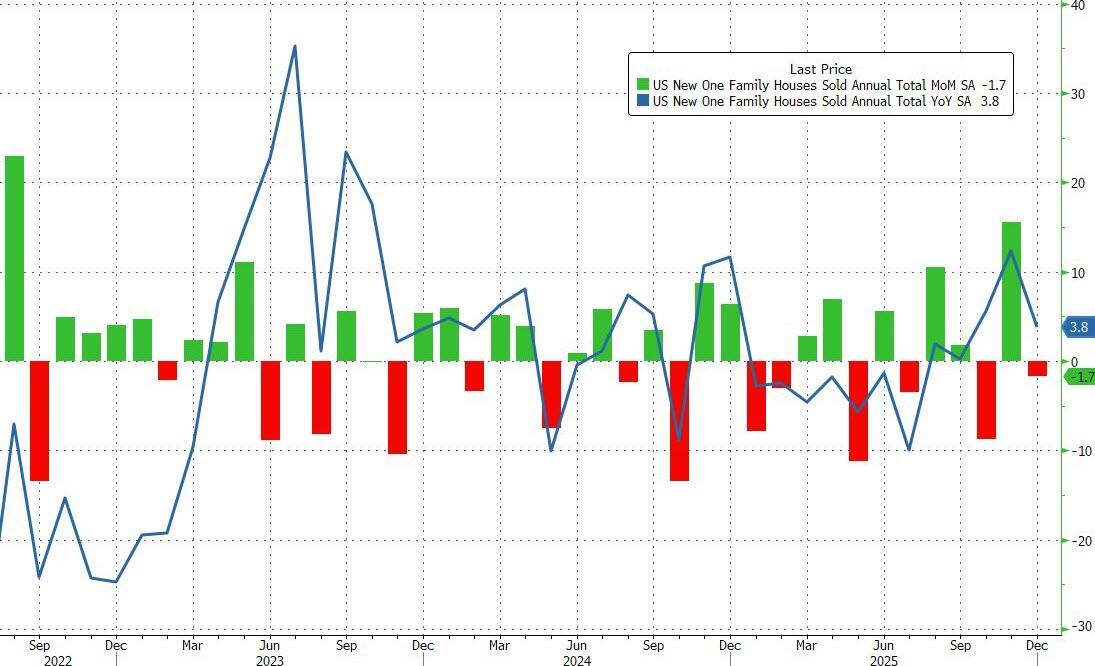
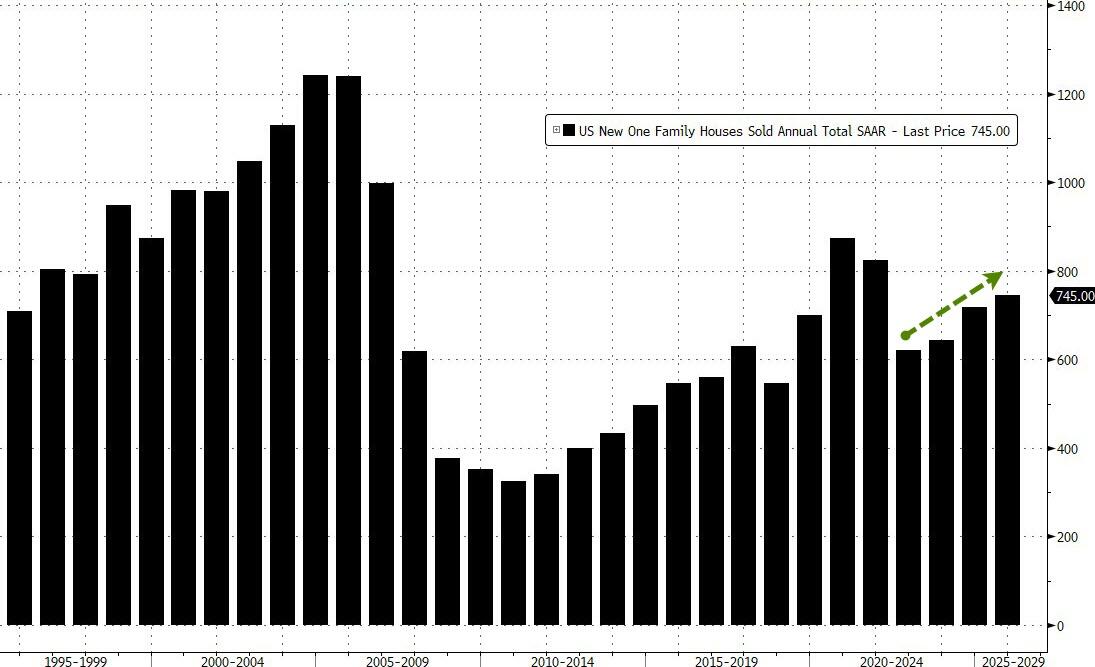
…but ended the year at 745k – the highest SAAR since 2021…
“New” home sales have notably decoupled from “used” home sales in the last few years as homebuilders incentivize buyers (reducing margins) and lower prices (reducing revenues)…
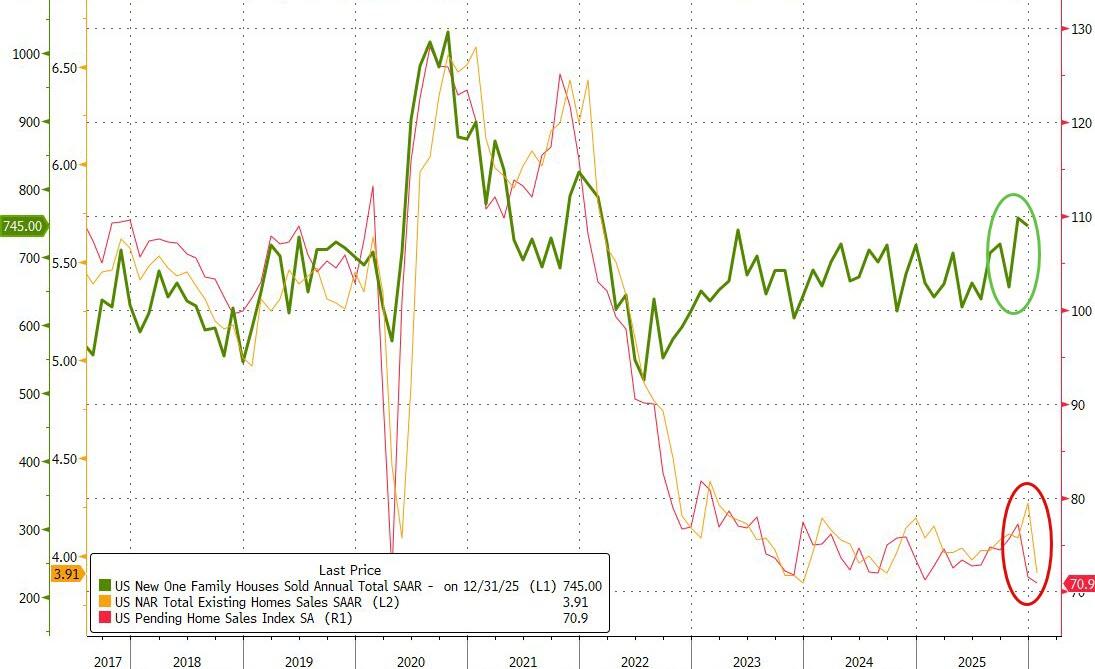
Lower mortgage rates support modest further improvements in sales…
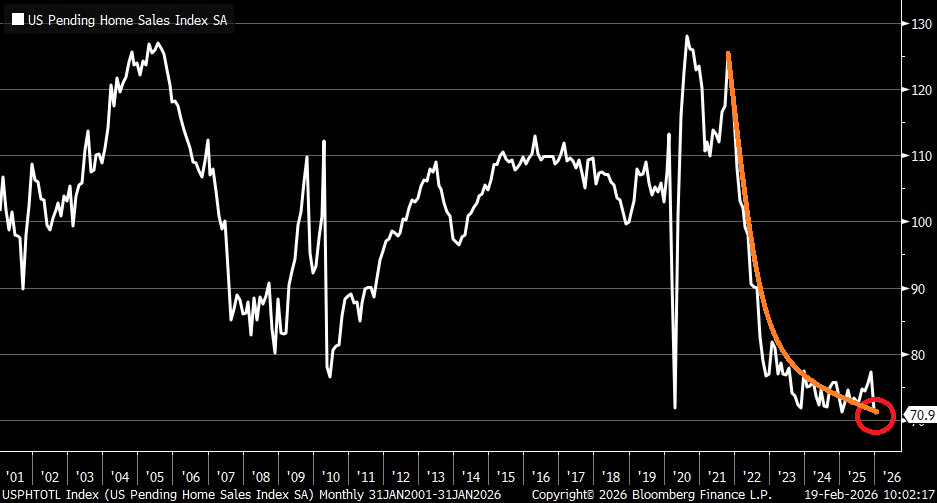
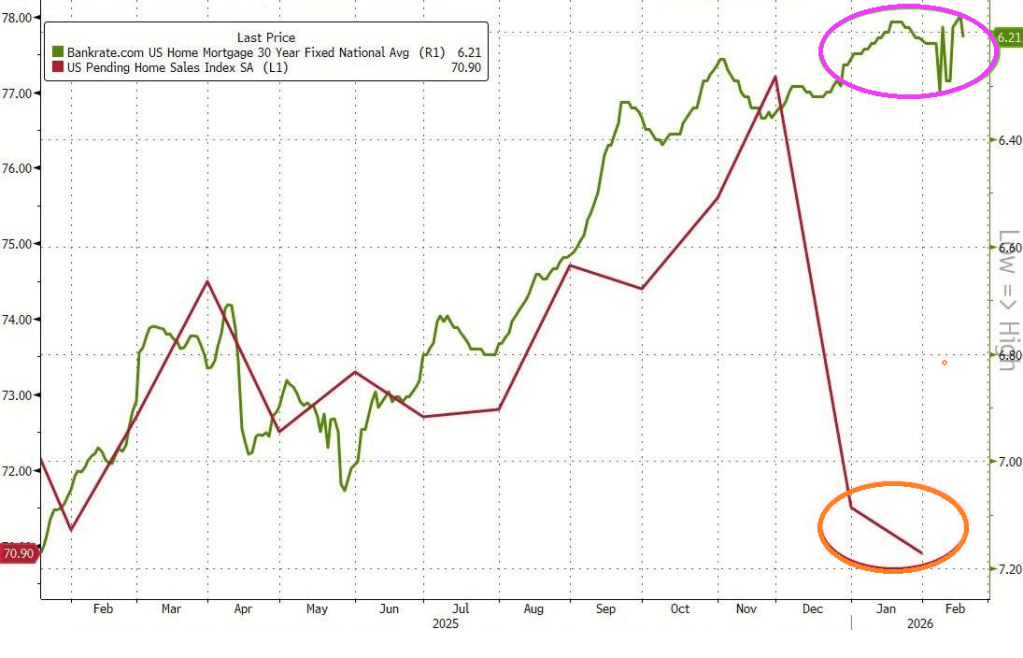
Unfortunately, US pending home sales have collapsed to the lowest level since at least 2001. Nothing has been the same since Biden/Harris administration.
Mortgage rates are still too high by historic standards.
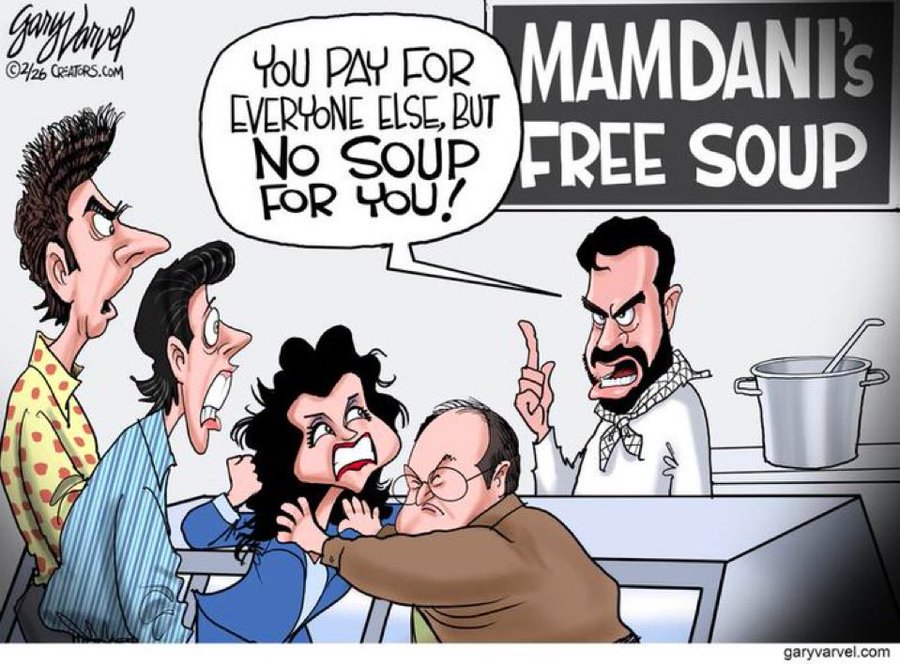
Speaking of Democrats running the economy, New York’s mayor Zoran Mandami (the Ugandan Communist) is seeking to raise property taxes to 9.5% which will hit EVERY New Yorker, not just the billionaires he allegedly wants to tax.
Rate-cut expectations have surged (dovishly) higher this week (along with tumbling Treasury yields) amid a mixed macro picture (Labor market ‘good’, Retail sales bad, Housing ugly).
Today could change all that as CPI for January prints with risk skewed to the upside. January brings annual resets and they tend to surprise on the high side.
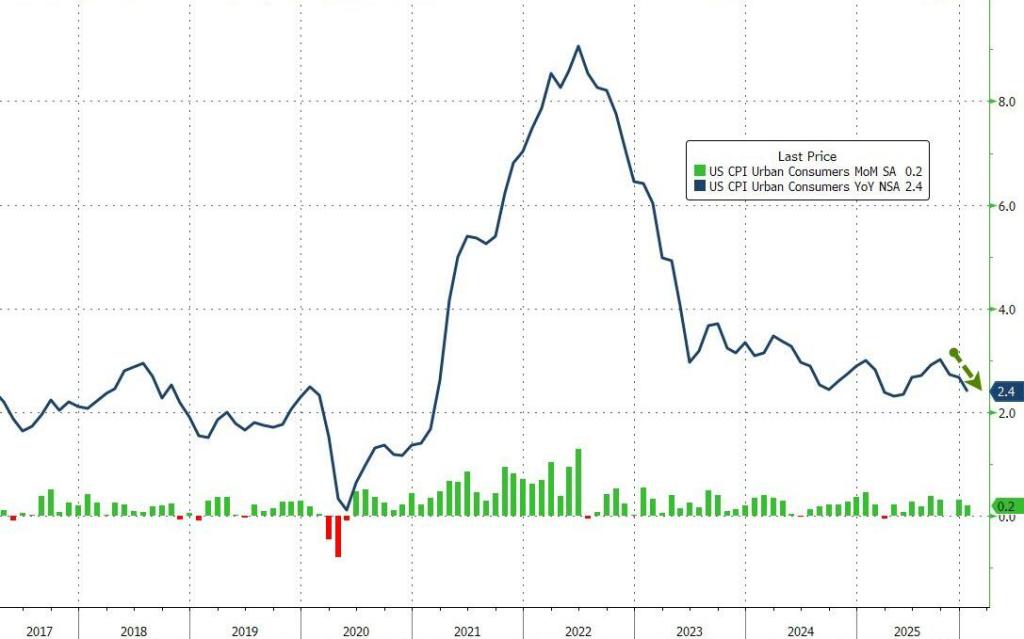
Despite the ‘hot’ whisper numbers (and 4 previous Januarys in a row of upside surprises), headline consumer price inflation came in cooler than expected in January (+0.2% MoM vs +0.3% expected). That pulled the headline CPI down dramatically from +2.7% to +2.4% – near the lowest in 4 years.
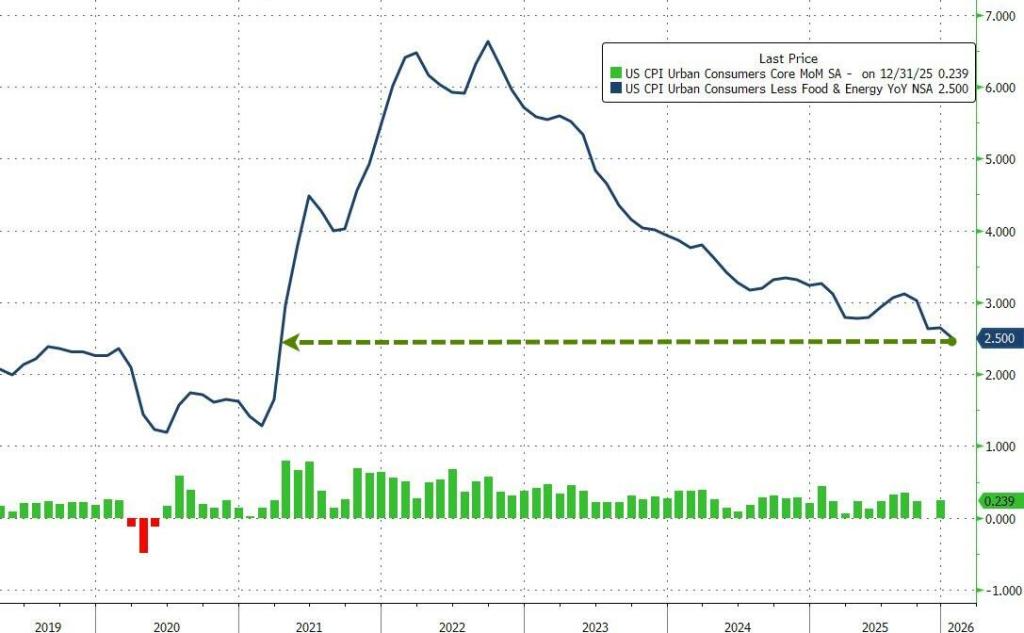
Core CPI printed +0.3% MoM (in line with expectations), lowering the YoY change in core prices to +2.5% – the lowest since March 2021.
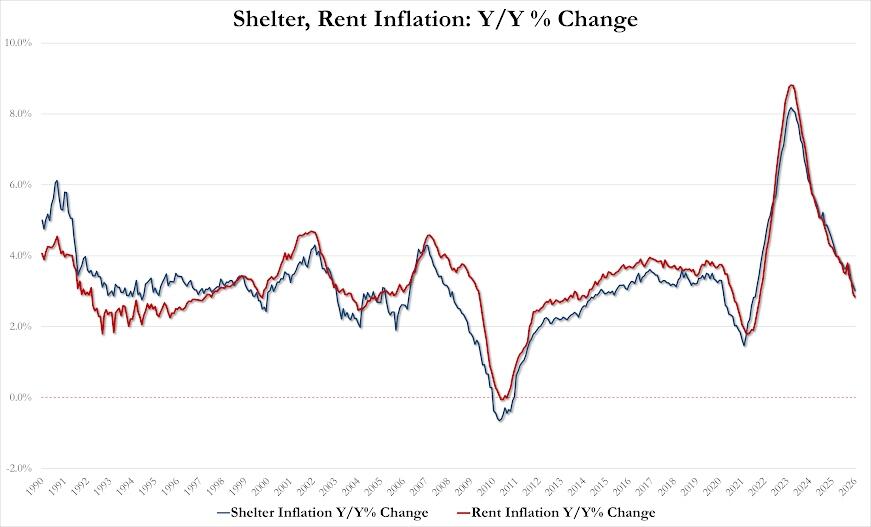
The Shelter index rose 0.2% in January and was the largest factor in the all items monthly increase. The food index increased 0.2% over the month as did the food at home index, while the food away from home index rose 0.1 percent. These increases were partially offset by the index for energy, which fell 1.5% in January.
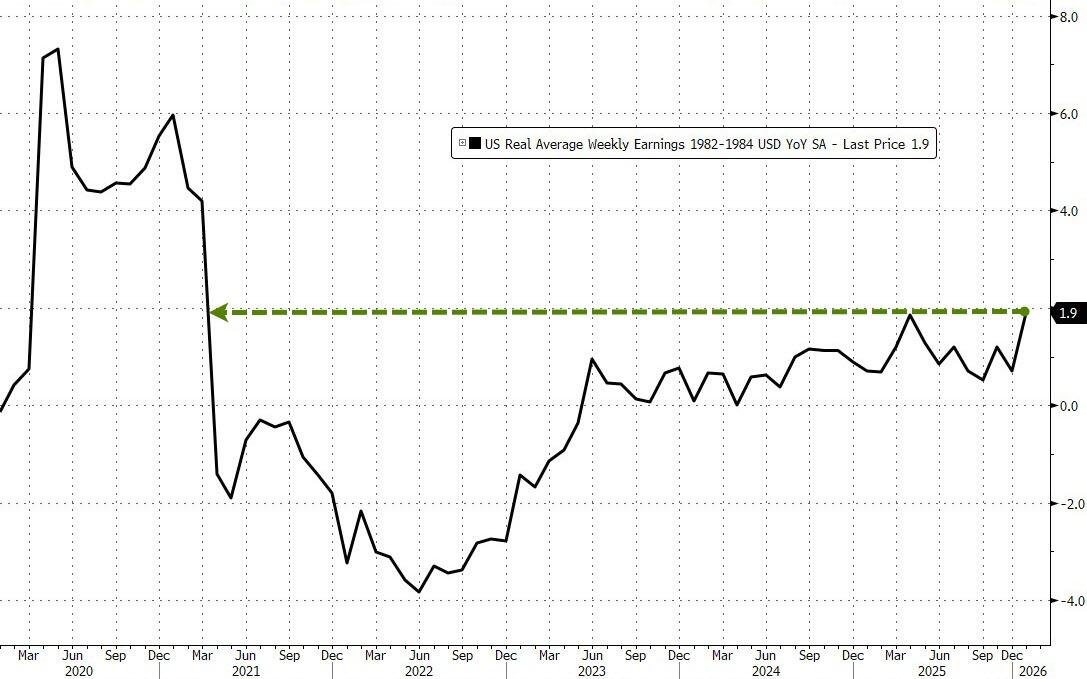
January saw real average weekly earnings rise 1.9% YoY – its highest since March 2021…
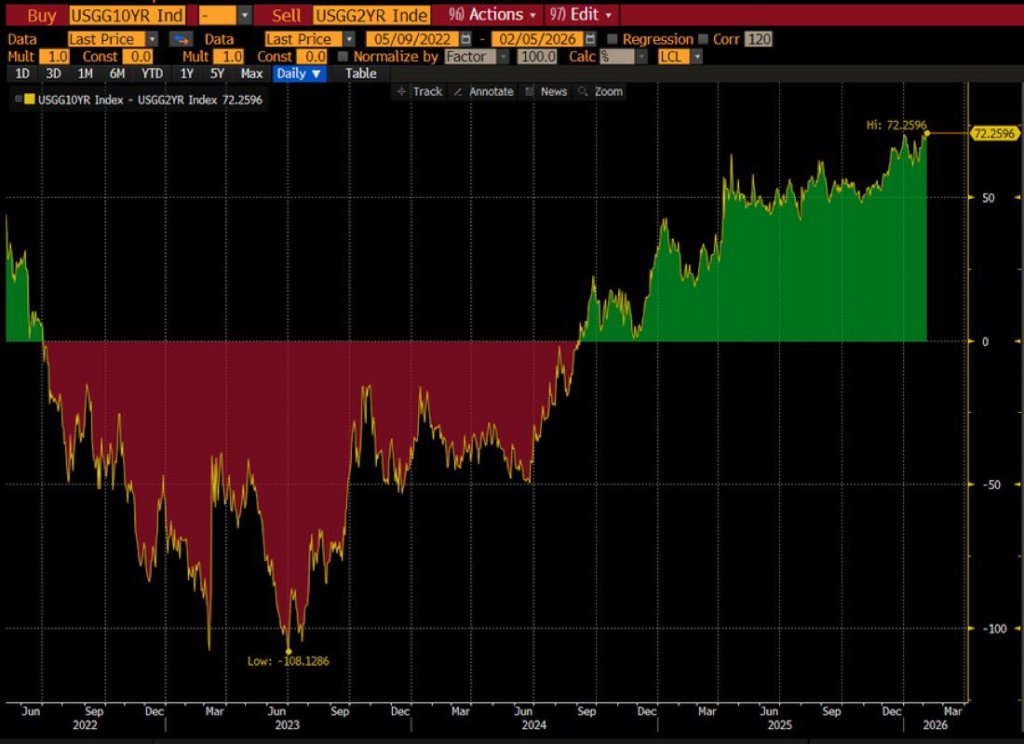
The gap between 2s and 10s Treasuies is now the widest it’s been since early 2022.
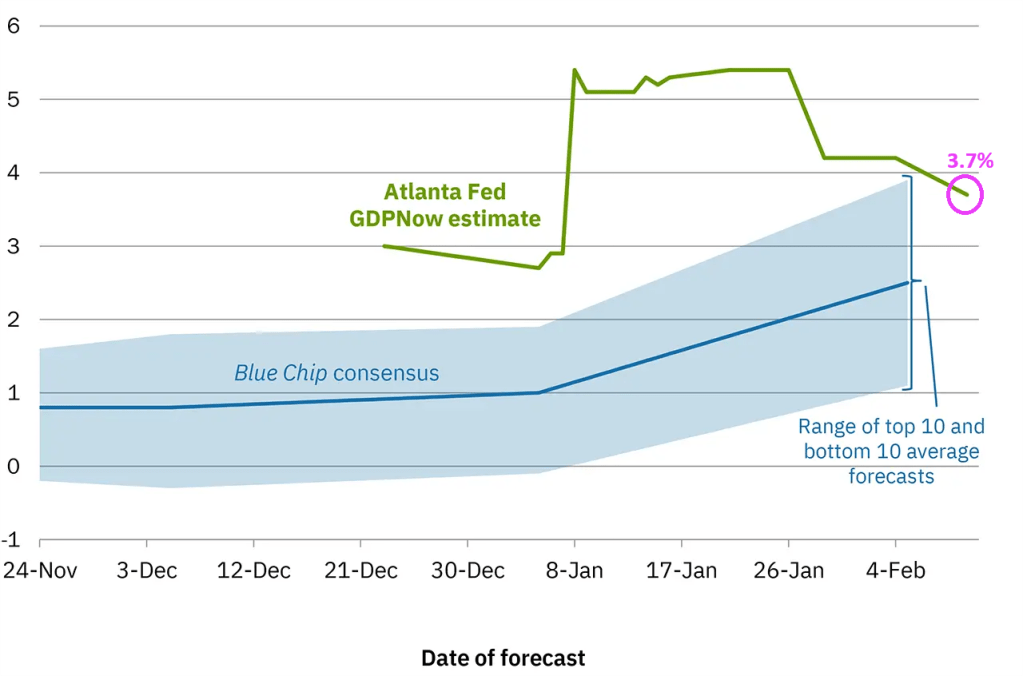
According to the Atlanta Fed GDP Now report, the current real GDP growth rate is 3.7%. But the yield curve is a forward looking measure.
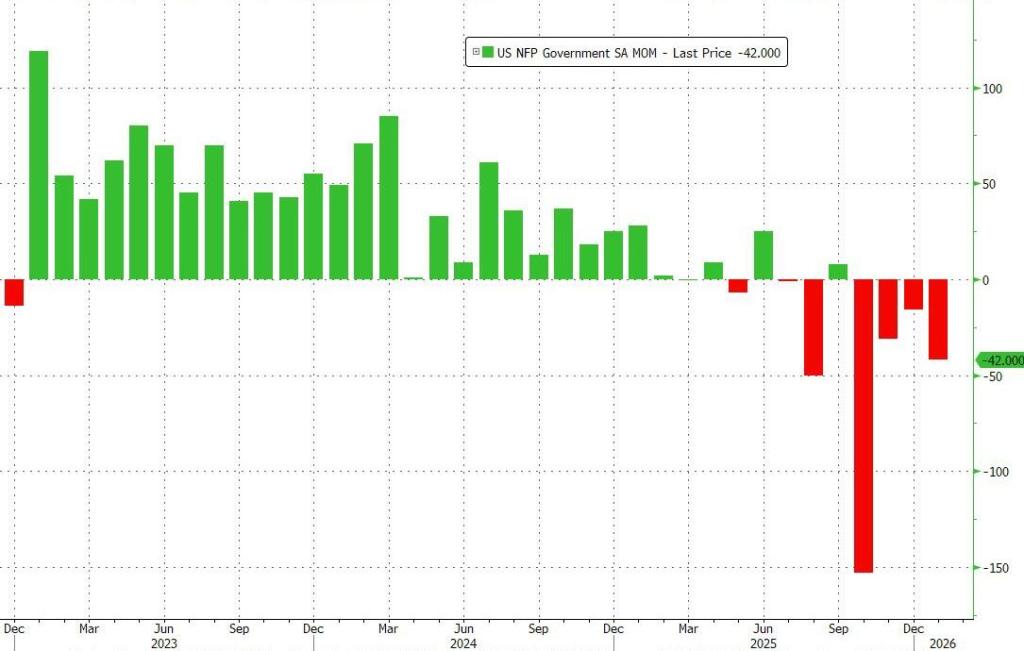
In January the US added 130K jobs, double the 65K median estimate and up from a downward revised December print of 48K (vs 50K previously). This was also the highest monthly jobs increase since December 2024.
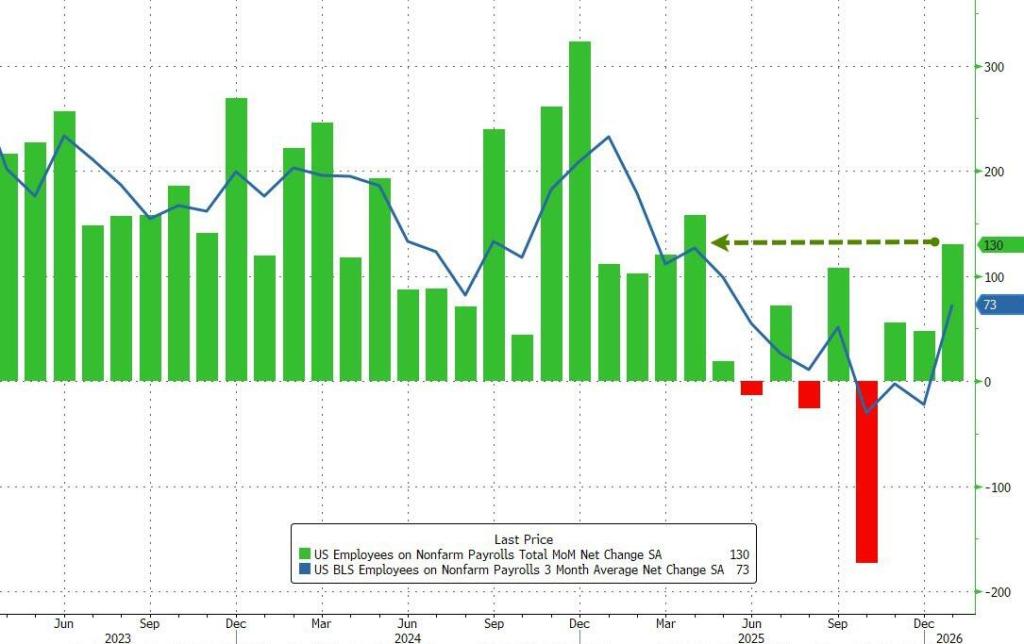
Government jobs fell by -42k. Furthering the trend for growing private sector employment and declining government employment.
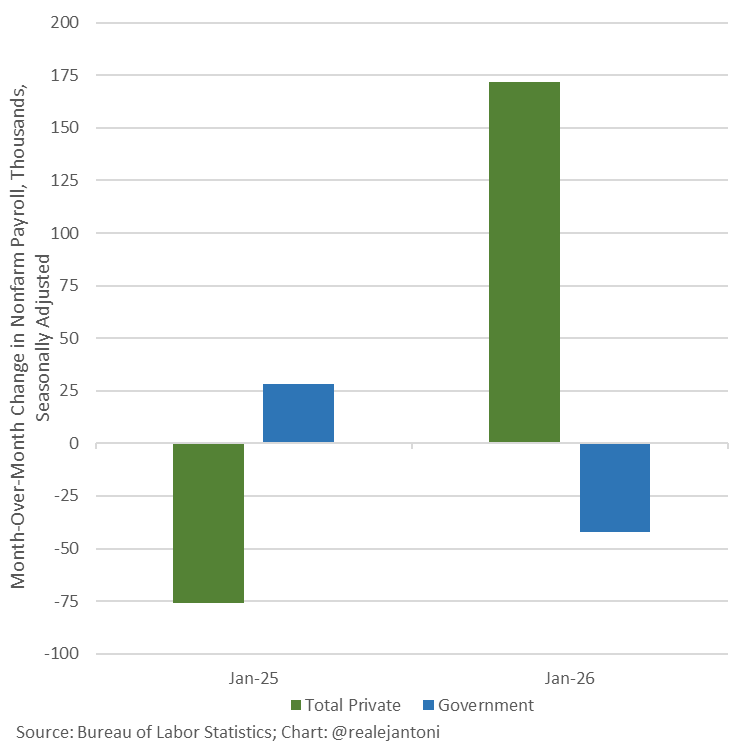
Compared to Jan 2025, we see the growth in private sector employment and decline in government jobs.
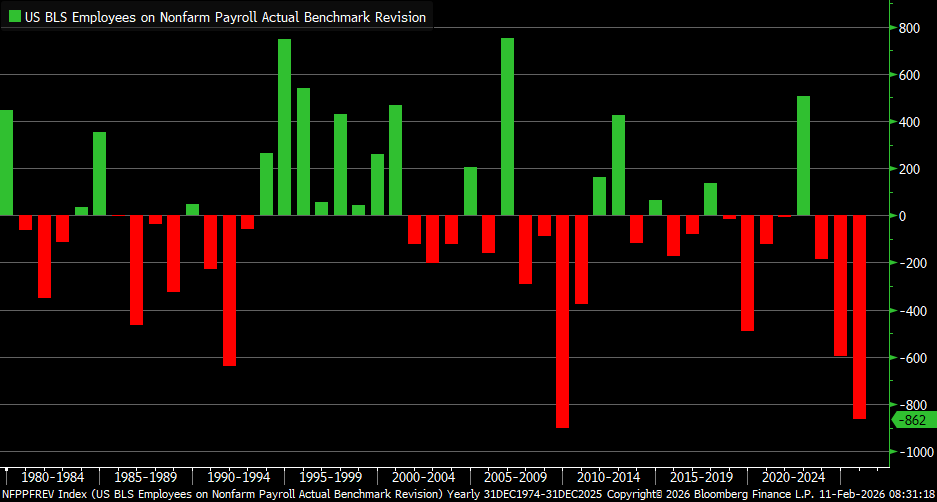
The jobs report comes with the largest jobs revision since 2009/2010.
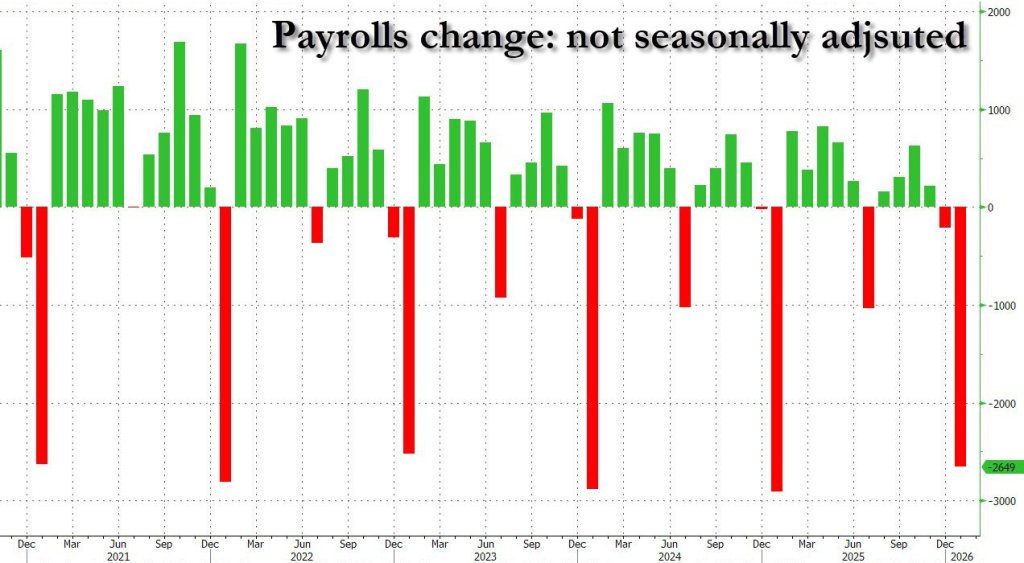
Now for the bad news, As my OSU/Chicago/GMU know, I prefer NON seasonally adjusted data when at all reasonable. While Seasonally adjusted jobs added SEASONALLY ADJUSTED was +130K, NOT seasonally adjusted jobs added was -2.649 Million.
Happy birthday to Tina Louis (Ginger from Gilligan’s Island) who turned 92 today.


You must be logged in to post a comment.