Housing market woes continue. All the day and all the night.
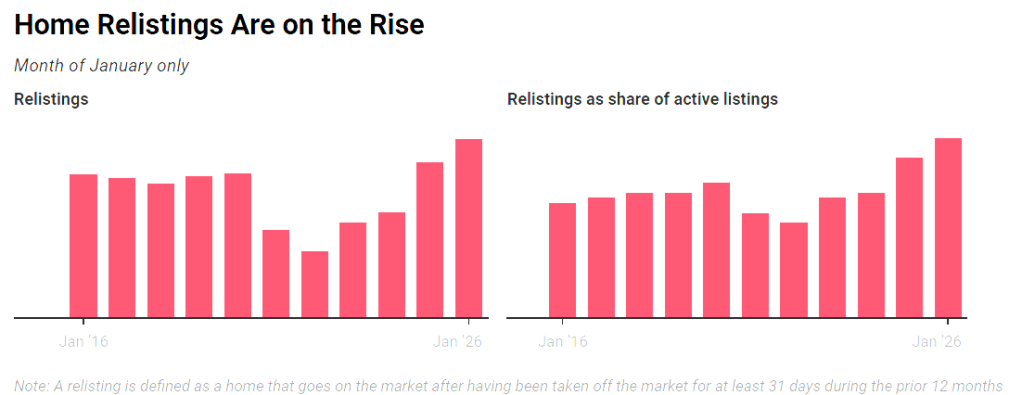
Delistings soared in 2025 after sellers began to outnumber buyers, and decided to take their homes off the market to take another bite at the apple this spring. Overall delistings hit a record high of 112,788 in December, while relistings this year represented 3.6% of all homes on the market.
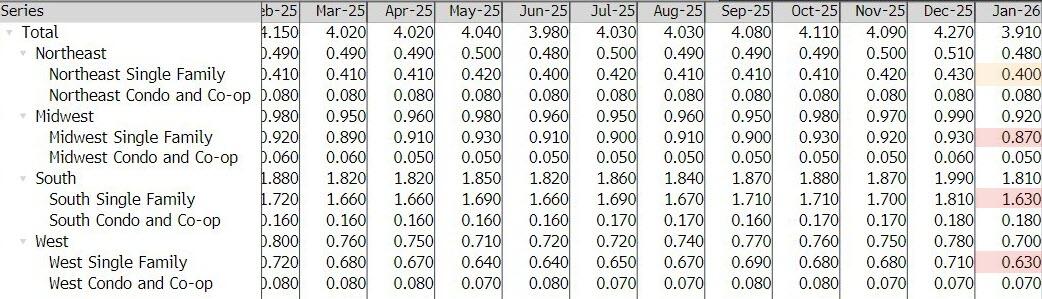
Supply gains have been concentrated in the South and West, particularly among homes priced under $500,000. While the Northeast and Midwest have seen some growth, they are still lagging behind the other regions.
As of February, active listings climbed by 7.9 percent year over year, reaching 914,860 homes across the nation for sale. A little more than 7 percent of those listings resulted in contract cancellations—down slightly from the same time in 2025.
An analysis of the country’s 50 largest markets showed sharp increases in inventory in Seattle, with a 38.5 percent hike, as well as Louisville, Kentucky, 27.3 percent higher, and San Jose, with nearly 25 percent more homes on the market.
On the other side, Hartford, Connecticut, experienced the deepest drop in inventory at over 82 percent, as well as Providence, Rhode Island, at 61.1 percent.
Overall, homes spent a median of 70 days on the market in February, four days longer than a year earlier.


You must be logged in to post a comment.