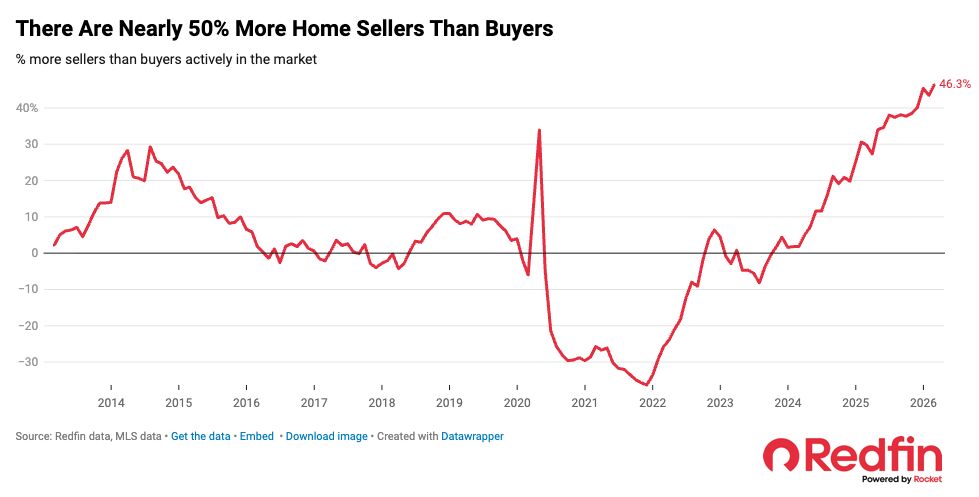
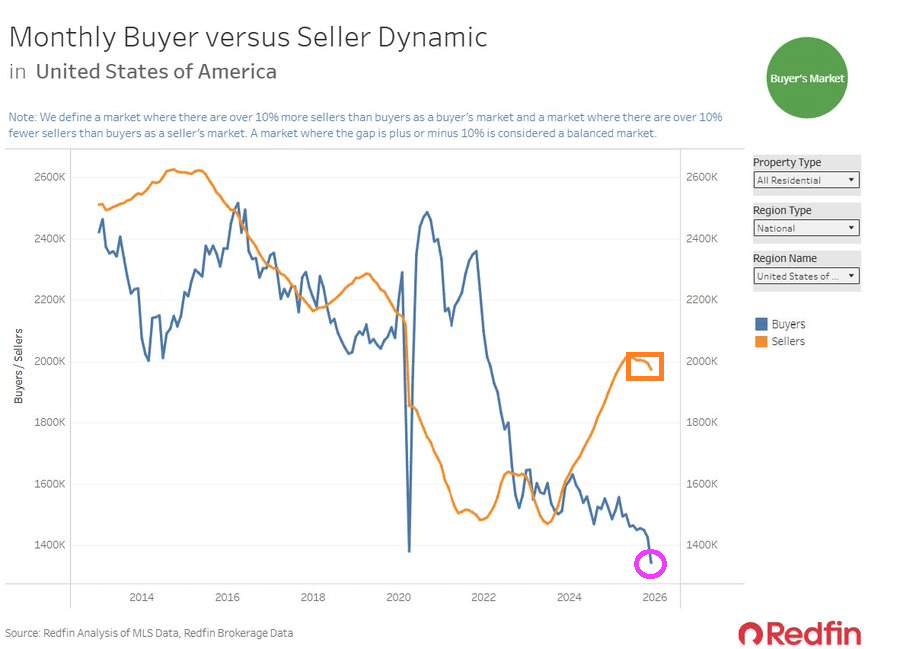
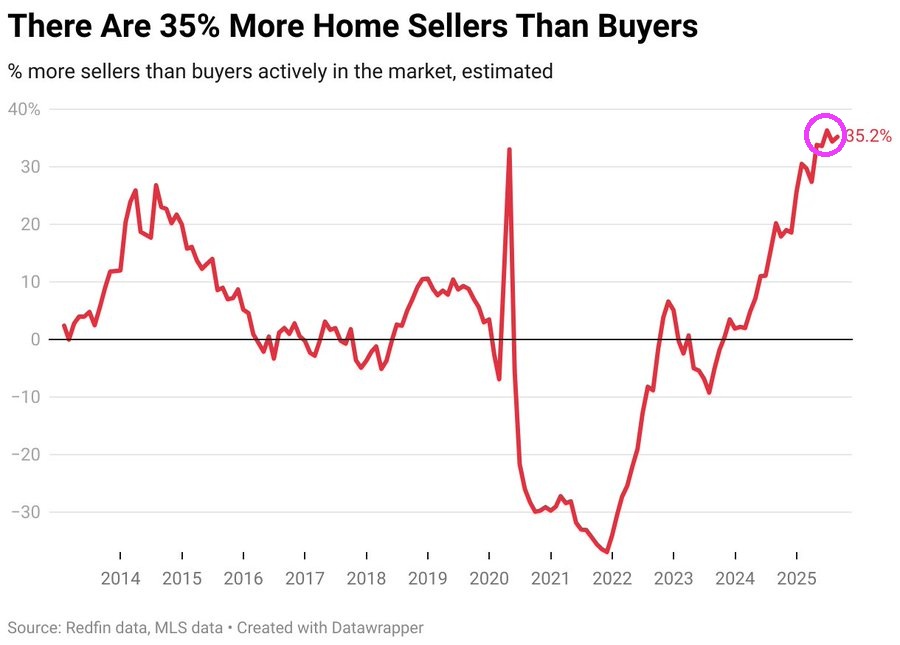
Nothing has been the same in the US housing market since the Covid outbreak of 2020. According to Redfin, there are nearly 50% more home sellers than buyers.
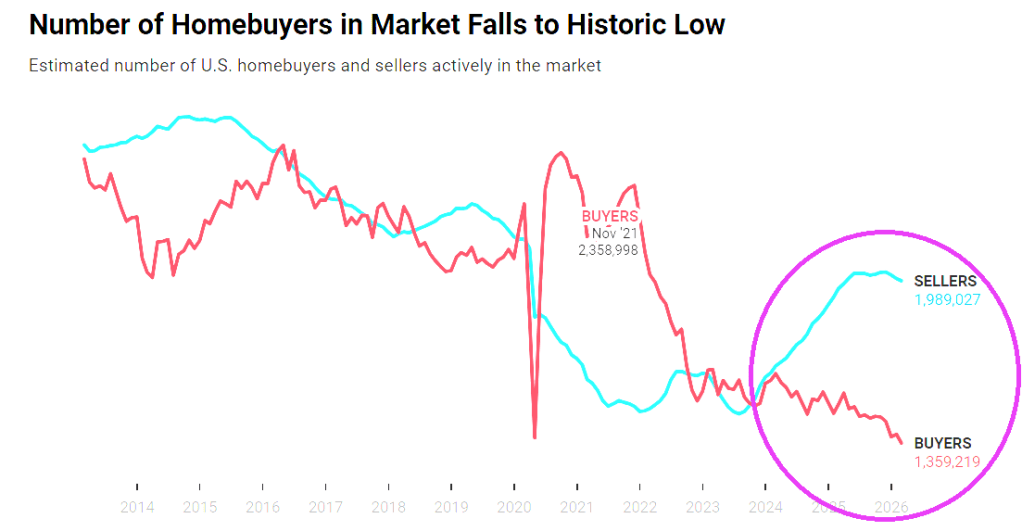
And the number of homebuyers has fallen to historic lows.
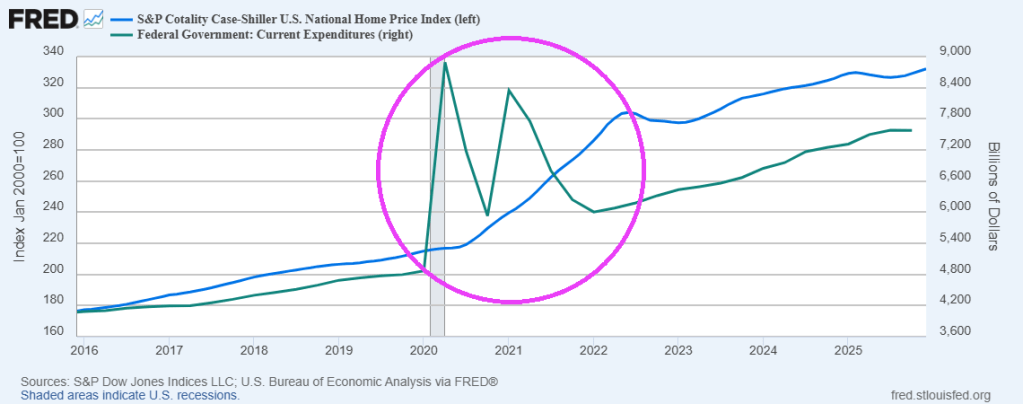
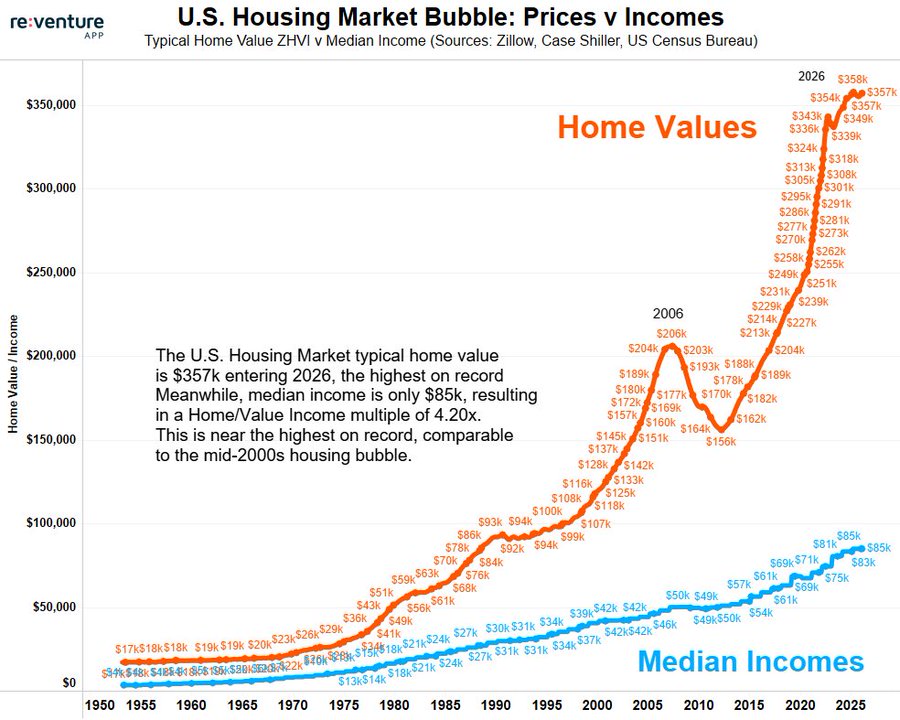
A good reason there are so few buyers is that home prices has soared after the Federal government’s spending spree after Covid.
Prayers for the soul of Noelia Castillo Ramos, murdered by the Spanish government. For being gangrape TWICE by immigrants then attempted suicide.
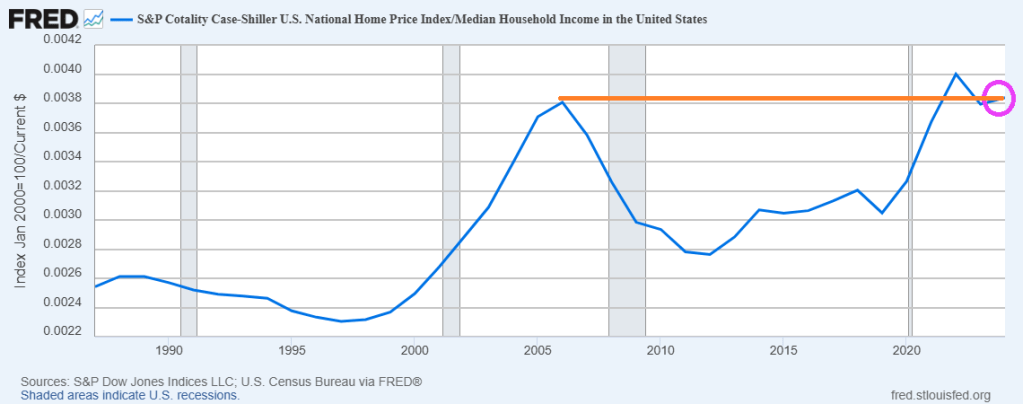
Yikes! The ratio of US Home Prices to US Median Household Income is now higher than the ratio during the catestrophic housing bubble during the latter half of the 2000s.
Here is a chart of home prices and median household incone,
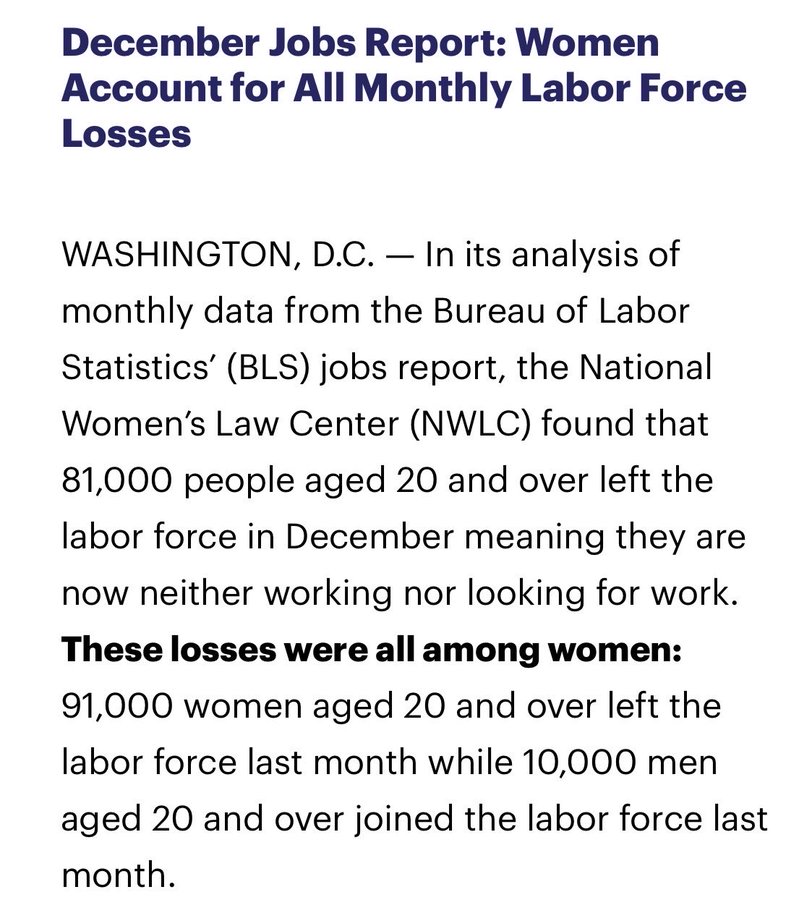
The labor market is truly screwed-up. The December jobs report reveals that women account for nearly all labor force losses.
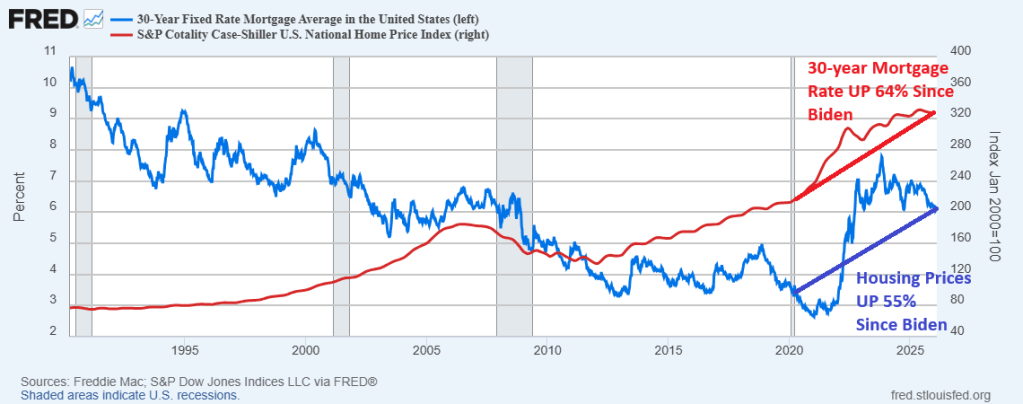
I ain’t drunk! But it would help in this housing market where housing prices and mortgage rates are much higher than when Joe Biden became President in January 2020. In fact, the Case-Shiller national home price index is 55% higher than when Sleepy Joe took the reins of Presidency and the 30-year mortgage rate is 64% higher.
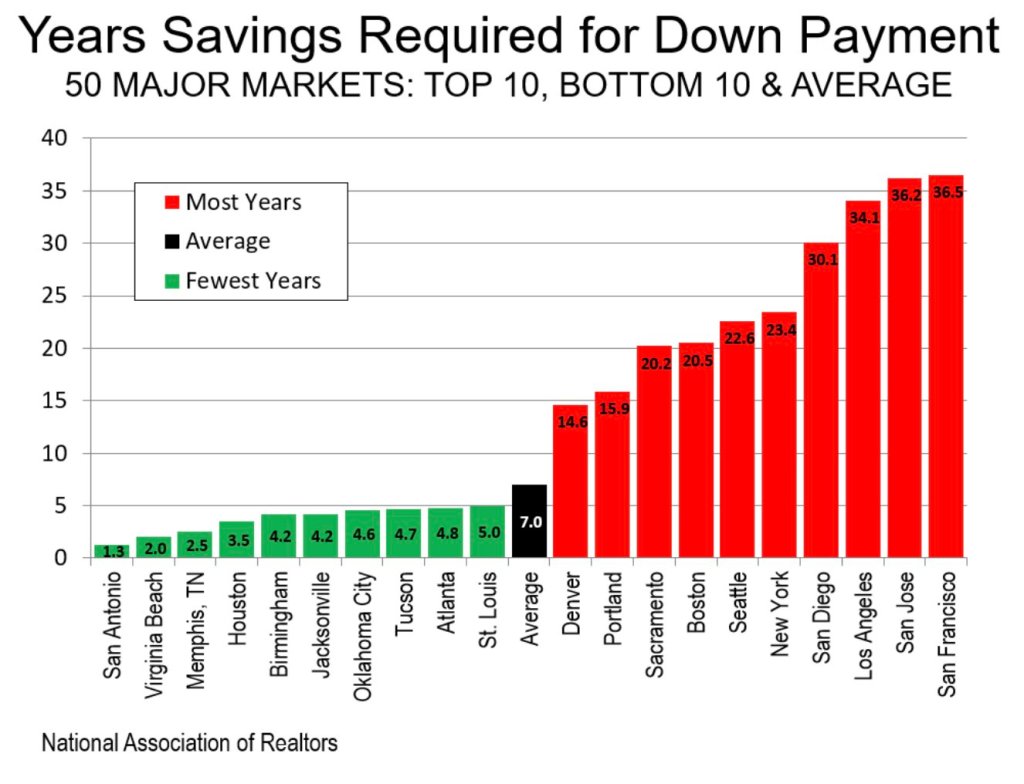
Because of higher housing prices and mortgage rates,
The Case-Shiller national home price index is 55% higher than when Sleepy Joe took the reins of Presidency and the 30-year mortgage rate is 64% higher.
As a result of higher housing prices and mortgage rate (and Gavin Newsom’s ludicrous policies), it will take over 30 years to accumulate enough savings to buy a home in San Diego, Los Angeles, San Jose and San Francisco.
I ain’t drunk, but first-time homebuyers will need to be drunk in this housing market.
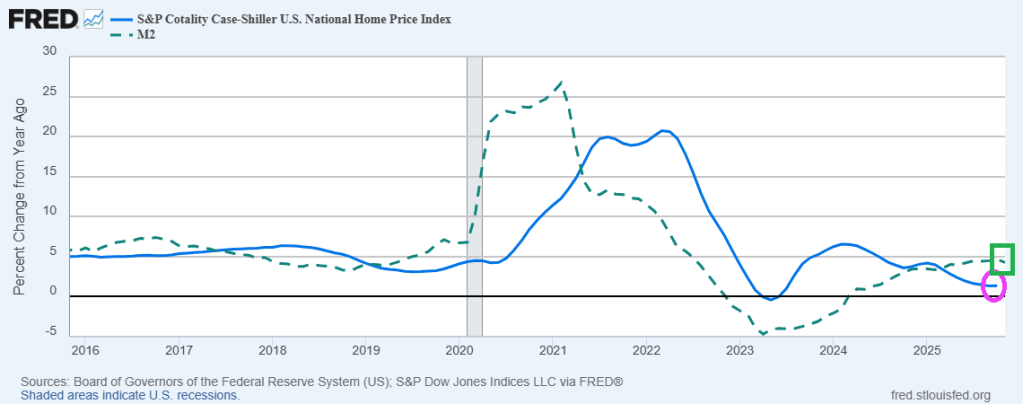
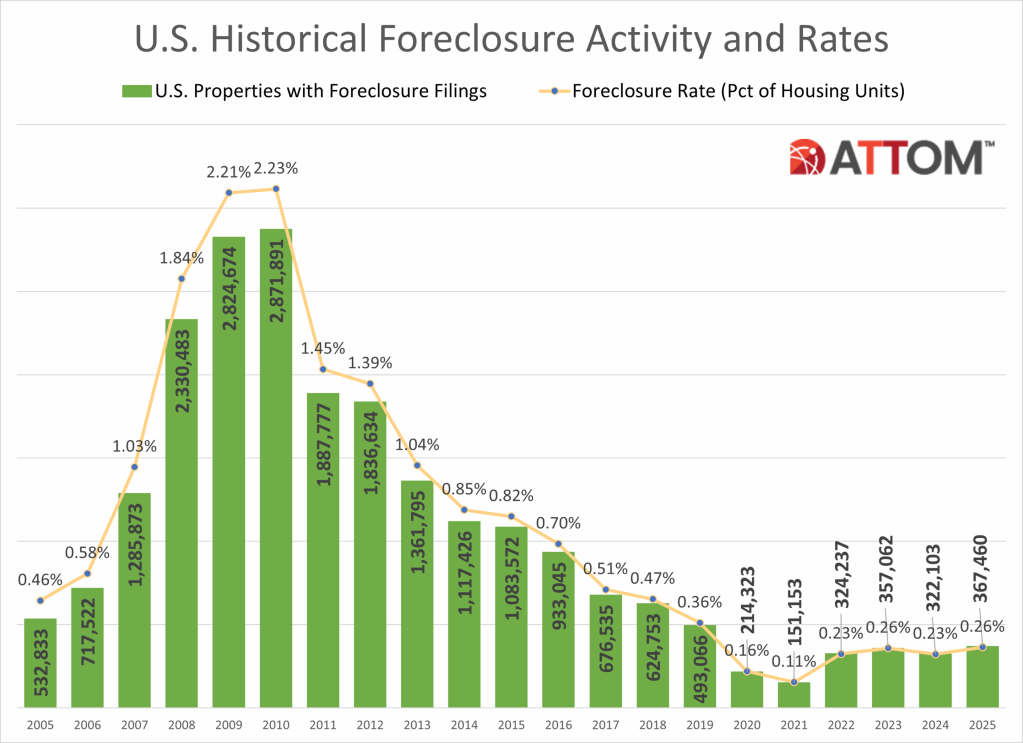
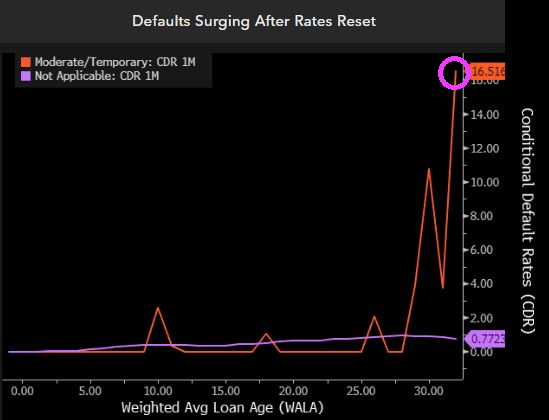
While its not the 2009, we do have a house price bubble that is deflating as The Fed slows M2 Money growth. However, we are witnessing rising foreclosure rates.
Lenders started the foreclosure process on 289,441 U.S. properties in 2025, up 14 percent from 2024, up 213 percent from the pandemic-era low in 2021, but down 14 percent form 2019 and down 86 percent from a peak of 2,139,005 in 2009.
States that saw the greatest number of foreclosure starts in 2025 included Texas (37,215 foreclosure starts); Florida (34,336 foreclosure starts); California (29,777 foreclosure starts); Illinois (15,010 foreclosure starts); and New York (13,664 foreclosure starts).
Those metropolitan statistical areas with a population greater than 1 million that saw the greatest number of foreclosure starts in 2025 included New York, NY (14,189 foreclosure starts); Chicago, IL (13,312 foreclosure starts); Houston, TX (13,009 foreclosure starts); Miami, FL (8,936 foreclosure starts); and Los Angeles, CA (8,503 foreclosure starts).
Bank repossessions increase year over year
Lenders repossessed 46,439 properties through foreclosures (REO) in 2025, up 27 percent from 2024 but down 68 percent from 143,955 in 2019, the last full year before pandemic-related declines, and down 96 percent from a peak of 1,050,500 in 2010.
States that saw the greatest number of REOs in 2025 included Texas (5,147 REOs); California (4,030 REOs); Pennsylvania (2,975 REOs); Florida (2,869 REOs); and Illinois (2,768 REOs).
Those metropolitan statistical areas with a population greater than 1 million that saw the greatest number of REOs in 2025 included Chicago, IL (2,033 REOs); New York, NY (1,462 REOs); Houston, TX (1,381 REOs); Detroit, MI (1,105 REOs); and Philadelphia, PA (1,100 REOs).
Florida, Delaware, and South Carolina record the worst foreclosure rates in 2025
States with the worst foreclosure rates in 2025 were Florida (1 in every 230 housing units with a foreclosure filing); Delaware (1 in every 240 housing units); South Carolina (1 in every 242 housing units); Illinois (1 in every 248 housing units); and Nevada (1 in every 248 housing units).
Rounding out the top 10 states with the worst foreclosure rates in 2025, were New Jersey (1 in every 273 housing units); Indiana (1 in every 302 housing units); Ohio (1 in every 307 housing units); Texas (1 in every 319 housing units); and Maryland (1 in every 326 housing units).
Lakeland, Columbia, and Cleveland post the worst metro foreclosure rates in 2025
Among 225 metropolitan statistical areas with a population of at least 200,000, those with the worst foreclosure rates in 2025 were Lakeland, FL (1 in every 145 housing units with a foreclosure filing); Columbia, SC (1 in every 165 housing units); Cleveland, OH (1 in every 187 housing units); Cape Coral, FL (1 in every 189 housing units); and Atlantic City, NJ (1 in every 192 housing units).
Metro areas with a population greater than 1 million, including Cleveland that had the worst foreclosure rates in 2025 were: Jacksonville, FL (1 in every 200 housing units); Las Vegas, NV (1 in every 210 housing units); Chicago, IL (1 in every 214 housing units); and Orlando, FL (1 in every 217 housing units).
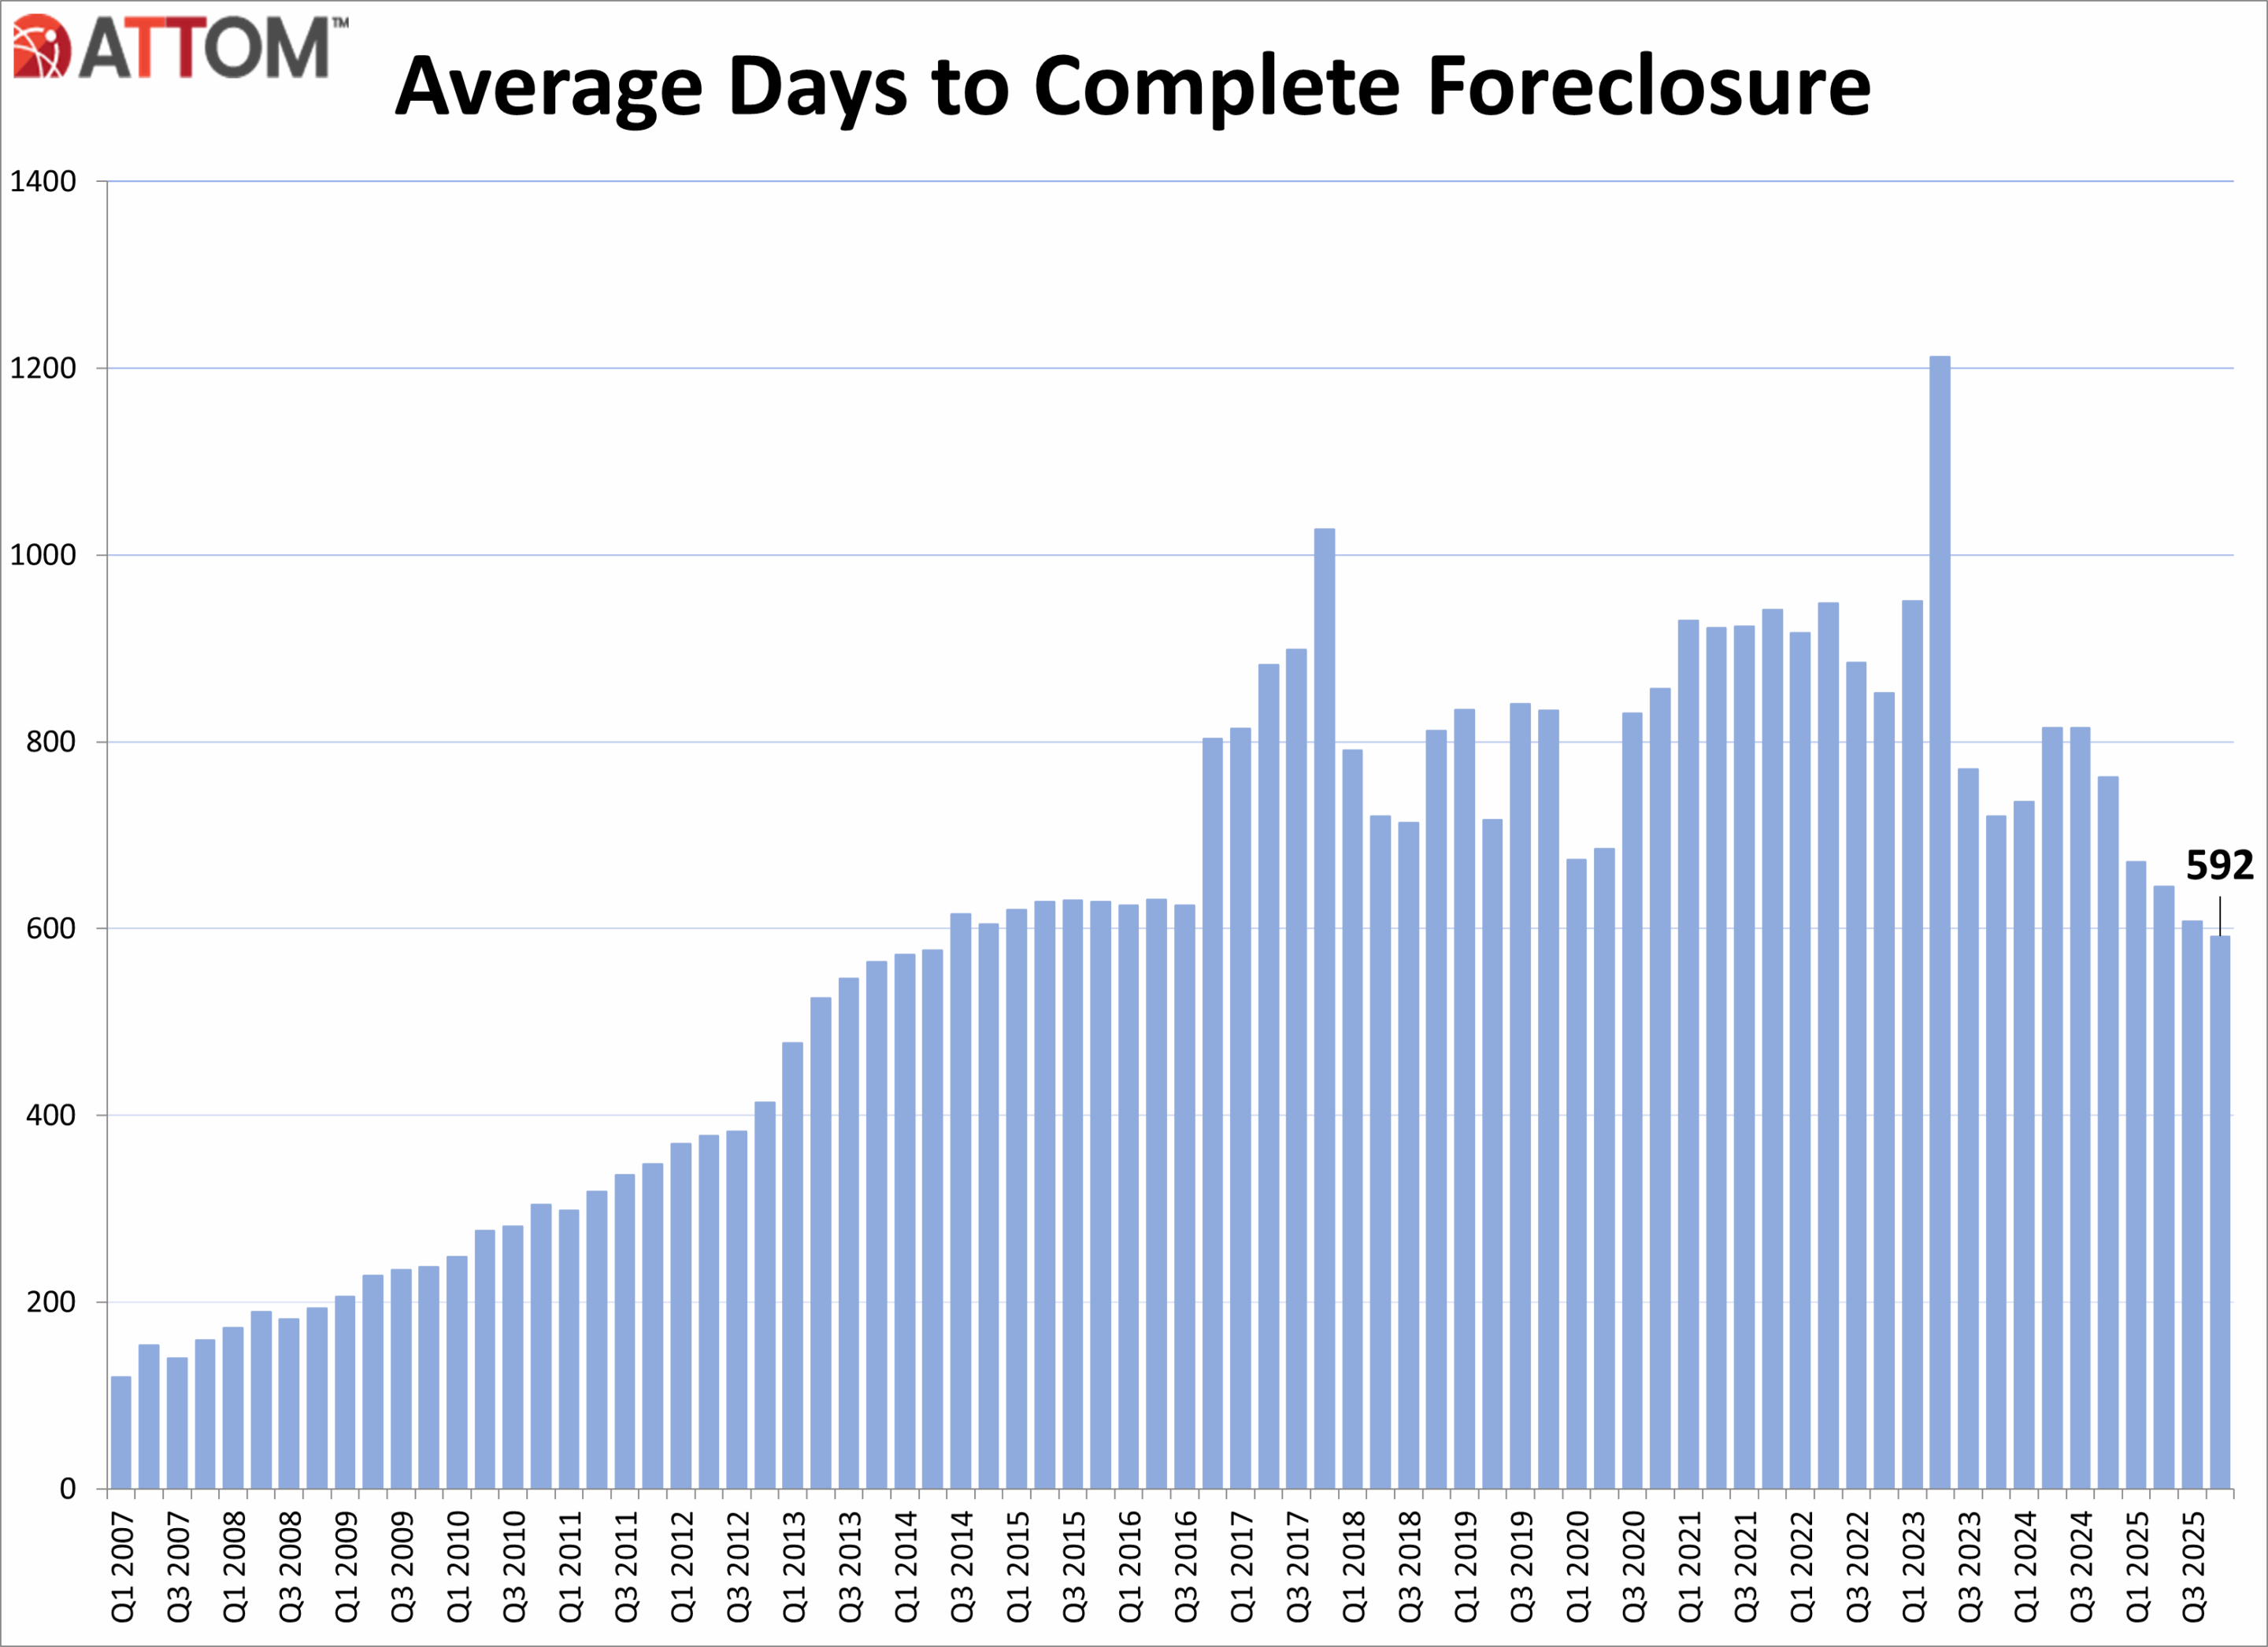
Average time to foreclose decreases
U.S. properties foreclosed in the fourth quarter of 2025 had been in the foreclosure process an average of 592 days, a 3 percent decrease from the previous quarter and a 22 percent decrease from a year ago.
States with the longest average time to foreclose in Q4 2025 were Louisiana (3,461 days); New York (1,998 days); Hawaii (1,760 days); Connecticut (1,600 days); and Kansas (1,594 days).
There was a total of 111,692 U.S. properties with foreclosure filings in Q4 2025, up 10 percent from the previous quarter and up 32 percent from a year ago.
Nationwide in Q4 2025, one in every 1,274 properties had a foreclosure filing.
December 2025 Foreclosure Activity Key Takeaways
Nationwide in December 2025, one in every 3,163 properties had a foreclosure filing.
States with the worst foreclosure rates in December 2025 were New Jersey (one in every 1,734 housing units with a foreclosure filing); South Carolina (one in every 1,917 housing units); Maryland (one in every 1,961 housing units); Delaware (one in every 2,044 housing units); and Florida (one in every 2,119 housing units).
28,269 U.S. properties started the foreclosure process in December 2025, up 19 percent from the previous month and up 46 percent from a year ago.
Lenders completed the foreclosure process on 5,953 U.S. properties in December 2025, up 53 percent from the previous month and up 101 percent from a year ago.
Conclusion
ATTOM’s Year-End 2025 Foreclosure Market Report shows that U.S. foreclosure activity increased in 2025, with foreclosure filings, starts, and bank repossessions all rising compared to 2024, signaling a continued shift toward more normalized market conditions. Despite the annual increases, foreclosure activity remains significantly below pre-pandemic levels and far below peaks seen during the last housing crisis. December 2025 and Q4 2025 data also showed increased foreclosure activity on both a monthly and annual basis.
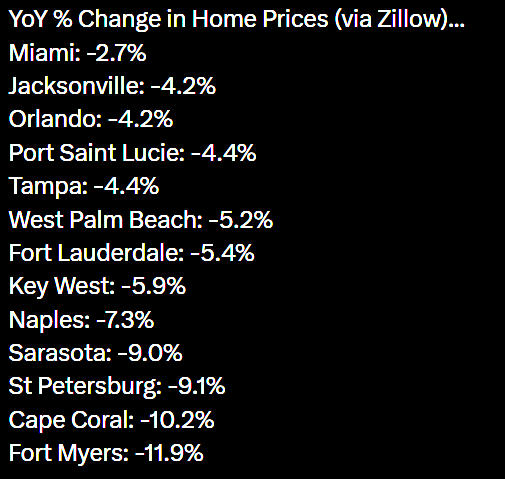
Florida home prices are tanking with Fort Myers leading the collapse at -11.9% YoY.
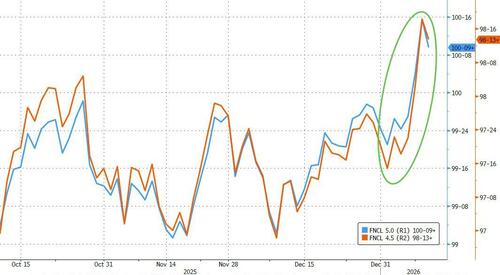
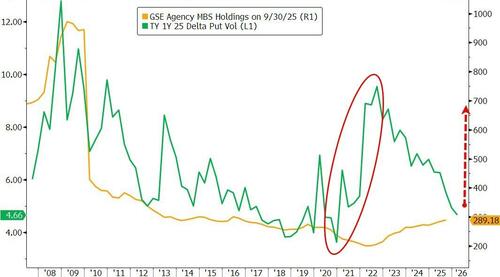
President Trump ordered Fannie Mae and Freddie Mac to operate like The Federal Reserve. Buying assets to manipulate interest rates. In this case, F&F have been ordered to buy $200 billion of agency MBS.
Thursday’s Truth Social post triggered an immediate snap tighter in mortgages, led by the belly and lower coupons. By pulling MBS spreads tighter and crowding out real-money buyers, Fannie and Freddie’s purchases would push incremental demand into Treasuries as the next-best duration substitute, putting a modest bid under the belly of the curve.
However, execution and the ultimate size of purchases is still unclear, as my colleague Alyce Andres noted. If the government-sponsored enterprises GSEs stagger purchases, and signal an ultimate increase above the announces $200 billion, further tightening should occur. They can fund a lot of the buys from existing liquidity portfolios, though there’s a path where they could issue short-term debt to preserve operating buffers and could nudge repo wider at the margin.
The bigger transmission channel is hedging, as highlighted by colleagues Ira Jersey and Will Hoffman. Unlike the Fed, the GSEs actively hedge MBS holdings, shedding duration by paying fixed rates in swaps and using swaptions to manage the negative convexity and vega risks embedded in mortgages. That matters for swap spreads and for volatility, especially in the belly.
That’s why GSE MBS purchases don’t have to be huge to change the feel in rate markets. The post-Global Financial Crisis regime dulled the classic convexity feedback loop because the Fed held such a large amount of agency MBS and didn’t hedge it, while the GSEs shrank their portfolios. Trump’s directive risks bringing more of that regime back.
A recent note out of Goldman Sachs frames it cleanly: A $200 billion build could lift the active convexity-hedger footprint by about 25%. The street then starts front-running the mechanical flows — paying in selloffs, receiving in rallies — which makes breakouts more likely even if day-to-day ranges look calm, Goldman added.
Positioning makes the setup more precarious. JPMorgan already saw mortgage valuations as a “bit snug” before the announcement, while BofA flagged that rates market had recently added fresh belly shorts sitting against a backdrop of benchmark funds still overweight MBS versus IG.
That mix can keep the initial tightening sticky, but it also raises the odds of sharp reversals if the market decides the purchasing flows are slower, smaller, or more heavily hedged than hoped.
Fannie and Freddie’s retained portfolio are soaring along with the duration gap.
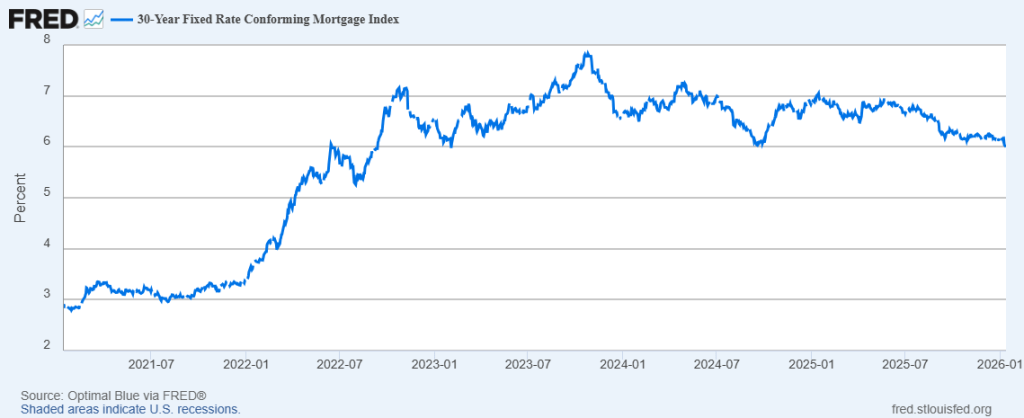
The effect on mortgage rates has so far has been negligible. The 30-year conforming mortgage just fell below 6% at 5.99%.
Hallelujah, I love this economy so! Of course, former First Lady Jill Biden is on the national tour trashing the economy saying it was “perfect” under Joe Biden.
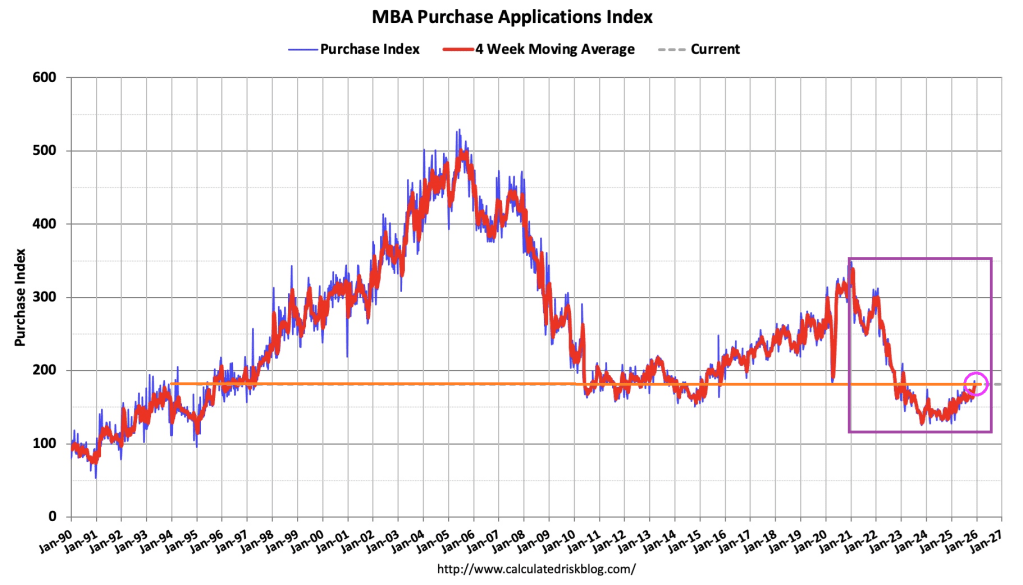
The Market Composite Index, a measure of mortgage loan application volume, increased 4.8 percent on a seasonally adjusted basis from one week earlier. On an unadjusted basis, the Index increased 49 percent compared with the previous week. The seasonally adjusted Purchase Index decreased 2 percent from one week earlier. The unadjusted Purchase Index increased 32 percent compared with the previous week and was 19 percent higher than the same week one year ago.
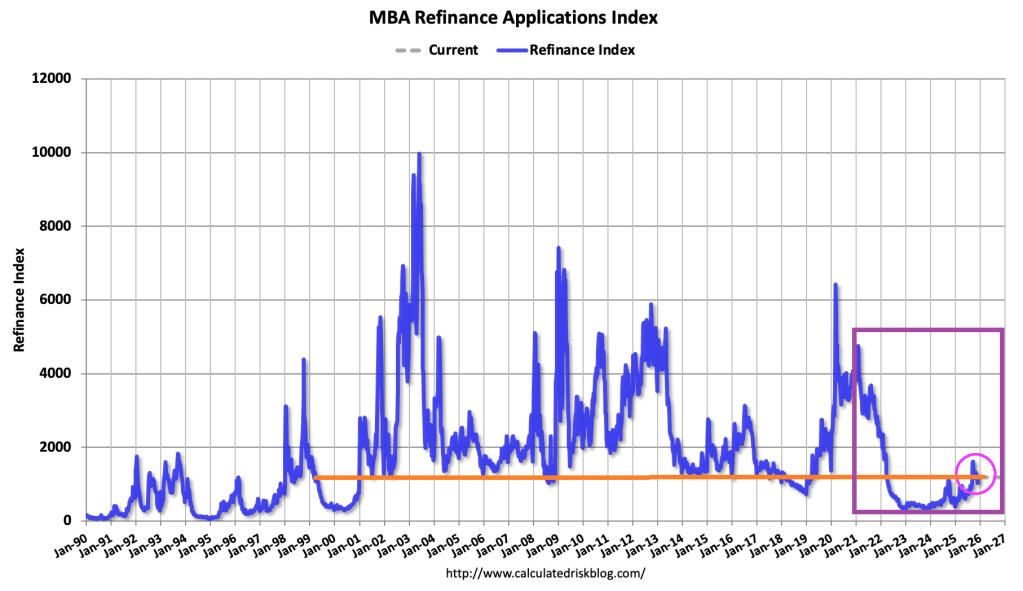
The Refinance Index increased 14 percent from the previous week and was 88 percent higher than the same week one year ago.
Compared to the prior week’s data, which included an adjustment for the Thanksgiving holiday, mortgage application activity increased last week, driven by an uptick in refinance applications,” said Joel Kan, MBA’s Vice President and Deputy Chief Economist. “Conventional refinance applications were up almost 8 percent and government refinances were up 24 percent as the FHA rate dipped to its lowest level since September 2024. Conventional purchase applications were down for the week, but there was a 5 percent increase in FHA purchase applications as prospective homebuyers continue to seek lower downpayment loans. Overall purchase applications continued to run ahead of 2024’s pace as broader housing inventory and affordability conditions improve gradually.
The average contract interest rate for 30-year fixed-rate mortgages with conforming loan balances ($806,500 or less) increased to 6.33 percent from 6.32 percent, with points increasing to 0.60 from 0.58 (including the origination fee) for 80 percent loan-to-value ratio (LTV) loans.
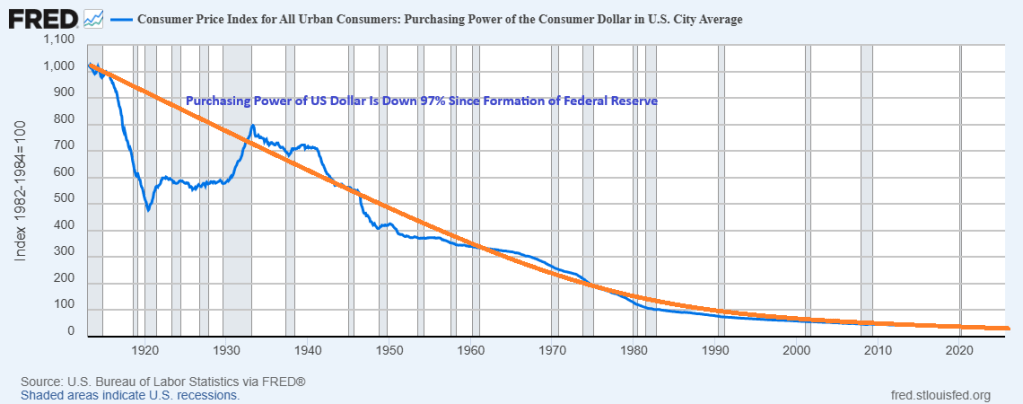
Under The Federal Reserve, the purchasing power of the US Dollar has declined -97% since the establishment of The Federal Reserve in 1913. It is the House of the Dying Dollar.
Under The Federal Reserve, the purchasing power of the US Dollar has declined -97% since the establishment of The Federal Reserve in 1913.
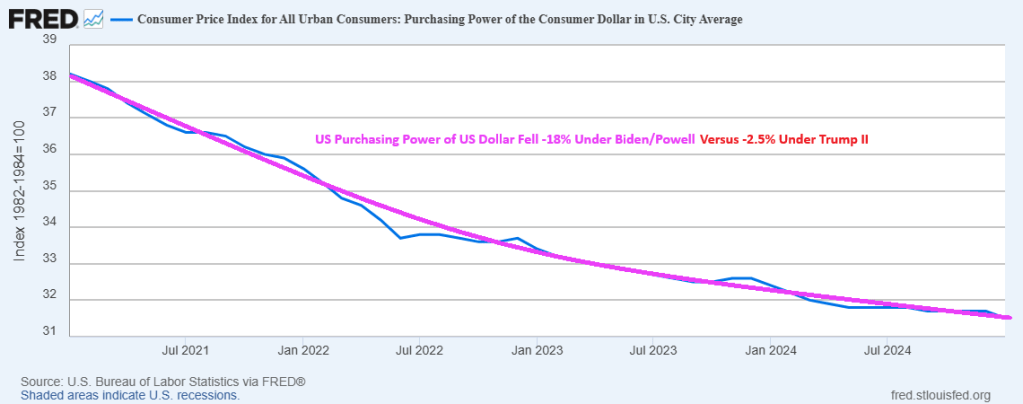
Of course, Trump II is only 9 months old and Biden had 4 long years to destroy the dollar.
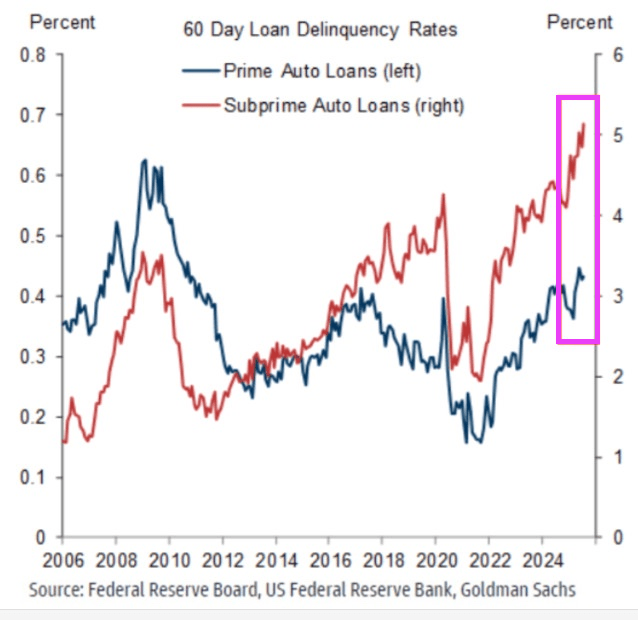
The car market bubble is bursting! Subprime auto loan delinquency rates have now surpassed 5% for the first time in history. The 60-day delinquency rate for subprime auto loans has more than DOUBLED over the last 3 years. Delinquency rates are now ~1.5 percentage points above the 2008 Financial Crisis peak. At the same time, prime auto loan delinquencies rose to their highest in 15 years. Meanwhile, the total value of auto loans in the US jumped $13 billion, to a record $1.66 trillion in Q2 2025. An auto debt crisis is brewing.
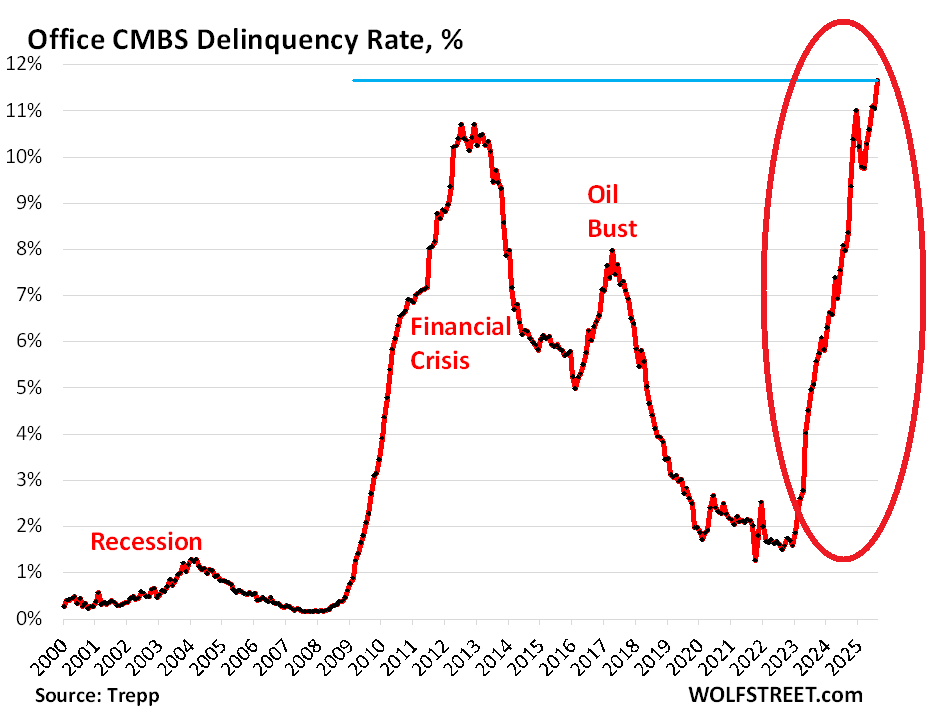
The office CMBS delinquency rate is at an all-time high.


You must be logged in to post a comment.