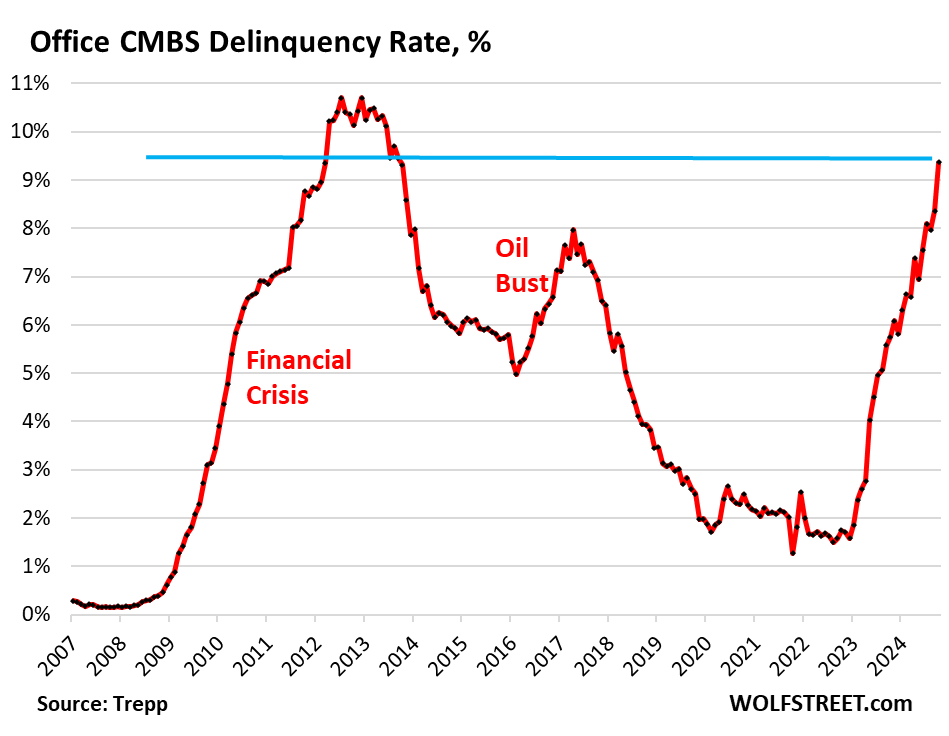
The delinquency rate for commercial mortgage-backed securities (CMBS) tied to office properties reached 10.4 percent in November 2024, approaching the 10.7 percent peak reached during the 2008 financial crisis. The ascent is the fastest two-year increase on record, with rates climbing 8.8 percentage points since late 2022, significantly outrunning the 6.3-point rise seen during the financial crisis nearly 15 years ago.
The office real estate sector has been grappling with a severe downturn for several years now, but are accelerating recently as they are driven by persistently high vacancy rates and declining rents. Property values, particularly for older office buildings, have plummeted, with many losing 50 to 70 percent of their market value and in some cases becoming effectively worthless. Those conditions have left real estate portfolio managers and building owners unable to borrow, refinance or sell properties, contributing to rising delinquencies and foreclosures. (Mortgages become effectively delinquent when payments are missed beyond a standard 30-day grace period.)
On the CMBS front, there have been no upgrades in 2023 and 2024.
Efforts to convert office buildings into residential spaces are increasing but remain limited by structural and economic constraints. Many office towers are unsuitable for conversion due to their large floor plates or prohibitively high retrofitting costs which often exceed the cost of demolition and rebuilding. In 2024, 73 office-to-residential conversions were completed, with an additional 30 underway. Despite plans to increase the pace in 2025, the cumulative impact remains minimal, addressing just 7.9 percent of the 902 million square feet of vacant office space nationwide.
The last gasp of the Biden/Harris reign of (economic) error!
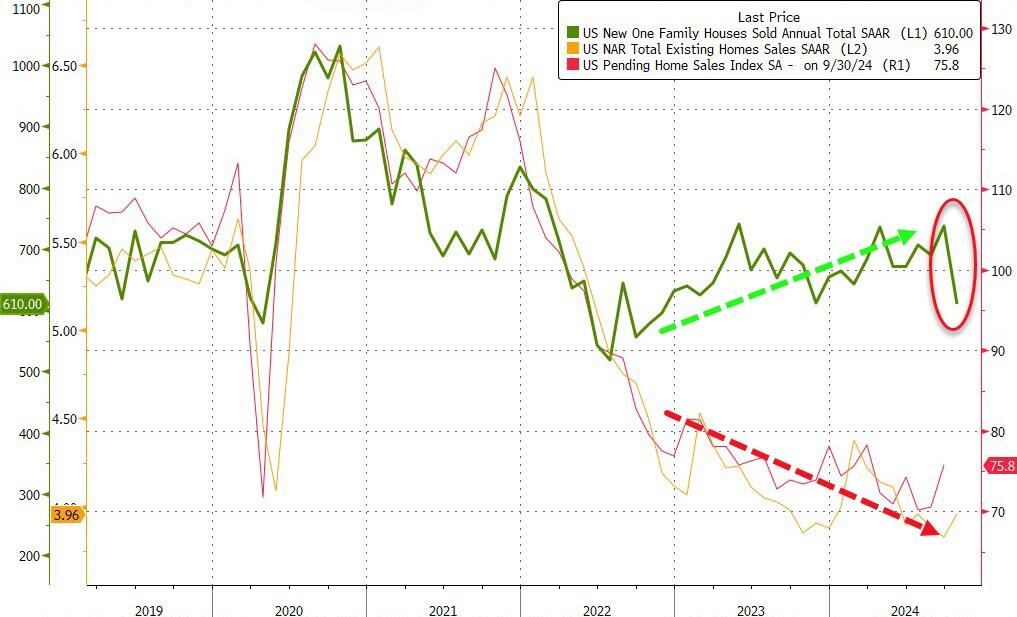
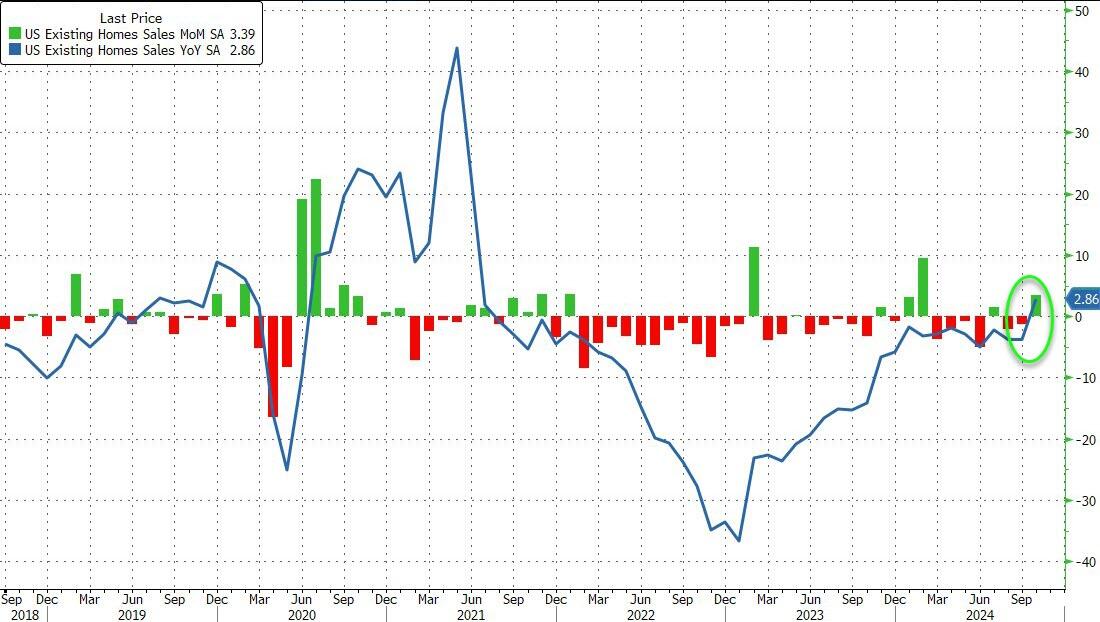
After existing home sales unexpectedly ticked up in October, analysts expected new home sales to slow after their recent resurgence (-1.8% MoM). They were right… BUT… the magnitude is mind-boggling!
New Home Sales collapsed 17.3% MoM in October. That is the largest MoM drop since July 2013.
Source: Bloomberg
That MoM plunge dragged sales down 9.4% YoY to 610k SAAR – the lowest since Nov 2022
Source: Bloomberg
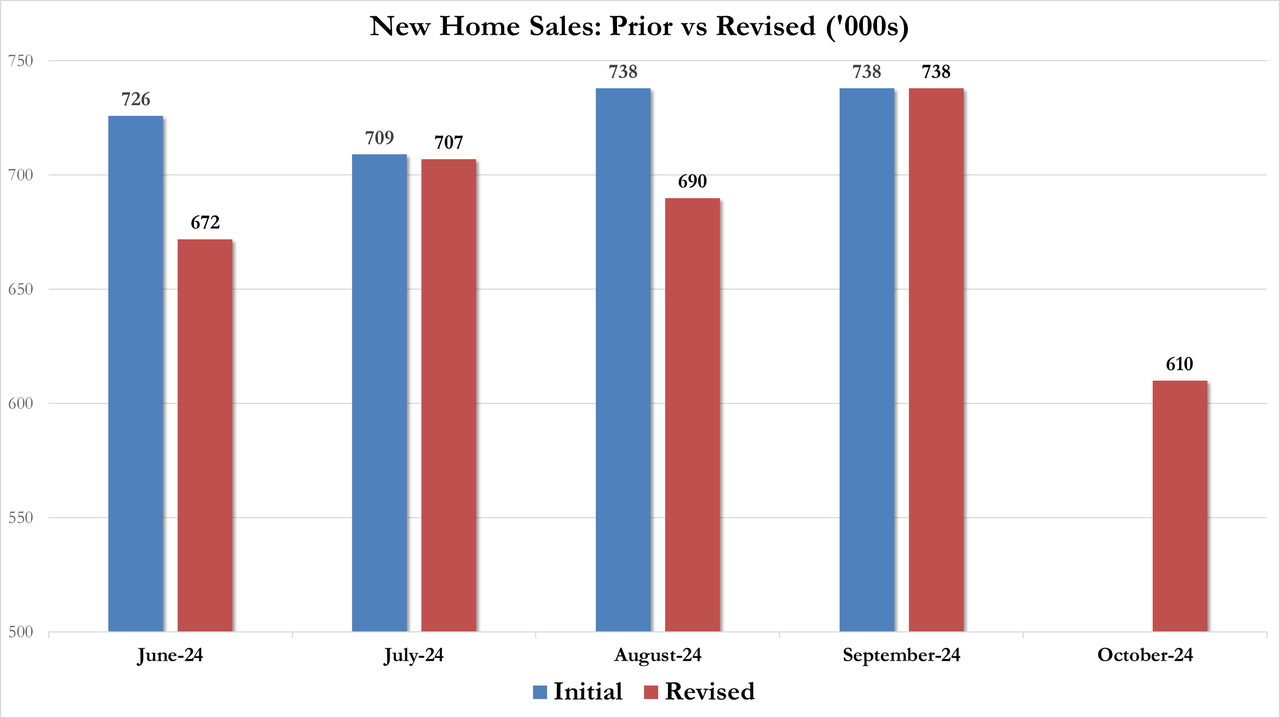
Of course, all the revisions are lower…
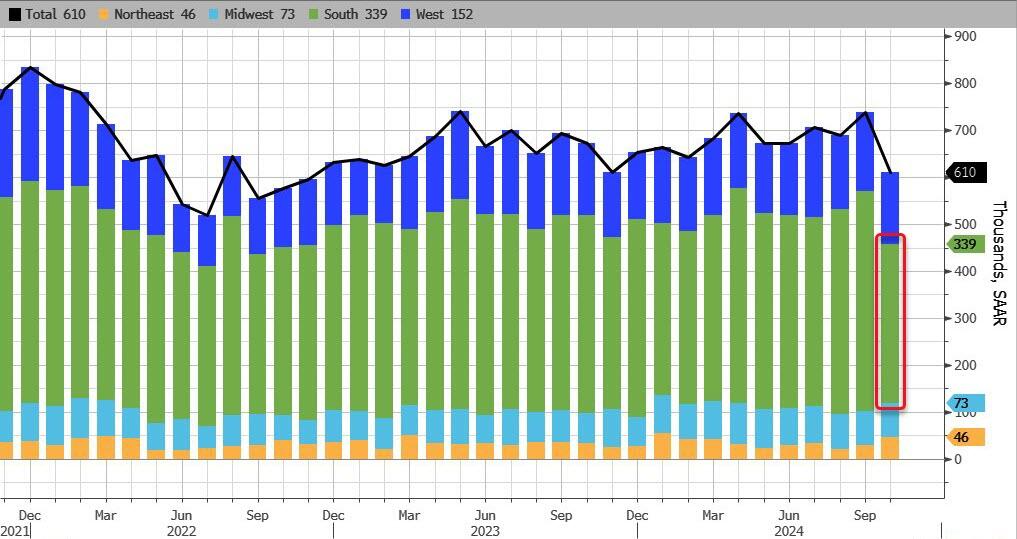
Hurricanes Helene and Milton, which tore through parts of the Southeast, delayed sales in the nation’s biggest housing region and dragged down sales overall.
Sales in the South decreased 28% to 339,000, the slowest pace since April 2020. Sales also fell in the West, but rose in the Northeast and the Midwest.
Source: Bloomberg
Finally, we note that the median sale price of a new home increased to $437,300 in October, the highest in 14 months.
Does this mean November’s data will see a massive surge in new home sales? …even as rates have increased significantly?
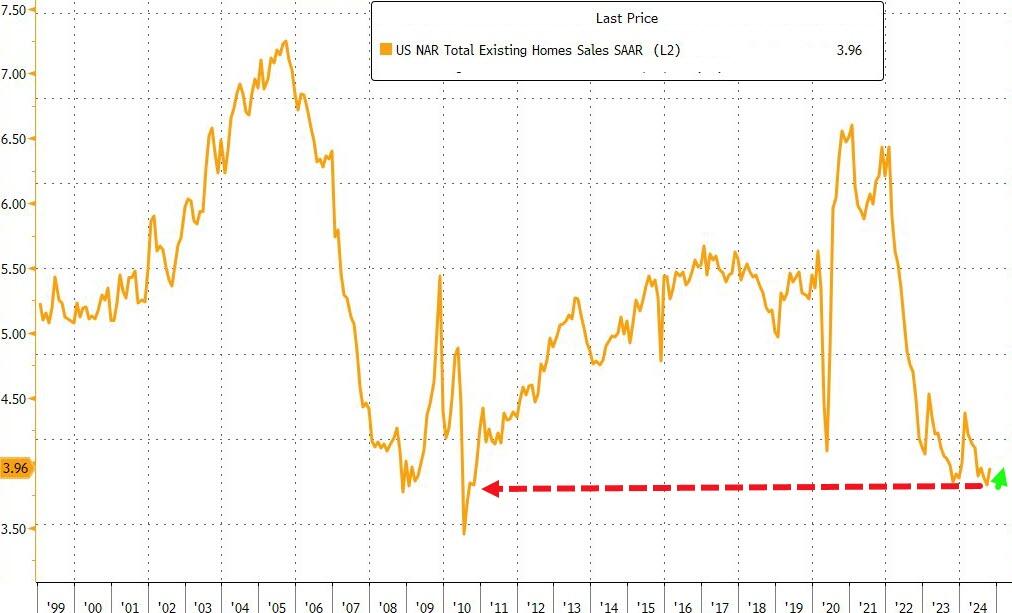
…but in context, that shift up to 3.96mm SAAR homes sold is nothing…
Source: Bloomberg
High borrowing costs have led to a shortage of previously owned homes on the market, discouraging many would-be home sellers from listing their properties for sale and having to part with their current low financing costs.
“Additional job gains and continued economic growth appear assured, resulting in growing housing demand,” NAR Chief Economist Lawrence Yun said in a prepared statement.
“While mortgage rates remain elevated, they are expected to stabilize.”
Last month, the inventory of available homes edged up 0.7% to 1.37 million, continuing to trend higher although well below pre-pandemic levels.
Despite the weakness in sales, tight inventory is keeping prices elevated, yielding one of the least affordable housing markets on record. The median sale price last month increased 4% from a year earlier to $407,200, the highest ever for any October, the NAR figures show.
Contract signings rose in all four US regions, led by a 6.7% jump in the Midwest.
Sales of single-family homes increased 3.5% in October; purchases of condominiums and co-ops were up 2.7%
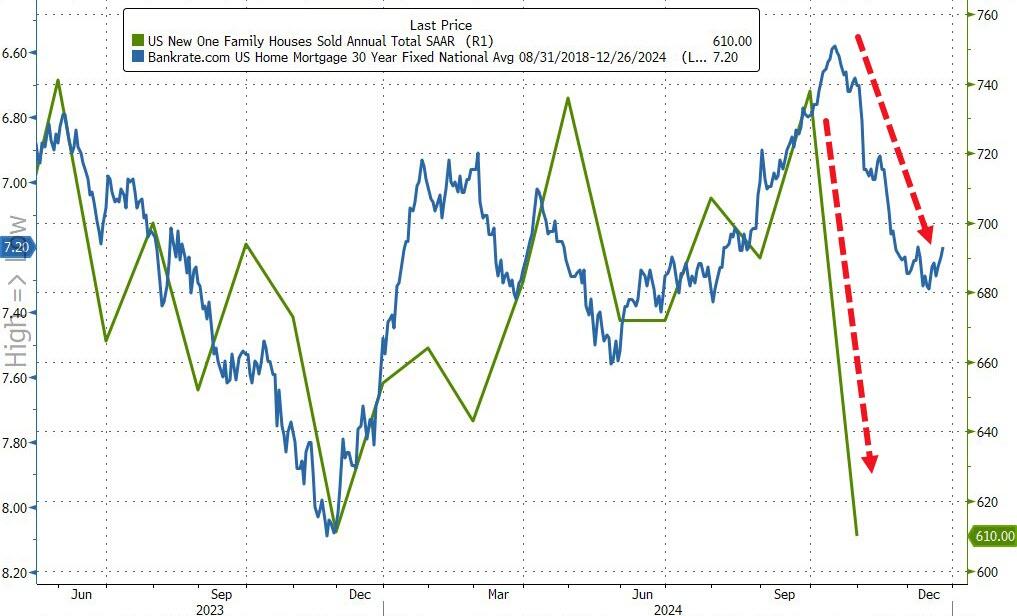
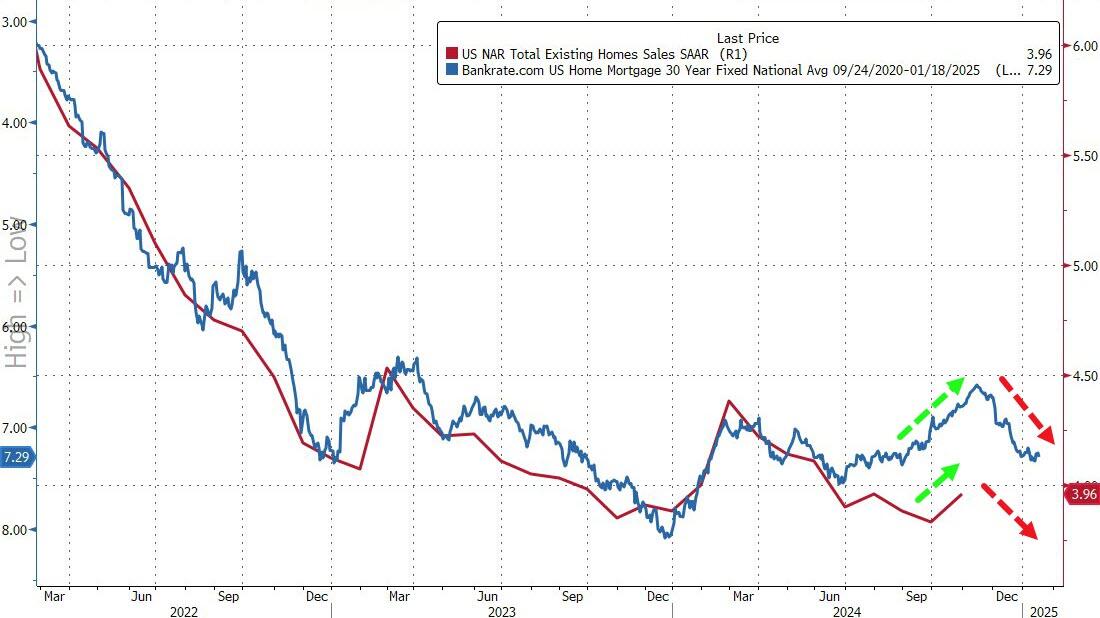
Finally, while that’s all very exciting – a scintilla of growth off almost record lows – the fecal matter is about to strike the rotating object as rising mortgage rates lagged impact threatens…
Source: Bloomberg
In October, 59% of homes sold were on the market for less than a month, compared with 57% in September, and 19% sold above the list price. Properties remained on the market for 29 days on average, compared with 28 days in the previous month. First-time buyers made up 27% of purchases, still historically low.
Fortunately, the Biden/Harris administration is winding down. On the mortgage side, the mortgage market is already gone under Biden/Harris where mortgage purchase applications are down a whopping 60%.
Mortgage applications increased 1.7 percent from one week earlier, according to data from the Mortgage Bankers Association’s (MBA) Weekly Mortgage Applications Survey for the week ending November 15, 2024.
The Market Composite Index, a measure of mortgage loan application volume, increased 1.7 percent on a seasonally adjusted basis from one week earlier. On an unadjusted basis, the Index decreased 1 percent compared with the previous week. The seasonally adjusted Purchase Index increased 2 percent from one week earlier. The unadjusted Purchase Index decreased 3 percent compared with the previous week and was 1 percent lower than the same week one year ago. And down -60% under Biden/Harris.
The Refinance Index increased 2 percent from the previous week and was 43 percent higher than the same week one year ago.
Slowing economy, rising rates, too expensive housing. Not a good sign for the mortgage market.
There is one way out of the inflation trap. And it’s drill, baby, drill!
For the 53rd straight month, core consumer prices rose on a MoM basis in October with the YoY pace re-accelerating to +3.33%.
The shelter index increased 4.9 percent over the last year, accounting for over 65 percent of the total 12-month increase in the all items less food and energy index.
Thank goodness Harris can’t try to impliment her ridiculous plans to boost housing!
Glad to see Vivek Ramaswamy and Elon Musk (the NEW Two Bobs from Office Space) cleaning up the mess in Washington DC.
The US Treasury yield curve (10Y-2Y CMT) went negative on April 1, 2024. And remains positive.
The US Treasury 10Y-2Y CMT (constant maturity Treasury) peaked locally on March 29, 2024 and then fell, eventually turning negative on April 1, 2024. And remained negative until August 30, 2024 just prior to the election. It looks like the yield curve accurately predicted the election of Trump.
The 10-year Treasury yield is rising with a positive economic outlook under Trump. And with that optimism we see mortgage rates rising too.
The Market Composite Index, a measure of mortgage loan application volume, decreased 10.8 percent on a seasonally adjusted basis from one week earlier. On an unadjusted basis, the Index decreased 12 percent compared with the previous week. The seasonally adjusted Purchase Index decreased 5 percent from one week earlier. The unadjusted Purchase Index decreased 7 percent compared with the previous week and was 2 percent higher than the same week one year ago.
The Refinance Index decreased 19 percent from the previous week and was 48 percent higher than the same week one year ago.
“Ten-year Treasury rates remain volatile and continue to put upward pressure on mortgage rates. The 30-year fixed rate last week increased to 6.81 percent, the highest level since July,” said Joel Kan, MBA’s Vice President and Deputy Chief Economist. “Applications decreased for the sixth consecutive week, with purchase activity falling to its lowest level since mid-August and refinance activity declining to the lowest level since May. The average loan size on a refinance application dropped below $300,000, as borrowers with larger loans tend to be more sensitive to any given changes in mortgage rates.”
The refinance share of mortgage activity decreased to 39.9 percent of total applications from 43.1 percent the previous week. The adjustable-rate mortgage (ARM) share of activity increased to 7.0 percent of total applications.
The FHA share of total applications decreased to 15.5 percent from 16.4 percent the week prior. The VA share of total applications decreased to 12.5 percent from 14.6 percent the week prior. The USDA share of total applications increased to 0.5 percent from 0.4 percent the week prior.
The average contract interest rate for 30-year fixed-rate mortgages with conforming loan balances ($766,550 or less) increased to 6.81 percent from 6.73 percent, with points decreasing to 0.68 from 0.69 (including the origination fee) for 80 percent loan-to-value ratio (LTV) loans. The effective rate increased from last week.
The average contract interest rate for 30-year fixed-rate mortgages with jumbo loan balances (greater than $766,550) increased to 6.98 percent from 6.77 percent, with points increasing to 0.65 from 0.49 (including the origination fee) for 80 percent LTV loans. The effective rate increased from last week.
The average contract interest rate for 30-year fixed-rate mortgages backed by the FHA increased to 6.75 percent from 6.55 percent, with points decreasing to 0.87 from 0.94 (including the origination fee) for 80 percent LTV loans. The effective rate increased from last week.
The average contract interest rate for 15-year fixed-rate mortgages decreased to 6.21 percent from 6.27 percent, with points decreasing to 0.55 from 0.77 (including the origination fee) for 80 percent LTV loans. The effective rate decreased from last week.
The average contract interest rate for 5/1 ARMs decreased to 6.05 percent from 6.20 percent, with points increasing to 0.84 from 0.59 (including the origination fee) for 80 percent LTV loans. The effective rate decreased from last week.
The bond market is reacting to the election of Trump with a clear Bear Steepening.
Bear steepening happens when yields move up across tenors, but long-end yields move up even faster than short-end yields.
This isn’t going to help mortgage applications due to lowering rates.
The office sector of commercial real estate has been in a depression for about two years, with prices of older office towers plunging by 50%, 60%, or 70% from their last transaction, and sometimes even more, with some office towers selling for land value, with the building by itself being worth next to nothing even in Manhattan.
Landlords of office buildings are having trouble collecting enough in rent to even pay the interest on their loans, and they’re having trouble or are finding it impossible to refinance a maturing loan, and so many of them have stopped making interest payments on their mortgages, and delinquencies continue to spike.
The delinquency rate of office mortgages backing commercial mortgage-backed securities (CMBS) spiked to 9.4% in October, up a full percentage point from September, and the highest since the worst months of the meltdown that followed the Financial Crisis. The delinquency rate has doubled since June 2023 (4.5%), according to data by Trepp, which tracks and analyzes CMBS.
Office CRE fund managers have spread the rumor that office CRE has bottomed out, but the CMBS delinquency rate doesn’t agree with this bottomed-out scenario; it’s aggressively spiking.
Three months ago, the delinquency rate surpassed the surge in delinquencies that followed the American Oil Bust from 2014 through 2016, when hundreds of companies in the US oil-and-gas sector filed for bankruptcy as the price of oil had collapsed due to overproduction, which devastated the Houston office market in 2016.
But now there’s a structural problem that won’t easily go away with the price of oil: A huge office glut has emerged after years of overbuilding and industry hype about the “office shortage” that led big companies to hog office space as soon as it came on the market with the hope they’d grow into it. However, during the pandemic, companies realized that they don’t need all this office space, and vast portions of it sits there vacant and for lease, with vacancy rates in the 25% to 36% range in the biggest markets.
Mortgages are considered delinquent by Trepp when the borrower fails to make the interest payment after the 30-day grace period. A mortgage is not considered delinquent here if the borrower continues to make the interest payment but fails to pay off the mortgage when it matures. This kind of repayment default, while the borrower is current on interest, would be on top of the delinquency rate here.
Loans are pulled off the delinquency list if the interest gets paid, or if the loan is resolved through a foreclosure sale, generally involving big losses for the CMBS holders, or if a deal gets worked out between landlord and the special servicer that represents the CMBS holders, such as the mortgage being restructured or modified and extended.
Survive till 2025 has been the motto. But that might not work either. The Fed has cut its policy rate by 50 basis points in September and is likely to cut more but in smaller increments. Many CRE loans are floating-rate loans that adjust to a short-term rate (SOFR), and short-term rates move largely with the Fed’s policy rates. And floating-rate loans will have lower interest rates as the Fed cuts.
Long-term rates, including fixed-rate mortgage rates have risen sharply since the Fed started cutting rates, so that option isn’t appealing.
So the hope in the CRE industry is that rate cuts will be steep and many, thereby reducing floating-rate interest payments, making it easier for landlords to meet them. And so the prescription was: Survive till 2025, when interest rates would be, they hope, far lower than they were.
But rate cuts will do nothing to address the structural issues that office CRE faces. The landlord of a nearly empty older office tower isn’t going to be able to make the interest payment even at a lower rate when the tower is largely vacant.
And these older office towers face the brunt of the vacancy rates, amid a flight to quality now feasible because of vacancies even at the latest and greatest properties. And there are a lot of these older office towers around that have been refinanced at very high valuations in the years before the pandemic, but whose valuations have now plunged by 50%, 60%, or 70%, and they have become a nightmare for lenders and CMBS holders.
S&P/Case-Shiller released the monthly Home Price Indices for August (“August” is a 3-month average of June, July and August closing prices). August closing prices include some contracts signed in April, so there is a significant lag to this data. Here is a graph of the month-over-month (MoM) change in the Case-Shiller National Index Seasonally Adjusted (SA).
Mortgage applications decreased 6.7 percent from one week earlier, according to data from the Mortgage Bankers Association’s (MBA) Weekly Applications Survey for the week ending October 18, 2024.
The Market Composite Index, a measure of mortgage loan application volume, decreased 6.7 percent on a seasonally adjusted basis from one week earlier. On an unadjusted basis, the Index decreased 7 percent compared with the previous week. The seasonally adjusted Purchase Index decreased 5 percent from one week earlier. The unadjusted Purchase Index decreased 5 percent compared with the previous week and was 3 percent higher than the same week one year ago.
The Refinance Index decreased 8 percent from the previous week and was 90 percent higher than the same week one year ago.
Implied volatility in Treasury yields has risen to the highest since December.


You must be logged in to post a comment.