Since the Covid outbreak in early 2020, The Fed went wild with rate cuts and massive and unpredented balance sheet expansion.
Let’s look at The Fed’s puchase of agency MBS and mortgage rates. From 2020 2022, The Fed continued to buy agency MBS. But in 2022, all hell broke loose as The Fed went crazy RAISING rates, but slowly began unwinding their balance sheet. The result? Mortgage rates began to climb. In fact, the US conforming mortgage rate for 30 years has risen 102% since early 2022. The Fed is only slowing unwinding their MBS holdings.
Despite the struggles in the residential housing market, the COMMERCIAL mortgage market is a trainwreck.
This scene from the film “McCabe and Mrs. Miller” sums up our political plight quite nicley. Politicians spend like crazy to stay in power (Biden/Harris) are excellent examples). Politicians promises endless money, then shoot the economy. The US is broke and relies on printing money and boowed funds to stay afloat. Harris wants to raise taxes on everyone to fund her plans like even MORE emphasis of failed green energy schemes and endless foreign wars. I doubt if Harris could defend her spending plans in light of the US already $35 TRILLION in debt.
Even more worrisome if thev fact that DC politicians have promised entitlements (Social Security, Medicare, etc. totalling $217.63 Trillion. Or 623% higher than the rapidly increasing national debt.
Biden/Harris raised thr national debt by 25% in less than 4 years. And Harris wants to increase spending! Harris wants illegal immigrants put on Social Security and Medicare, further bankrupting those entitlement programs.
Let’s see Harris explain her indefensible budget (like raising taxes and not hurting economic growth).
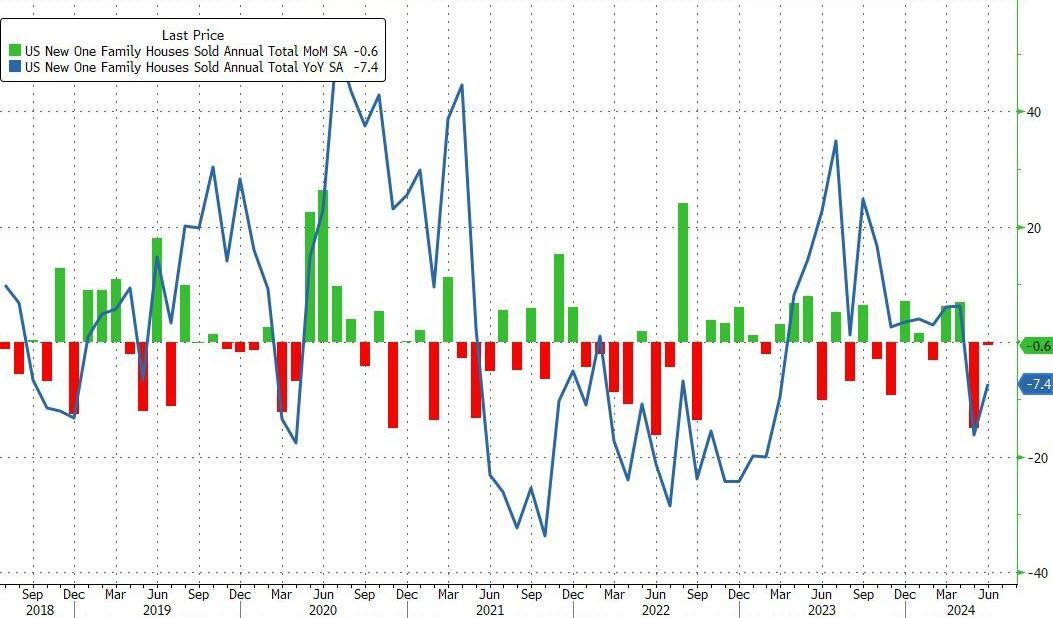
After a disappointing dump in existing home sales in June, new home sales just confirmed the slowdown, dropping 0.6% MoM (notably below the 3.4% MoM expected) and also saw a major downward revision in May from -11.3% MoM to -14.9% MoM. That leaves new home sales down 7.4% YoY…
Source: Bloomberg
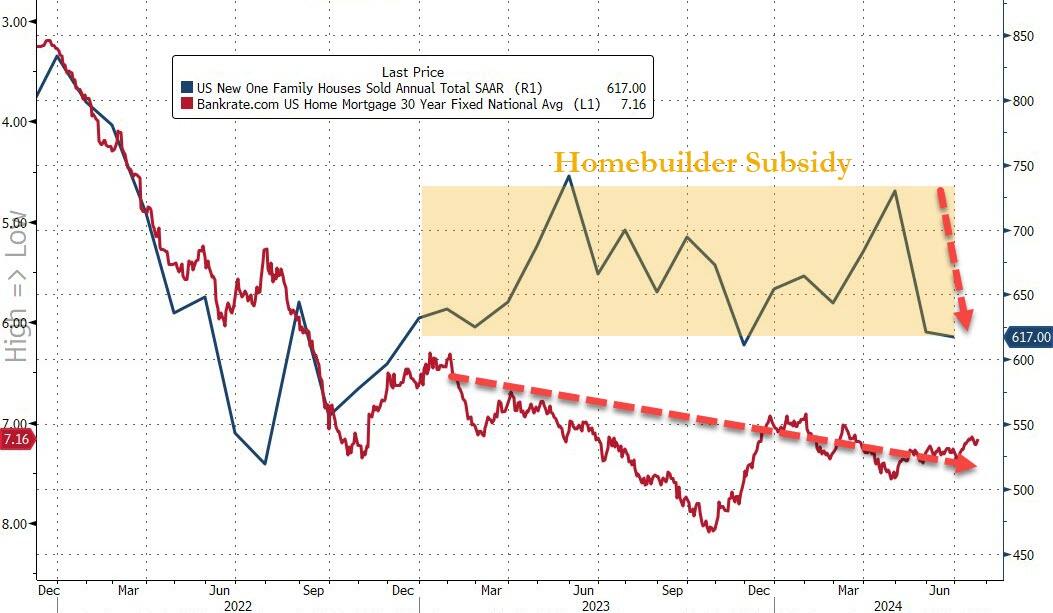
That shift dragged the new home sales SAAR down to 617k – basically unchanged since 2016…
Source: Bloomberg
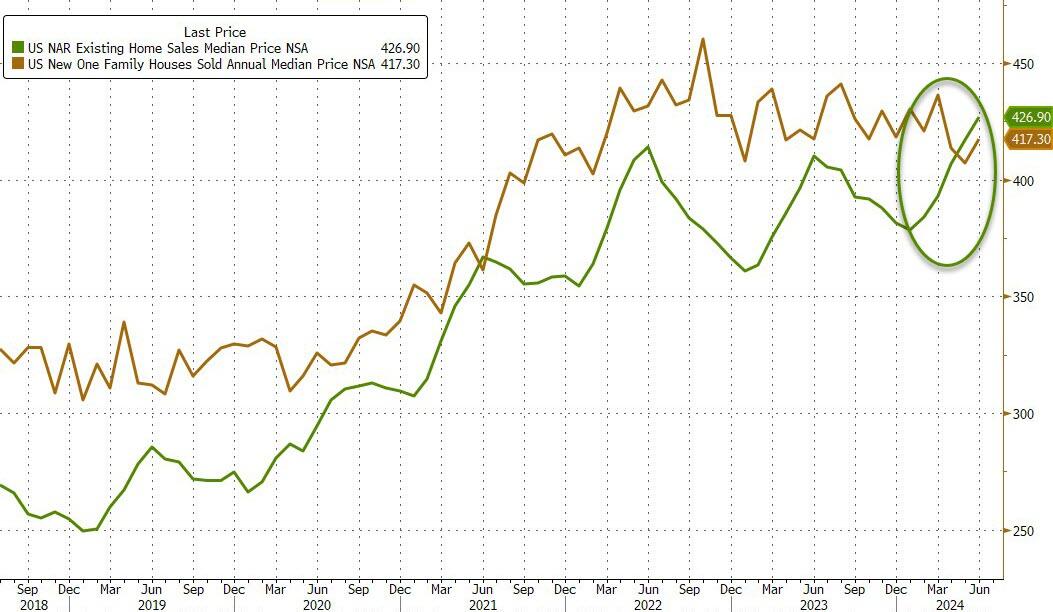
While the median new home price rose in June, it remains below the median existing home price…
Source: Bloomberg
It appears the homebuilder subsidy fad is wearing off as mortgage rates show no signs of easing significantly…
Source: Bloomberg
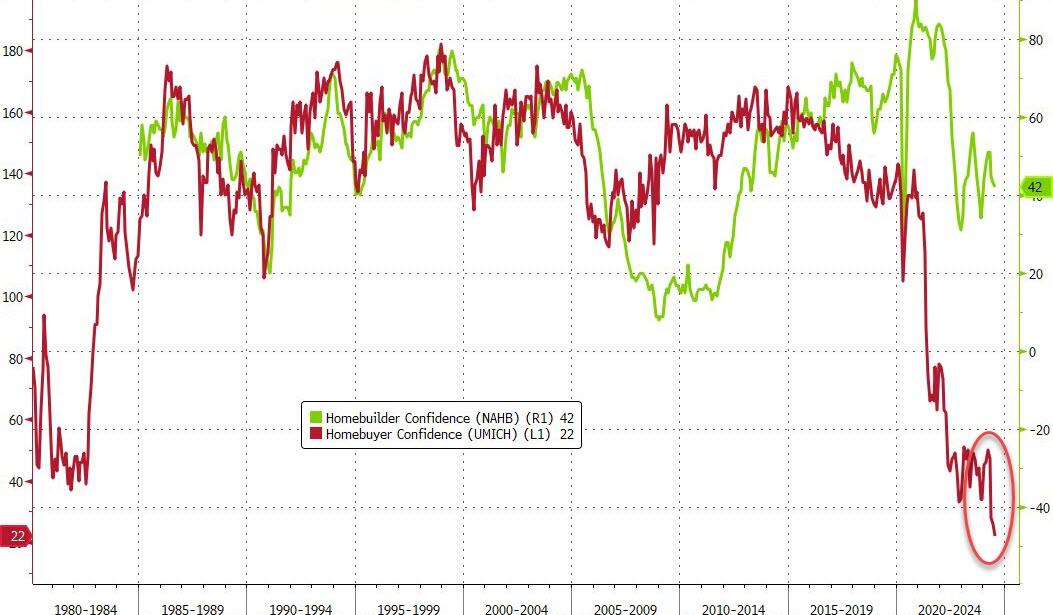
Of course, none of this should be a surprise as homebuyer confidence has collapsed to an all-time record low…
Source: Bloomberg
Will cutting rates help?
Probably not. Bidenomics is now called Harrisnomics (or Cacklenomics) since Harris as VP was the tiereaker in the US Senate. So, she holds some responsibility for the outrageous, wasteful spending in Washington DC.
Here is a chart of Non-commerciak net positions for US Treasuries, currently showing more bailing out of Treasury positions. Has the world sours on DC’s fiscal train wreck and The Fed?
Of course, budget deficits are a disaster with Biden/Congress spending like drunken sailors in port and showing no signs of letting up. The good news? At least a court struck down Biden’s illegal cancelation of student debt (a desperate attempt to win votes). That would have spiked the budget deficit.
As I pointed out yesterday, the UNFUNDED entitlements promised by the Federal government are now larger than that total national assets (business, household). In other words, if the US liquidated ALL assets, they couldn’t pay off the UNFUNDED entitlements. And good luck taking away the entitlements!
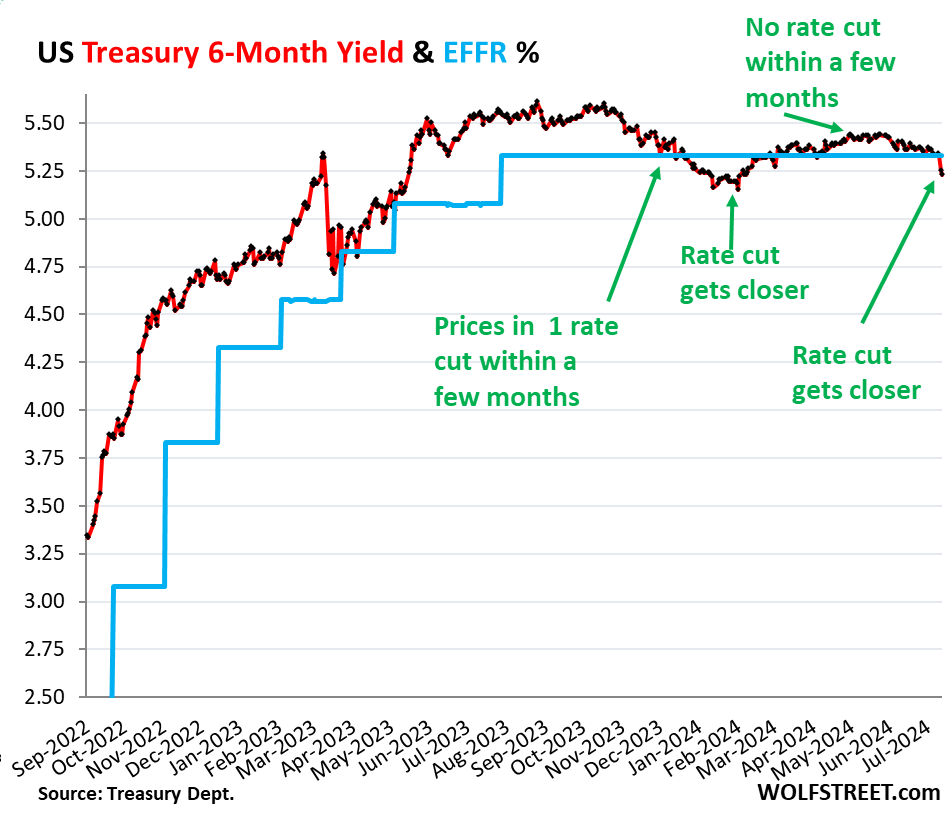
It brought the 6-month yield just a tad below the lower end of the Fed’s target range for the federal funds rate (5.25-5.50%), and below the effective federal funds rate (EFFR), currently 5.33% (blue in the chart below):
So the 6-month yield is now pricing in one rate cut within its 6-month window, more heavily weighted toward the first two-thirds or so of that window, after having already wrongly done so at the beginning of this year.
Back in late November through January, the 6-month yield had also priced in a rate cut within its 6-month window. By February 1, the yield had dropped to 5.15%, a sign the market was certain that there would be a rate cut at the March FOMC meeting.
But the market was wrong. Instead, we got a series of ugly inflation readings for January, February, March, and April, and there still hasn’t been a rate cut.
By March and April, with ugly inflation readings accumulating, rate cuts within the 6-month window of the 6-month yield were taken off the table.
May had provided a much softer inflation reading. And with Thursday’s CPI report of June, a rate cut within the 6-month window of the 6-month yield, weighted toward the first two-thirds of the window, was back on the table.
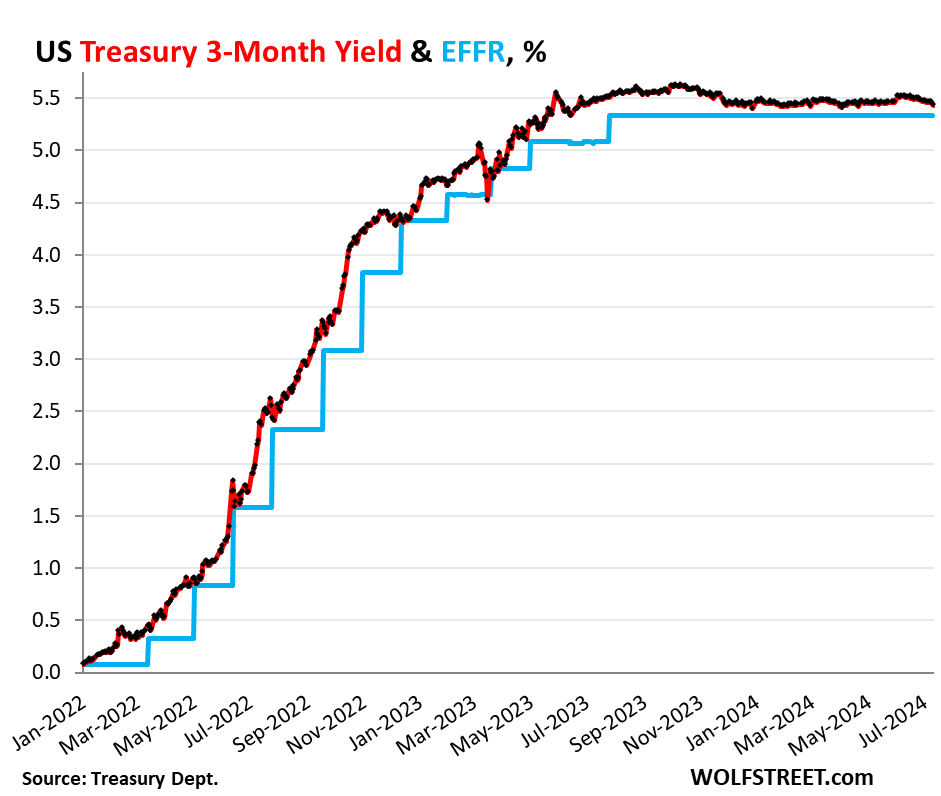
But the shorter-term Treasury yields are not pricing in a rate cut within their shorter windows. The shorter yields didn’t move much since the CPI report, and all were near the upper end of the Fed’s policy rates (5.5%), and all were above the EFFR (5.33%):
1-month yield: +1 basis point to 5.47%
2-month yield: +2 basis points 5.52%
3-month yield: -3 basis points to 5.43%
4-month yield: -5 basis points to 5.41%
In other words, the Treasury market is not expecting a rate cut in July at all, but sees a good chance of a rate cut in September, not as strong a chance as they saw in late January, when they saw a rate cut with near certainty by March that never came.
The three-month yield is not seeing any rate cuts within the first two-thirds of its window. No rate cut in July, and the September 18 FOMC meeting statement is beyond the first two-thirds of the window and has less impact on the current three-month yield:
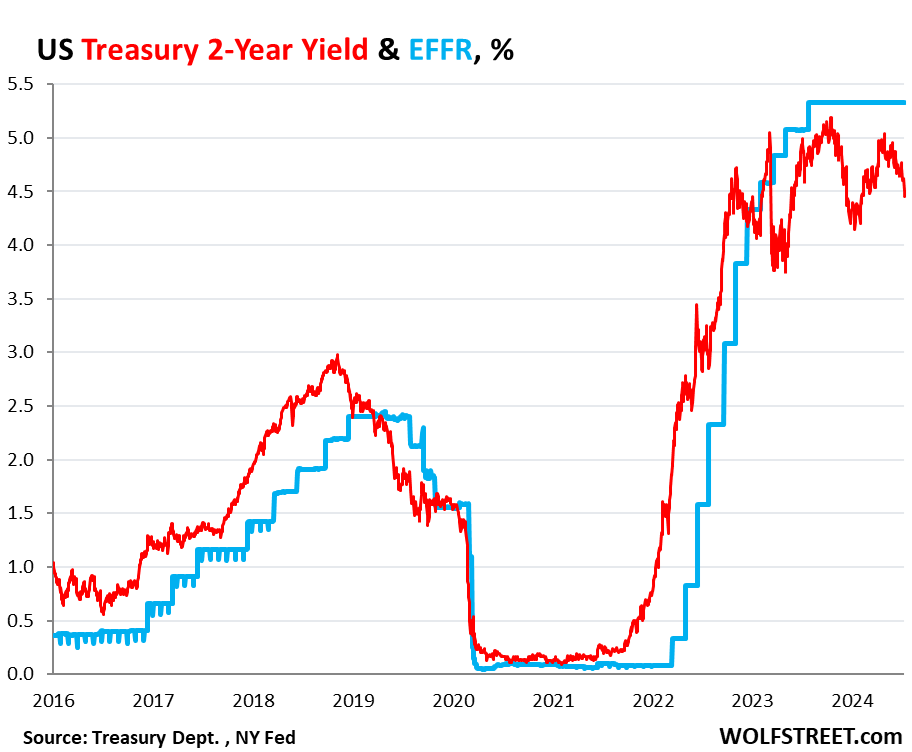
The market for the 2-year yield has been wrong all along.
The 2-year Treasury yield demonstrates how wrong the Treasury market has been all along about the Fed’s rate hikes and rate cuts: it expected far fewer and smaller rate hikes than what the Fed eventually did. And then without ever rising to the level that would price in the actual rates that the Fed has held for nearly a year, it started pricing in rate cuts before the Fed even stopped hiking rates.
So back in April 2022, the two-year yield was about 2.5%. Now, today, 2.5% sounds like a lousy yield, but back then – after 15 years of near-0% interrupted by a few years of higher yields that maxed out at around 2.4% in 2019 – 2.5% sounded pretty good, and the market thought that was getting pretty close to the Fed’s terminal rate.
In February 2022, before the Fed’s rate hikes started, Goldman Sachs predicted that the Fed would hike seven times in 2022, each by 25 basis points, and then in 2023 three times by 25 basis points each, one hike per quarter, to reach a terminal target range for the federal funds rate of 2.5-2.75% by Q3 2023.
The Fed ended up doing more double that, and by July 2023.
So the 2-year Treasury note that sold at auction in April 2022 with a coupon of 2.5% and with a yield close to that sounded like a good deal, and we, being part of the Treasury market, nibbled on some too. Two years was as long as we went. The rest of our Treasuries are T-bills.
Those 2-year notes matured in April 2024, and we got paid face value, and we earned about 2.5% in interest each year over those two years. The entire market was wrong – and so were we. The Fed would raise to 5.25-5.5% by July 2023, more than double the yield we received, and its rate is still there, and the yields of our two- three- and four-month T-bills have by far outrun our 2-year note.
The 2-year yield closed at 4.45% on Friday. The market never once came even close to betting that the Fed would hold rates above 5% for long, and they’ve been above 5% for over 14 months. And the 2-year yield has been below the EFFR for almost the entire time since January 2023, having turned into the Doubting Thomas.
The market was wrong about the Fed’s rates, and all 2-year notes that were bought at auction and that matured in 2024 or will mature in 2024 were a lousy deal. Buyers would have been better off with a series of short-term T-bills that stick closely to Fed’s actual policy rate — rather than follow market projections.
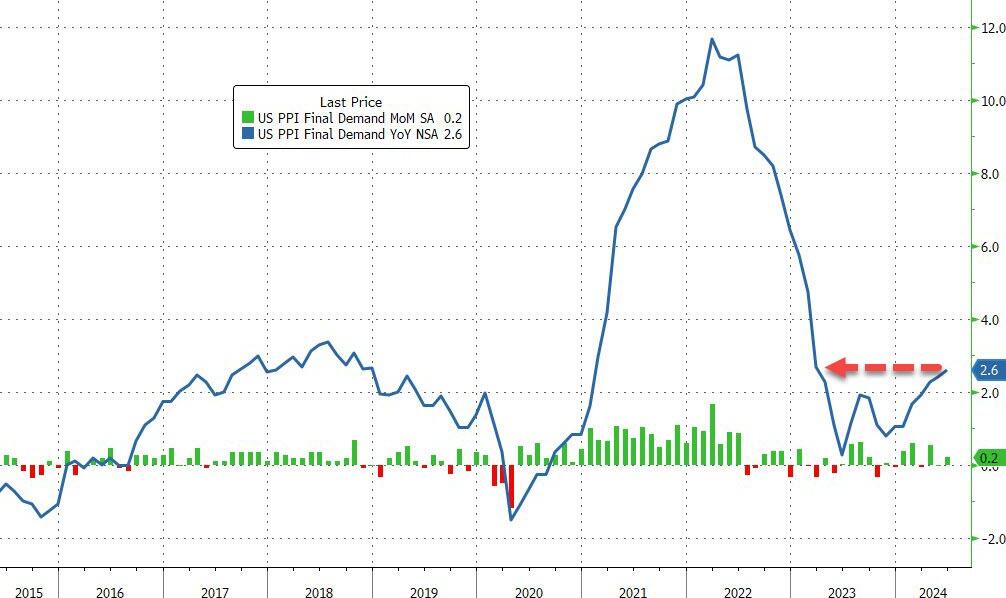
Someday, the market is going to get the rate-cut bets right. But it will only take a few more lousy inflation readings for the rate cuts to get moved further into the future. On Friday, the PPI showed up with red-hot services inflation, now delineating a clear U-Turn in December. Producers that pay those higher prices for services will try to pass them on, and so they may ultimately filter into consumer prices and higher inflation readings over the next few months. Or if producers cannot pass on the higher costs of services, their margins will get squeezed.
Inflation is unpredictable. Once inflation has broken out in a big way, as history shows us, it tends to come in waves and tends to dish up nasty surprises. And it already has dished up nasty surprises multiple times so far, including each of the first four months of this year.
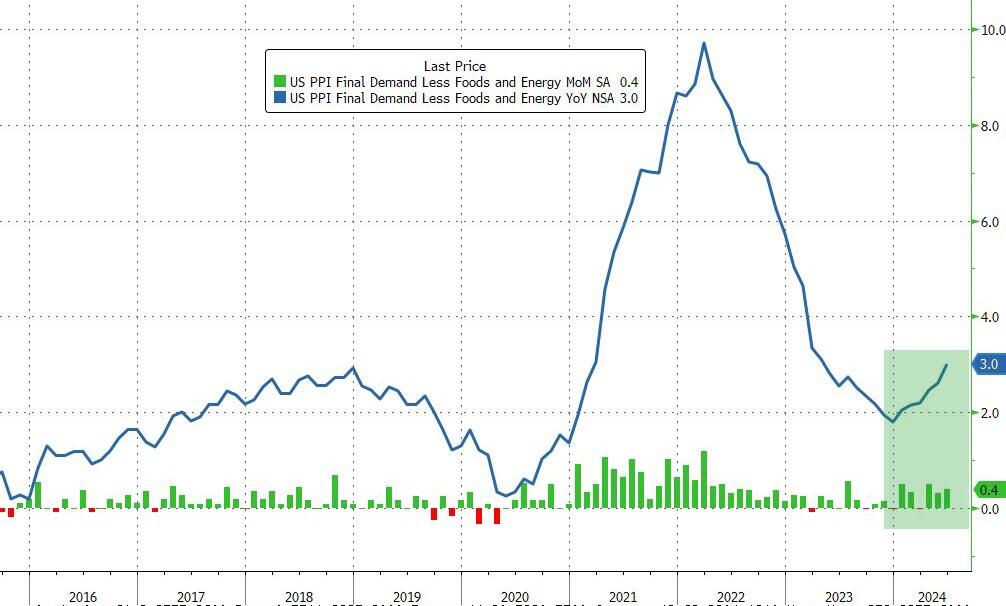
Core PPI rose by 0.4% MoM (double the 0.2% exp), sending the YoY price rise up by 3.0% (also the hottest since March 2023)…
Source: Bloomberg
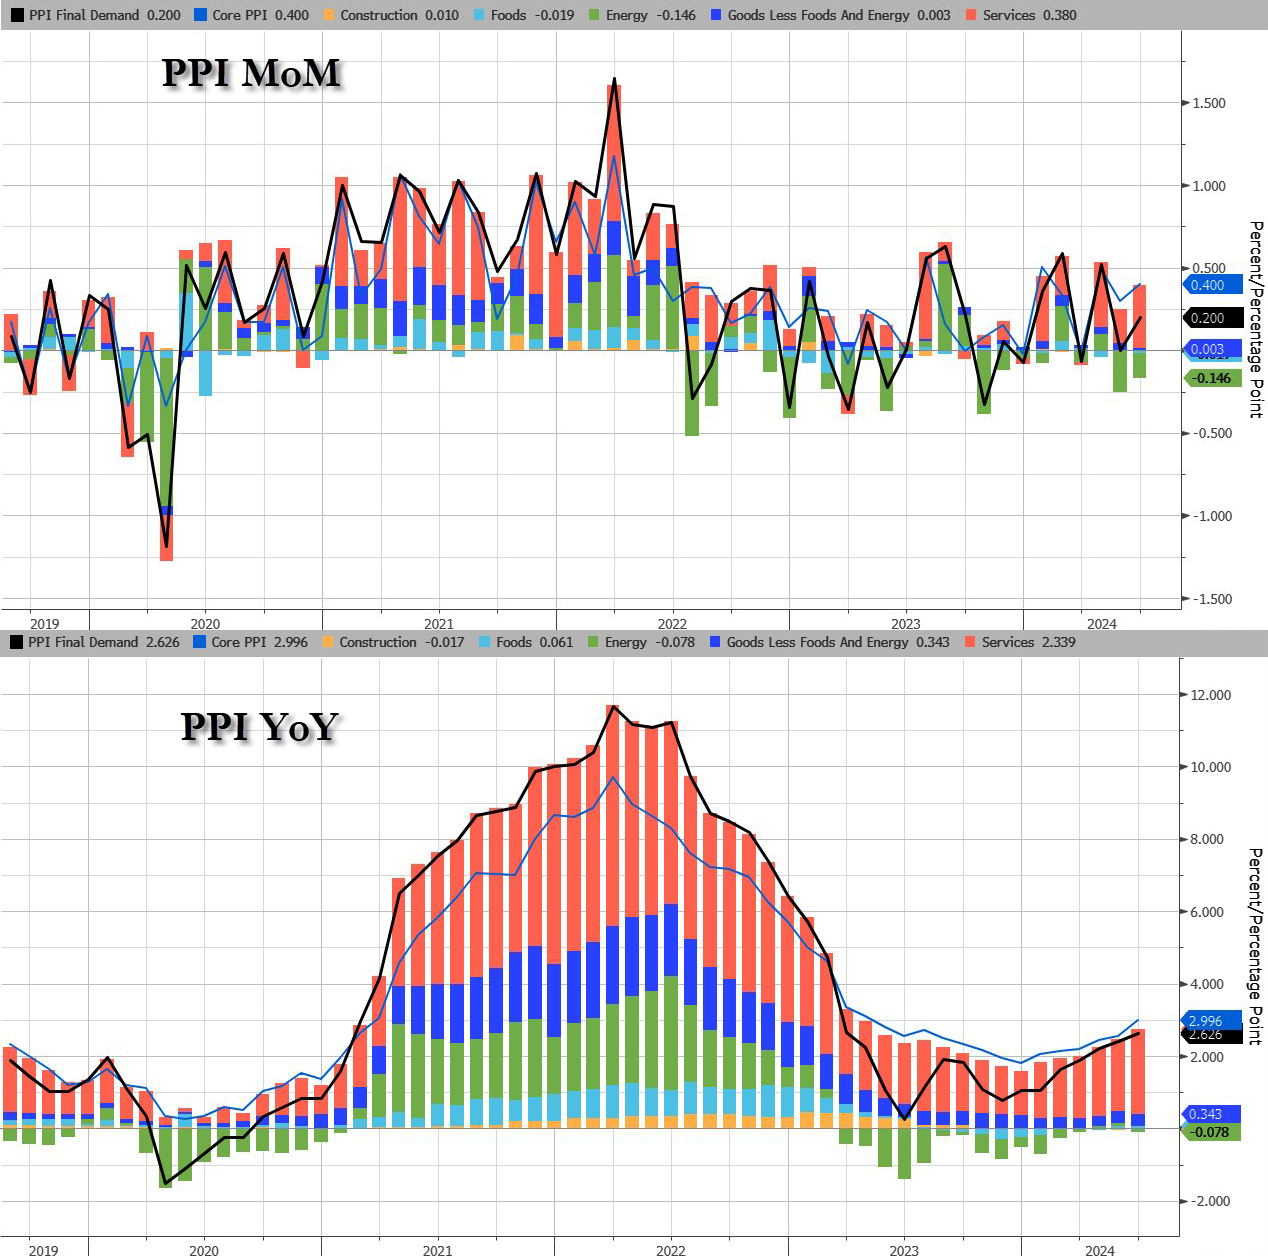
The jump in PPI was driven by a resurgence in Services costs as Energy remains deflationary (for now)…
Source: Bloomberg
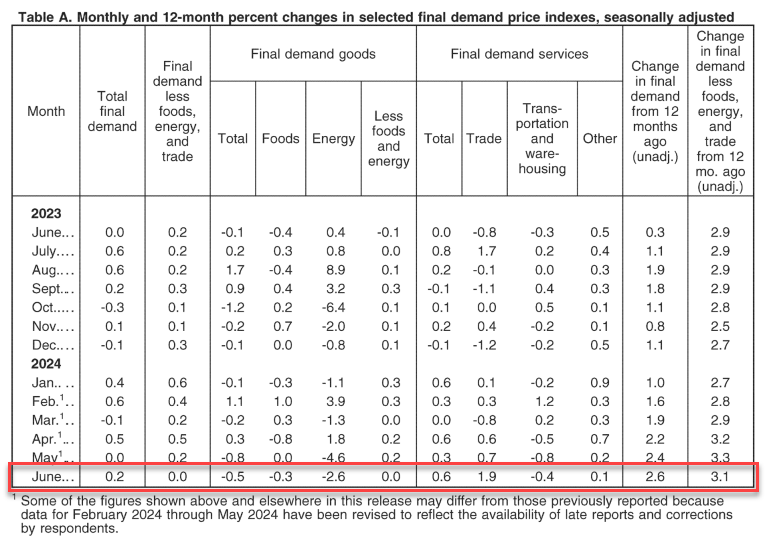
The June rise in the index for final demand can be traced to a 0.6-percent increase in prices for final demand services. In contrast, the index for final demand goods decreased 0.5 percent
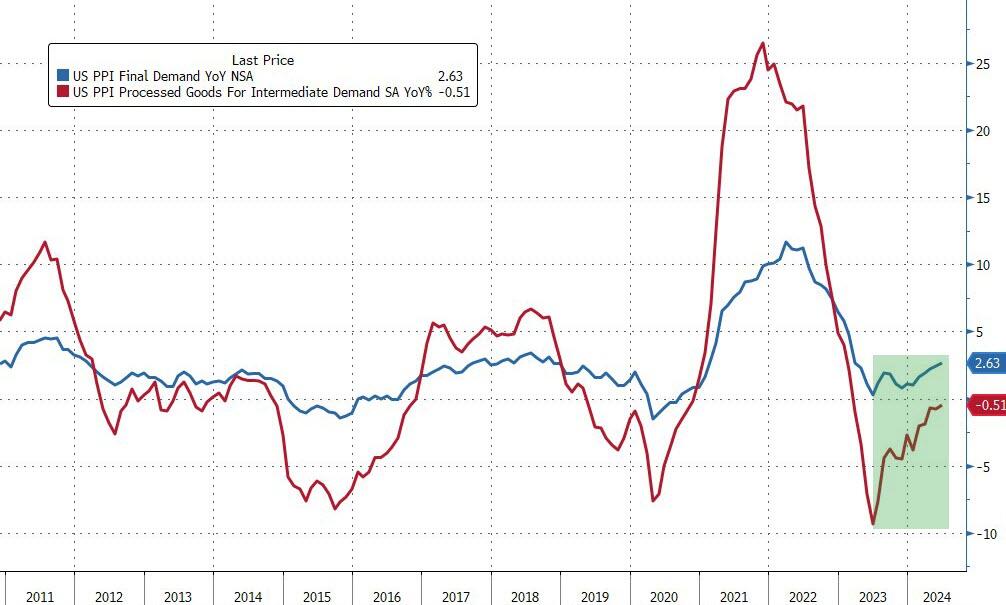
Perhaps worse still, the pipeline for PPI (intermediate demand) is accelerating…
Source: Bloomberg
On the housing side, buying conditions for housing tanks to all-time low.
Are you ready? You can tell an election is on the radar since inflation numbers are settling down for the most part. According to the BLS, overall inflation fell slightly in June to 3.0%.
Shelter CPI is up 5.14% YoY as M2 Money growth has been rising slowly … again.
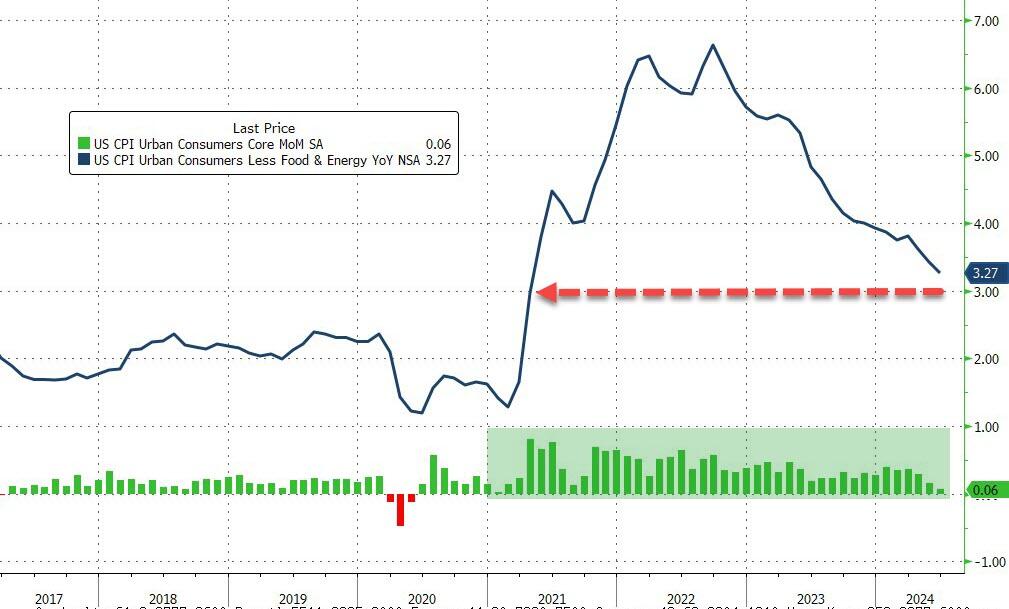
Core CPI also ‘missed’, rising just 0.1% MoM (vs +0.2% exp), dragging the YoY Core CPI down to +3.27% – its lowest since April 2021…
Source: Bloomberg
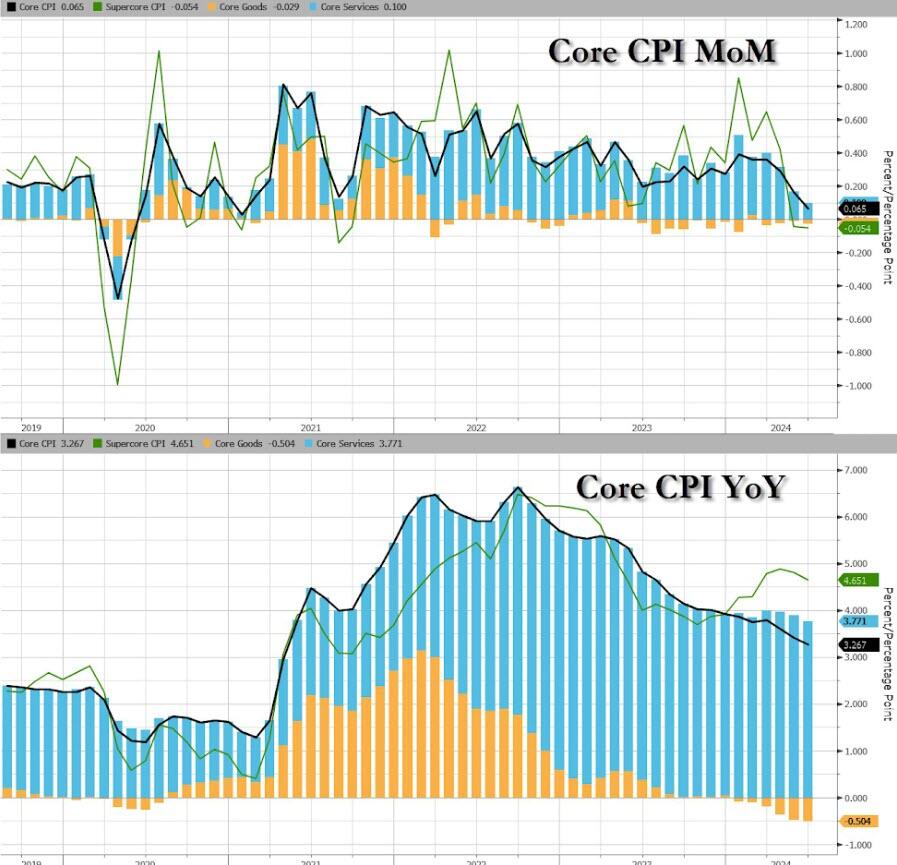
Goods deflation also dominates core prices disinflationary trend…
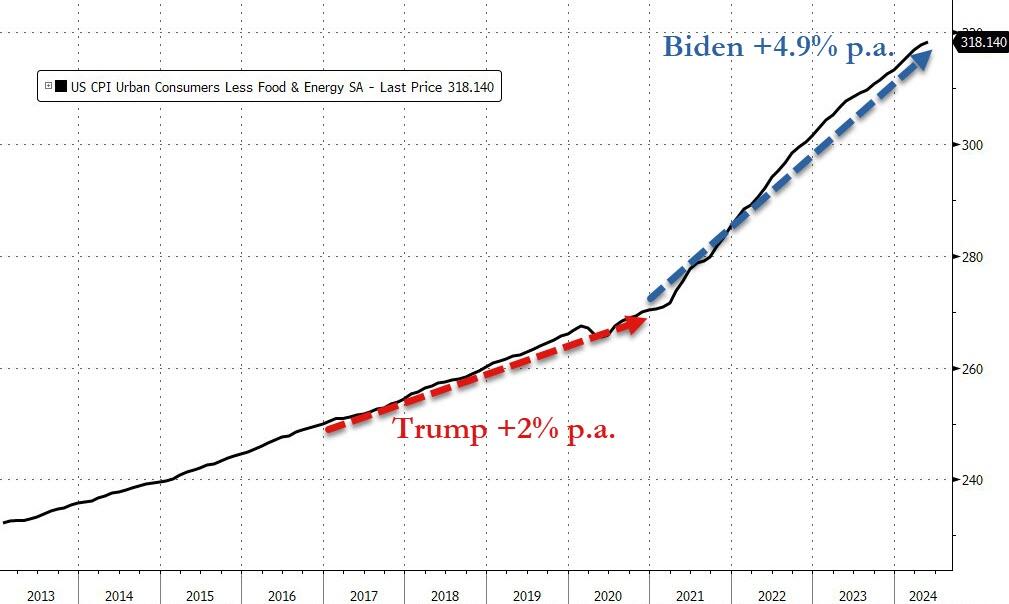
We do note that Core consumer prices have still not seen a single monthly decline since Bidenomics began.
Core consumer prices are up just under 18% since Bidenomics began (+4.9% per annum) – that is dramatically higher than the 2.0% per annum Americans experienced under Trump…
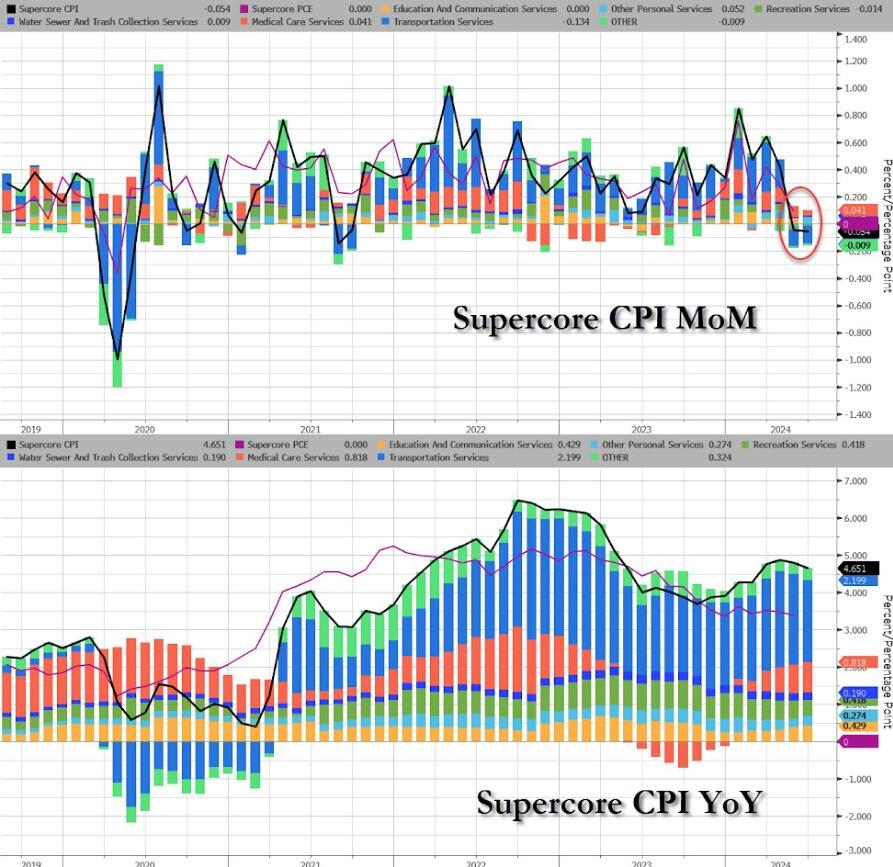
The much-watched SuperCore CPI rose on a MoM basis but declined (back below 5.0%) on a YoY basis (but obviously remains extremely elevated)…
Source: Bloomberg
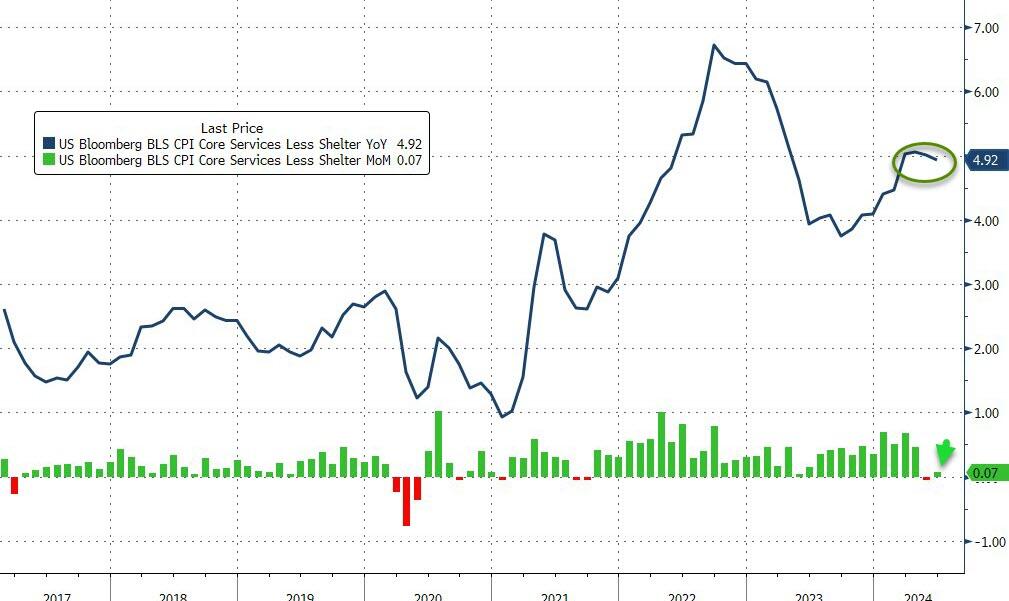
Transportation Services are seeing prices fall…
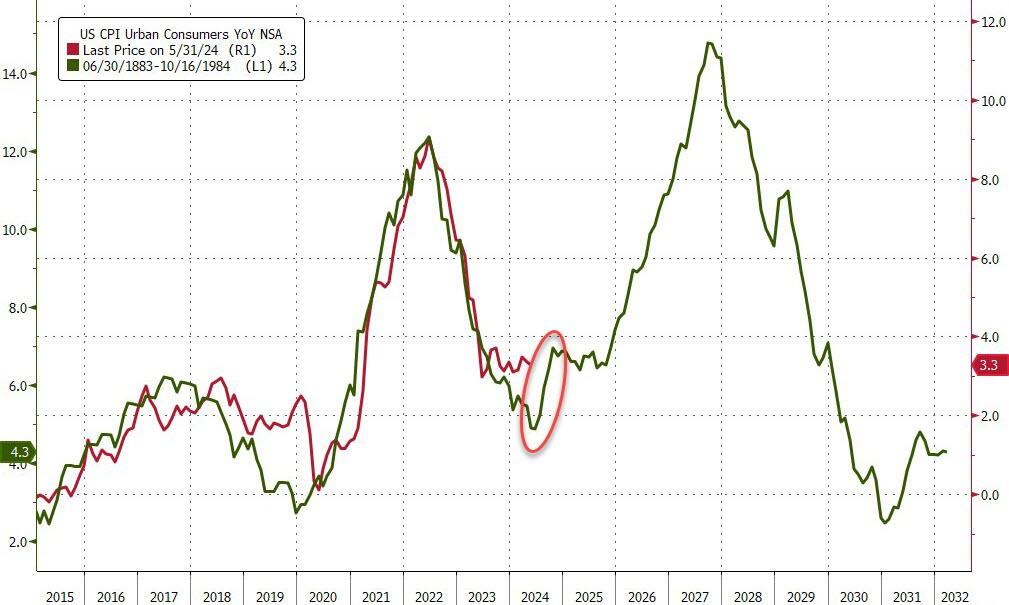
Finally, we can’t help but get a sense of deja vu all over again here. What if… The Fed cuts (because bad – recession – data), Biden loses (because dementia), and inflation re-accelerates (just like in the 80s)…
Source: Bloomberg
Challenger job cuts in construction we the highest since 2008 putting downward pressure on wages.
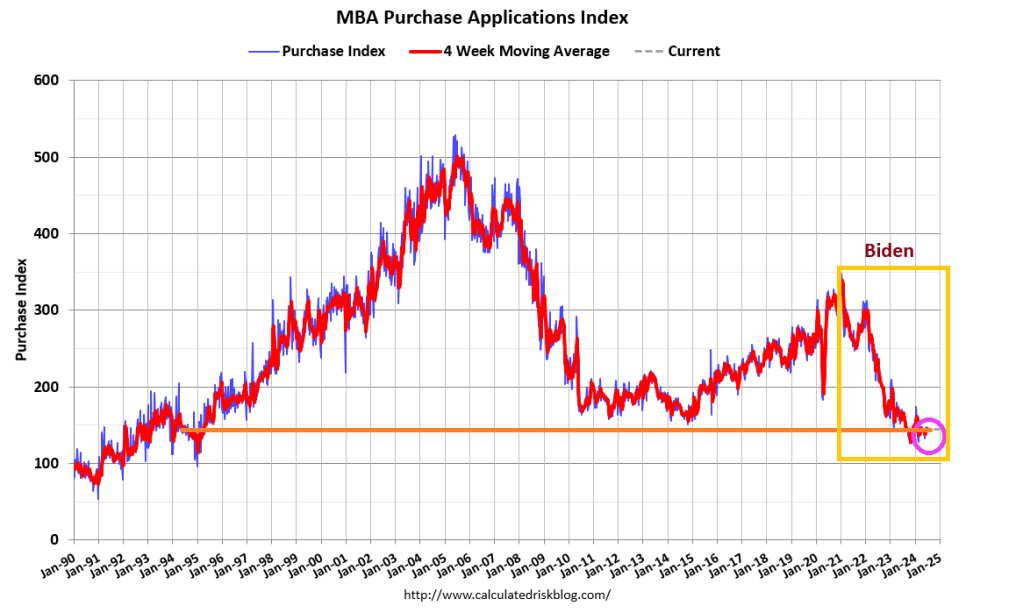
Mortgage applications decreased 0.2 percent from one week earlier, according to data from the Mortgage Bankers Association’s (MBA) Weekly Applications Survey for the week ending July 5, 2024. Last week’s results included an adjustment for the July 4th holiday.
The Market Composite Index, a measure of mortgage loan application volume, decreased 0.2 percent on a seasonally adjusted basis from one week earlier. On an unadjusted basis, the Index decreased 20 percent compared with the previous week. The seasonally adjusted Purchase Index increased 1 percent from one week earlier. The unadjusted Purchase Index decreased 19 percent compared with the previous week and was 13 percent lower than the same week one year ago.
The Refinance Index decreased 2 percent from the previous week and was 28 percent higher than the same week one year ago.
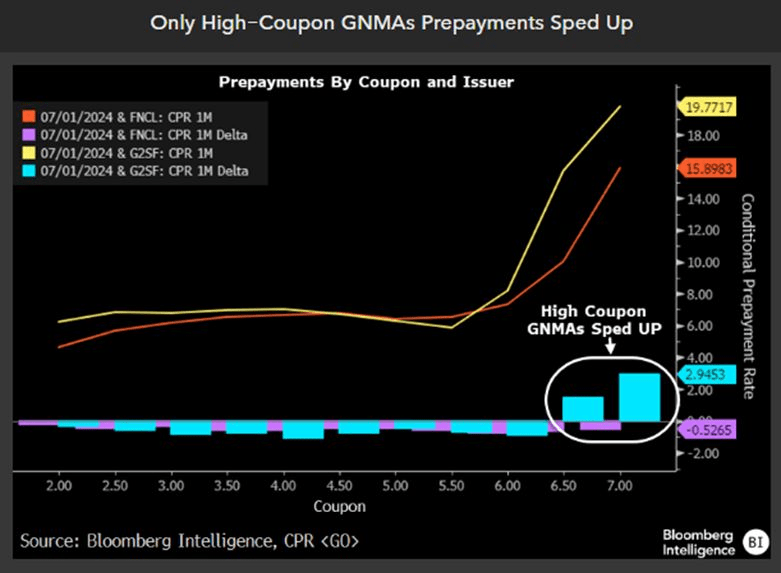
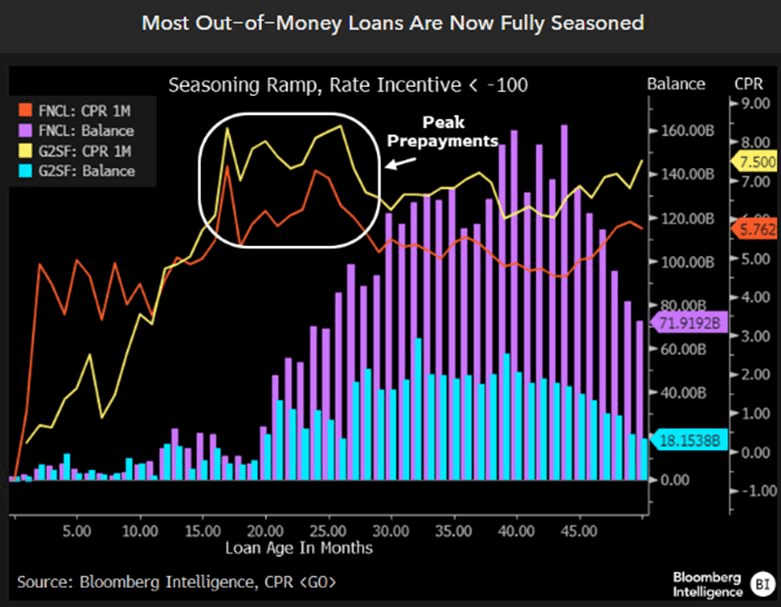
Mprtgage prepays fell less than daycoiunt.
But on;y high-coupn GNMAs prepayments sped up.
Finally, most out-of-the-money loans are now fully seasoned.


You must be logged in to post a comment.